EP1306742A2 - A graphical interface - Google Patents
A graphical interface Download PDFInfo
- Publication number
- EP1306742A2 EP1306742A2 EP02257025A EP02257025A EP1306742A2 EP 1306742 A2 EP1306742 A2 EP 1306742A2 EP 02257025 A EP02257025 A EP 02257025A EP 02257025 A EP02257025 A EP 02257025A EP 1306742 A2 EP1306742 A2 EP 1306742A2
- Authority
- EP
- European Patent Office
- Prior art keywords
- level
- test
- results
- tree structure
- sub
- Prior art date
- Legal status (The legal status is an assumption and is not a legal conclusion. Google has not performed a legal analysis and makes no representation as to the accuracy of the status listed.)
- Withdrawn
Links
Images



Classifications
-
- G—PHYSICS
- G06—COMPUTING OR CALCULATING; COUNTING
- G06F—ELECTRIC DIGITAL DATA PROCESSING
- G06F11/00—Error detection; Error correction; Monitoring
- G06F11/22—Detection or location of defective computer hardware by testing during standby operation or during idle time, e.g. start-up testing
-
- G—PHYSICS
- G06—COMPUTING OR CALCULATING; COUNTING
- G06F—ELECTRIC DIGITAL DATA PROCESSING
- G06F11/00—Error detection; Error correction; Monitoring
- G06F11/22—Detection or location of defective computer hardware by testing during standby operation or during idle time, e.g. start-up testing
- G06F11/26—Functional testing
- G06F11/273—Tester hardware, i.e. output processing circuits
Definitions
- the present invention relates to an electronic test system preferably for performing automated tests of complex electronic, electromechanical and mechanical equipment and products.
- the system includes a tree structure for summarizing the results of the test.
- Test systems are used to check the status and performance of complex electronic, electromechanical and mechanical products and equipment. Such tests can include validation tests which run through the various operations that the device under test (DUT) is capable of and records whether each operation was performed properly; environmental tests which expose the DUT to various combinations of temperature, pressure, and humidity, and records the results; production tests, etc. Generally, both the DUT and the systems providing the environmental and other constraints on the DUT are controlled electronically. In the last decade or so, computerized programs which are capable of controlling a variety of automated tests, referred to in the art as "test executive" programs, have been developed.
- Tests usually are defined by a set of rules or specifications to which the DUT is compared.
- the rules or specifications generally comprise various inputs defined by electrical and mechanical parameters applied to the DUT, such as voltage, current, specified manipulations of controls and device parts, as well as environmental parameters under which the test is conducted, such as temperature, humidity, pressure, and the time period over which a parameter is applied.
- Each test will include many combinations of the parameters applied to each element of the DUT, and often will be repeated many times. Thus, as equipment and products become more complex, electronic test programs have become very long and complex, often requiring several days, or even a week or more to run a complete test.
- Test executive programs in the prior art include internal test executive programs developed by Agilent Technologies and TESTSTAND software developed by National Instruments Corporation, which is described as a ready-to-run test executive for organizing, controlling, and executing automated prototype, validation, or production test systems.
- the prior art Agilent Technologies programs did not use a graphical user interface, and thus it was usually tedious to examine the complete results of a test.
- the TESTSTAND software showed the results in a spreadsheet structure that was not easy to analyze.
- the prior art software at best was limited to showing the results of a given measurement by colored test such as "passed” in blue color, "skipped” in yellow color and “failed” in red color. Therefore, it takes significant time to scan textual results to determine what further action is needed. When a test fails, it is usually necessary to examine the details of the test further to find the source of the failure before taking further action.
- the present invention seeks to provide an improved test system.
- the preferred embodiment can provide a test executive system in which test results are more easily selected and analyzed; by allowing the user to see the results of the test on a display in a form of a hierarchical tree structure. That is, the results are displayed in a multilevel structure having a highest level and one or more sublevels. In each branch of the tree, the results are summarized from each sublevel to the next highest level. That is, if a selected result is recorded at a sublevel, this results is passed up to the next level, which displays the result. Thus, a high level scan of the test results will quickly show the selected results.
- a tree structure is any structure organized in the manner of the branches of a tree. That is, a tree is organized as a trunk, to which one or more branches are attached. Each branch in turn has one or more sub-branches attached to it, and so forth, until we reach the level of a twig, which has no additional branches, attached. Whether the "trunk” or the "twig” is considered the highest or lowest level is arbitrary. In this disclosure, we shall consider the main level, or trunk, the highest level, and lower levels will be considered as sub-levels of the next higher level. Thus, a tree structure is a hierarchical configuration having multiple levels, which each sub-level having a number of entries equal to or great than the next higher level. Preferably, the user can "click" on a branch to open a level and see where the branch leads.
- the levels of the tree structure preferably correspond to the hierarchical levels in the execution of a test procedure.
- the highest level which we shall refer to as the first or top level, represents the result for the whole test procedure.
- Level two represents the results of various tests.
- Level three represents the results of various measurements performed in a test, and level four represents the results for various datapoints for a given measurement.
- the levels of the hierarchy starting from the highest level, are preferably, procedure, test, measurement, and datapoint.
- the non-optimal results are summarized, and most preferably, the least optimal result is summarized.
- the optimal result is summarized up to the highest level.
- the optimal result is "pass”.
- the electronic test output is displayed through an easy-to-use graphical user interface (GUI).
- GUI graphical user interface
- the portion of the display containing the tree structure is preferably a small portion of the graphical user interface (GUI) where the results of the tests are preferably displayed as graphical elements.
- the results are also displayed as textual elements.
- Each level in the tree structure is, preferably, characterized by a graphical element.
- the graphical element provides the information on the status of the result at that level.
- the graphical element consists of a single graphical element, such as an icon.
- each icon is coded to indicate to the user the status of each result.
- the code is an assigned symbol and/or a color.
- each icon is colored to help the user instantly evaluate the outcome of each test. For example, the color red is assigned to a "fail" result.
- the tree structure also includes simple alphanumeric information describing the nature of each level.
- the alphanumeric characters are, for example, a text string providing the function or parameters of the level.
- the tree structure is an expandable tree structure. That is, when the tree structure displays only the main branches, the user activates a branch by clicking on the icon corresponding to that branch, and it expands by showing daughter branches which are sub-levels in the execution of the test program as previously mentioned. Similarly, by clicking again on a branch, the daughter branches are hidden and summarized on the next higher level.
- the preferred embodiment not only provides an electronic test program that displays the overall output in a form that can be easily and quickly evaluated, but also displays the output in an intuitive manner which permits the user to quickly check individual results.
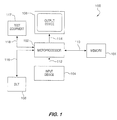
- the test system preferably comprises a computer 100.
- Computer system 100 includes a memory 101, a microprocessor 102, an input device 104, and an output device 106.
- Memory 101 communicates with microprocessor 102 via electrical line 110.
- Input device 104 communicates with microprocessor 102 through electrical line 112.
- Microprocessor 102 outputs the data through output device 106 via electrical line 114.
- the test system can take the form of software stored in memory 101 and run or executed by processor 102.
- the user interacts with the test system through input device 104 such as, but not limited to, a keyboard, a mouse, a track ball, a touch pad, or a joystick.
- the input device 104 allows moving a cursor or a pointer on the output device 106, that is, a display system such as a cathode ray tube monitor or a liquid crystal display.
- the results of the test are displayed on the output device 106.
- the test is controlled by processor 102, which communicates the instructions of the test program to the product under test or device under test (DUT) 108 via electrical line 116.
- Processor 102 controls test equipment 117 via electrical line 118.
- the test results are processed by processor 102 and stored in memory 101 to be visualized by display 106.
- the display information contains both information as to the configuration and position of the cursor and other visual information of interest to the user such as the results of the test and
- test system may be implemented in a variety of actual electronic devices that follow the general form outlined on FIG 1.
- the test system may be. embodied in a computer system, or it may also be embodied in the hardware as a logic circuit, or it may be embodied as an electronic testing device such as, but not limited to, an electronic analyzer. In some embodiments, no test equipment is required, so test equipment 17 is not present.
- FIG. 2 there is shown a block diagram 200 illustrating the hierarchical, i.e., multi-level, characteristic of the test program.
- the first level 201 corresponds to the product model, a file the test developer creates to test a family of specific device model numbers. It contains test procedures and inputs.
- the next level 202 corresponds to the procedure itself.
- a procedure is an ordered list, sequence, or script of tests to be run.
- Several procedures may exist, which is represented in FIG. 2 by a deck of cards 202, each representing a different procedure.
- Each procedure includes a plurality of tests, i.e., test 1, test 2, test 3... test N, as shown at 203.
- Each test includes a plurality of measurements. This is illustrated in FIG. 2 for test 2 shown at 205.
- test 205 includes measurements 207, i.e., measurement 1, measurement 2... measurement N.
- Each measurement includes one or more datapoints, each datapoint represented as one of the cards 210, 211, 212 in a stack of cards 214 associated with each measurement.
- a procedure is defined by writing a program or a code to build a structure of software objects.
- the software objects are Component Object Model (COM) objects.
- COM is a language-independent component architecture, not a programming language. It is meant to be a general purpose, object-oriented means to encapsulate commonly used functions and services. See Newton's Telecom Dictionary by Harry Newton, Publishers Group West, page 197.
- a test 205 is a group of measurements 207 in a procedure 202 that share the same test algorithm or the same test software code. Some examples of tests include amplitude accuracy test, test of harmonic distortion, etc.
- the test program repeatedly calls a test for each measurement and datapoint.
- a measurement such as measurement 206, is a configuration or a set up for a test.
- Each measurement, in measurements 207, within a test 205 can have different setups or configuration parameters.
- Tests are parameter driven and the parameters are inputs at the measurement level. Measurements are elements such as range in volts, frequency in kilohertz or harmonic (an integer number).
- the test procedure 202 views the measurements 207 as data to be passed from the procedure to a test.
- a measurement is also a phase of test execution. During the measurement phase of test execution, the measurement is started but data is not collected. This allows for multiple devices under test (DUTs) to be configured and triggered together.
- DUTs devices under test
- a datapoint such as 210, 211, 212, is a subset of a measurement, such as 206, containing additional parameters that select a result when one measurement generates multiple results.
- Some examples of multiple datapoints for a measurement are the minimum and maximum of a spectrum analyzer sweep or each channel of a device.
- a value result is extracted.
- the results obtained are compared to specifications.
- Specifications are numerical limits, string match, or Boolean pass/fail. There are three sets of limits: marginal limits, production line limits, and customer limits. Each limit has an upper and a lower value.
- FIG. 3 shows the graphical user interface 300 as displayed on the output device 106.
- the "tape recorder" type buttons 301 on the top left are used to control the test. From left to right, the buttons are: abort 302, restart test 303, restart measurement 304, pause 305, run 306, skip measurement 307, skip test 308.
- the right side 314 of the graphical user interface 300 shows a window 340 comprising a series of rows, such as 315, and columns, such as 316.
- Window 340 displays the time 317 the test is run, as well as the status of the test 318.
- the value or result of the measurement such as (0.1235 dB) in
- the test results can be sorted by clicking on the "view" buttons in window 325 above the window 340. This allows either all the test results to be displayed, or permits the results to be filtered and displayed depending on their marginal or failed status.
- the bottom right window 330 is a progress window indicating the progress of the test procedure.
- GUI 300 On the left side of the graphical user interface (GUI) 300, the preferred embodiment of a tree window 309 is shown.
- Window 309 includes a hierarchy of tests, measurements, and datapoints. Icons corresponding to the results indicate pass, fail, marginal and not-yet-tested. "Smiling" 310, “surprised” 311, and “sad” 312 icons correspond respectively to the pass, marginal, and fail status.
- the pass/fail icon 313 on top of the window is for the entire procedure. It summarizes the status of all the tests with "fail" having priority. That is, if there is one failed test, the whole procedure is fail.
- an algorithm that promotes the least optimal results is used to compute the final status of the procedure.
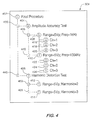
- FIG. 4 An enlarged view of tree window 309 is shown in FIG. 4.
- the tree structure contains multiple levels with the first or highest level corresponding to the final test procedure shown with icon 402. This is considered the trunk of the tree structure.
- the second level in the execution of the test procedure comprises one or more tests, such as 404, each including one or more measurements, such as 408.
- the second level includes two tests: an amplitude accuracy test shown with its corresponding result icon 404, and a harmonic distortion test shown with its result icon 406; this test level corresponds to the first generation branches extending from the trunk.
- This level corresponds to the second-generation branches in the tree.
- This level corresponds to the third-generation branches in the tree.
- the tree structure 309 is expanded or retracted by "clicking" on a "+" or "-” sign next to the icon corresponding to the result for each level, such as the "-" sign 430 next to result icon 404, the "-" sign 435 next to result icon 408, the "-" sign 440 next to result icon 410, the "-” sign 445 next to result icon 406, etc.
- the tree structure is preferably retracted to only display the trunk; that is, the result for the final test procedure 402 and the results for the first-generation branches, such as 404 and 406, respectively, amplitude accuracy test and harmonic distortion test.
- the sign next to the result icon is "+”, such as 450 and 455, this means that daughter branches, i.e., sub-levels, are not displayed. However, the user can activate the tree structure in order to show more detail as to where each branch leads by "clicking" on the "+” sign next to the result for the parent branch. If the sign next to the result icon is "-", such as 430, 435, 440, 445, this means that daughter branches are displayed and the user can expand further the tree to explore next generation branches.
- each result icon is color coded to indicate the status of the result.
- the color green is assigned to a "pass” result
- the color red is assigned to a "fail” result
- the color yellow is assigned to a “marginal” result
- no color is assigned to a "not-yet-tested” result.
- the result for a level is determined by applying an algorithm where the least optimal result, e.g., "fail” is given precedence over optimal results, e.g., "pass".
- Another way of expressing the summarizing function is that, in the tree structure, the results are summarized to the higher levels. That is, if a test fails at a datapoint level, for example, that failure is shown at the measurement level, the test level, and the procedure level. The user can investigate where a fail result originated by following the results in each branch directly connected to the shown result. In practical terms, for example, the user sees a fail result in final procedure 402 and would like to investigate where the fail result originated. The user opens the first generation branches 404 and 406. Icon 404 shows a fail result and icon 406 a not-yet-tested result. Therefore, the user decides to look further along the branch where the fail in icon 404 originated.
- the user opens 404 by clicking on the "+" sign next to it to show daughter branches 408 and 410.
- Icon 410 shows a marginal result and icon 408 shows a fail result. Therefore, the user opens branch 408 to show results 416, 418, and 420.
- the user sees a fail result at 420.
- FIG. 5 shows an alternative embodiment of tree window 500.
- 500 represents another form for a tree structure wherein the trunk of the tree, also called the first level, is displayed as the cosmic universe shown with its corresponding result icon 502.
- the second level in the execution of the test procedure is a test. This level is displayed as a galaxy, such as 504, 506, and 508.
- the icon 510 at the center of galaxy 504, the icon 512 at the center of galaxy 506, and the icon 514 at the center of galaxy 508 represent the results at the test level.
- the third level in the execution of a test procedure represents the measurement itself with its corresponding result icons, such as 516 and 518 in test 504. This level is represented by stars displayed as circular icons such as 516 and 518 in the arms of galaxy 504.
- the fourth level in the execution of the test procedure represents datapoints in a measurement, with their result icons such as 520, 522, and 524 in measurement 518.
- This level is displayed as planets such as 520, 522, and 524 gravitating around star 518.
- the size of the icons representing the results at each level increases with the hierarchy in the test. For instance, the icon 510 corresponding to the result at the test level is bigger that the icon 518 corresponding to the result at the measurement level.
- icons are coded to indicate pass, marginal, fail, or not-yet-tested results at each level in the execution of the test procedure.
- the result for the whole test procedure is also color coded and displayed on the icon 502. The user can instantly detect and locate where a fail result originated by looking at this picture "universe".
Landscapes
- Engineering & Computer Science (AREA)
- General Engineering & Computer Science (AREA)
- Theoretical Computer Science (AREA)
- Computer Hardware Design (AREA)
- Quality & Reliability (AREA)
- Physics & Mathematics (AREA)
- General Physics & Mathematics (AREA)
- Tests Of Electronic Circuits (AREA)
- Debugging And Monitoring (AREA)
- Testing Of Individual Semiconductor Devices (AREA)
- Test And Diagnosis Of Digital Computers (AREA)
Abstract
Description
Claims (10)
- An electronic test system (100) including: a memory (101) for storing a test and test results; an electronic processor (102) communicating with said memory for controlling the execution of a test and displaying the test results; and a graphical user interface output device (106) communicating with said electronic processor for displaying information, said information comprising test results organized into a tree structure (309) comprising a hierarchical configuration having multiple levels including a highest level (402) and one or more sub-levels (404,408,416), with the results of each sub-level summarized to the next higher level.
- An electronic test system as in claim 1, wherein each level in said tree structure includes a graphical element (402,404,408,416) representing the status of the result at each said level.
- An electronic test system as in claim 2, wherein said status is one of the following states: pass (416), fail (408), marginal (426), and not-yet-tested (412).
- An electronic test system as in claim 2 or 3, wherein said graphical element includes a code selected from the group consisting of symbols, alphanumeric characters, design and colors.
- An electronic test system as in any preceding claim, wherein said result at each of said levels is determined by applying a summary of each said sub-level of said level.
- An electronic test system as in any preceding claim, whereon said levels include a test procedure level (402), a test level (404) which is a sub-level of said test procedure level, and a measurement sub-level (408) equivalent to a second generation branch in said tree structure, and wherein said test procedure level is said highest level, equivalent to a trunk in said tree structure, said test sub-level is equivalent to a first generation branch in said tree structure, and said measurement sub-level is equivalent to a second generation branch in said tree structure.
- An electronic test system as in any preceding claim, wherein said tree structure is expandable to display said one or more sub-levels.
- A method of displaying the results of an electronic test including the steps of: performing a test procedure to determine a plurality of test results and displaying said test results in a tree structure (309) including a hierarchical configuration having multiple levels includes a highest level (402) and one or more sub-levels, (404,408,416); and summarizing said results in each said sub-level to the next higher level in said tree structure.
- A method as in claim 8, including the step of displaying a test string in each level, said test string defining the function of each level.
- A method as in claim 8 or 9, wherein said step of summarizing corresponds to summarizing the least optimum results at said sub-levels to said higher level.
Applications Claiming Priority (2)
| Application Number | Priority Date | Filing Date | Title |
|---|---|---|---|
| US600 | 2001-10-23 | ||
| US10/000,600 US7055138B2 (en) | 2001-10-23 | 2001-10-23 | Test executive system with tree structure for summarizing results |
Publications (2)
| Publication Number | Publication Date |
|---|---|
| EP1306742A2 true EP1306742A2 (en) | 2003-05-02 |
| EP1306742A3 EP1306742A3 (en) | 2004-01-07 |
Family
ID=21692204
Family Applications (1)
| Application Number | Title | Priority Date | Filing Date |
|---|---|---|---|
| EP02257025A Withdrawn EP1306742A3 (en) | 2001-10-23 | 2002-10-10 | A graphical interface |
Country Status (4)
| Country | Link |
|---|---|
| US (1) | US7055138B2 (en) |
| EP (1) | EP1306742A3 (en) |
| JP (1) | JP2003337718A (en) |
| KR (1) | KR20030033972A (en) |
Cited By (1)
| Publication number | Priority date | Publication date | Assignee | Title |
|---|---|---|---|---|
| EP1313001A3 (en) * | 2001-11-14 | 2004-01-07 | Agilent Technologies, Inc. | Electronic test system |
Families Citing this family (25)
| Publication number | Priority date | Publication date | Assignee | Title |
|---|---|---|---|---|
| US7512555B2 (en) * | 2001-11-13 | 2009-03-31 | Gregory M Finn | Investment management tool |
| US6839650B2 (en) * | 2001-11-19 | 2005-01-04 | Agilent Technologies, Inc. | Electronic test system and method |
| GB0311808D0 (en) * | 2003-05-22 | 2003-06-25 | Tektronix Inc | User interface for an event monitor |
| US8671394B1 (en) * | 2003-11-26 | 2014-03-11 | The Mathworks, Inc. | Monitoring test steps in test environments |
| JP2005300324A (en) * | 2004-04-09 | 2005-10-27 | Agilent Technol Inc | Measurement data analysis method, program, and measurement data analysis system for device under test |
| US20060036799A1 (en) * | 2004-08-13 | 2006-02-16 | National Instruments Corporation | Multi-platform development and execution of graphical programs |
| US7624379B2 (en) * | 2005-01-12 | 2009-11-24 | Advanced Testing Technologies, Inc. | Test program set obsolescence mitigation through software and automatic test equipment system processes |
| US8484618B2 (en) * | 2005-01-12 | 2013-07-09 | Advanced Testing Technologies, Inc. | Test program set obsolescence mitigation through software and automatic test equipment processes |
| JP2006234621A (en) * | 2005-02-25 | 2006-09-07 | Agilent Technol Inc | Semiconductor measurement system and control method thereof |
| US7451358B2 (en) * | 2005-04-07 | 2008-11-11 | National Instruments Corporation | Test executive system with automatic expression logging and parameter logging |
| US7506211B2 (en) * | 2005-09-13 | 2009-03-17 | International Business Machines Corporation | Automated atomic system testing |
| CN100353327C (en) * | 2005-11-07 | 2007-12-05 | 华为技术有限公司 | Method for realizing product automatic test by test environment composed of test set |
| CN100377109C (en) * | 2005-11-07 | 2008-03-26 | 华为技术有限公司 | A method for completing product automation testing by using a test suite |
| US20070192346A1 (en) * | 2006-01-31 | 2007-08-16 | Carli Connally | Apparatus for storing variable values to provide context for test results that are to be formatted |
| US20070180339A1 (en) * | 2006-01-31 | 2007-08-02 | Carli Connally | Handling mixed-mode content in a stream of test results |
| KR100789546B1 (en) * | 2006-02-20 | 2007-12-28 | 엘지전자 주식회사 | How to Display Host Diagnostic Information in Digital Broadcast Receiver |
| US7496815B2 (en) * | 2006-03-06 | 2009-02-24 | Sapphire Infotech, Inc. | Method and apparatus for automatic generation of system test libraries |
| US7478305B2 (en) * | 2006-03-27 | 2009-01-13 | Sapphire Infotech, Inc. | Method and apparatus for interactive generation of device response templates and analysis |
| US7631227B2 (en) * | 2006-11-21 | 2009-12-08 | Etaliq Inc. | Automated testing and control of networked devices |
| US20080282192A1 (en) * | 2007-05-07 | 2008-11-13 | Kristin Petersen | Method and apparatus for selecting and displaying a number of test data items |
| US20090169008A1 (en) * | 2007-12-26 | 2009-07-02 | Gonzales Jesus Orlando Ii | System and method for tracking testing of software modification projects from a wireless mobile device |
| US8359580B2 (en) | 2007-12-26 | 2013-01-22 | Visa U.S.A. Inc. | System and method for tracking testing of software modification projects |
| JP5456600B2 (en) * | 2010-06-29 | 2014-04-02 | エスペック株式会社 | Environmental test equipment |
| CN102810122A (en) * | 2011-06-02 | 2012-12-05 | 鸿富锦精密工业(深圳)有限公司 | Verification system and method for electronic product design |
| US12436855B2 (en) | 2022-09-21 | 2025-10-07 | Advantest Corporation | Systems and methods utilizing DAX memory management for testing CXL protocol enabled devices |
Family Cites Families (10)
| Publication number | Priority date | Publication date | Assignee | Title |
|---|---|---|---|---|
| JPH04195598A (en) * | 1990-11-28 | 1992-07-15 | Toshiba Corp | Alarm display device |
| US5390131A (en) | 1992-04-06 | 1995-02-14 | Hewlett-Packard Company | Apparatus and method for displaying wafer test results in real time |
| US5428624A (en) * | 1993-10-12 | 1995-06-27 | Storage Technology Corporation | Fault injection using boundary scan |
| US6067639A (en) * | 1995-11-09 | 2000-05-23 | Microsoft Corporation | Method for integrating automated software testing with software development |
| US6154128A (en) * | 1997-05-21 | 2000-11-28 | Sun Microsystems, Inc. | Automatic building and distribution of alerts in a remote monitoring system |
| US6128759A (en) | 1998-03-20 | 2000-10-03 | Teradyne, Inc. | Flexible test environment for automatic test equipment |
| JP2000285153A (en) * | 1999-03-31 | 2000-10-13 | Hitachi Ltd | Effort estimation system |
| WO2001022228A1 (en) * | 1999-09-17 | 2001-03-29 | Nortel Networks Limited | System and method for producing a verification system for verifying procedure interfaces |
| JP3637257B2 (en) * | 2000-03-23 | 2005-04-13 | 松下電器産業株式会社 | Surveillance control device for monitoring a micro earth station in a satellite communication system and a recording medium recording a surveillance control program |
| US6823272B2 (en) * | 2001-10-23 | 2004-11-23 | Agilent Technologies, Inc. | Test executive system with progress window |
-
2001
- 2001-10-23 US US10/000,600 patent/US7055138B2/en not_active Expired - Fee Related
-
2002
- 2002-10-10 EP EP02257025A patent/EP1306742A3/en not_active Withdrawn
- 2002-10-21 JP JP2002305334A patent/JP2003337718A/en active Pending
- 2002-10-22 KR KR1020020064582A patent/KR20030033972A/en not_active Ceased
Cited By (1)
| Publication number | Priority date | Publication date | Assignee | Title |
|---|---|---|---|---|
| EP1313001A3 (en) * | 2001-11-14 | 2004-01-07 | Agilent Technologies, Inc. | Electronic test system |
Also Published As
| Publication number | Publication date |
|---|---|
| KR20030033972A (en) | 2003-05-01 |
| US7055138B2 (en) | 2006-05-30 |
| JP2003337718A (en) | 2003-11-28 |
| US20030078679A1 (en) | 2003-04-24 |
| EP1306742A3 (en) | 2004-01-07 |
Similar Documents
| Publication | Publication Date | Title |
|---|---|---|
| US7055138B2 (en) | Test executive system with tree structure for summarizing results | |
| US6745140B2 (en) | Electronic test system with test results view filter | |
| US6823272B2 (en) | Test executive system with progress window | |
| KR20030084668A (en) | Electronic test program that can distinguish results | |
| EP0242131B1 (en) | Graphical system for modelling a process and associated method | |
| US8539443B2 (en) | Edit time analyzer in a loosely typed textual language | |
| KR20030087977A (en) | Method and apparatus for generating electronic test and data structure | |
| EP0869433A2 (en) | A test development system and method for software with a graphical user interface | |
| US6839650B2 (en) | Electronic test system and method | |
| EP1772806A2 (en) | Method for computer-assisted testing of software application components | |
| US20050209808A1 (en) | Circuit board diagnostic operating center | |
| EP1357389A2 (en) | Electronic test program with run selection | |
| KR20030087933A (en) | Externally controllable electronic test program | |
| US20030065705A1 (en) | Task roster | |
| JPH0335321A (en) | Programming method by example | |
| US20150339127A1 (en) | Configuration Change Tracking for Measurement Devices | |
| EP1348969A2 (en) | Electronic test system | |
| US20150301085A1 (en) | Automatically Capturing Data Sets of Interest from a Data Acquisition Data Stream | |
| EP1313001A2 (en) | Electronic test system | |
| US5381344A (en) | Apparatus and method for obtaining a list of numbers of wafers for integrated circuit testing | |
| US20030093718A1 (en) | Electronic test program with selectable specifications | |
| Klinger | Reusable test executive and test programs methodology and implementation comparison between HP VEE and LabView | |
| US20050188325A1 (en) | Highlighting panning window interface | |
| Angus et al. | VEE Pro: Practical Graphical Programming | |
| EP4270258A1 (en) | Rule updating program, rule updating method, and rule updating device |
Legal Events
| Date | Code | Title | Description |
|---|---|---|---|
| PUAI | Public reference made under article 153(3) epc to a published international application that has entered the european phase |
Free format text: ORIGINAL CODE: 0009012 |
|
| AK | Designated contracting states |
Designated state(s): AT BE BG CH CY CZ DE DK EE ES FI FR GB GR IE IT LI LU MC NL PT SE SK TR |
|
| AX | Request for extension of the european patent |
Extension state: AL LT LV MK RO SI |
|
| PUAL | Search report despatched |
Free format text: ORIGINAL CODE: 0009013 |
|
| AK | Designated contracting states |
Kind code of ref document: A3 Designated state(s): AT BE BG CH CY CZ DE DK EE ES FI FR GB GR IE IT LI LU MC NL PT SE SK TR |
|
| AX | Request for extension of the european patent |
Extension state: AL LT LV MK RO SI |
|
| RIC1 | Information provided on ipc code assigned before grant |
Ipc: 7G 06F 3/00 B Ipc: 7G 01R 31/319 A |
|
| 17P | Request for examination filed |
Effective date: 20040621 |
|
| AKX | Designation fees paid |
Designated state(s): DE FR GB |
|
| RAP1 | Party data changed (applicant data changed or rights of an application transferred) |
Owner name: AGILENT TECHNOLOGIES, INC. |
|
| STAA | Information on the status of an ep patent application or granted ep patent |
Free format text: STATUS: THE APPLICATION IS DEEMED TO BE WITHDRAWN |
|
| 18D | Application deemed to be withdrawn |
Effective date: 20090505 |