EP1306683A2 - Test system with progress window - Google Patents
Test system with progress window Download PDFInfo
- Publication number
- EP1306683A2 EP1306683A2 EP02256368A EP02256368A EP1306683A2 EP 1306683 A2 EP1306683 A2 EP 1306683A2 EP 02256368 A EP02256368 A EP 02256368A EP 02256368 A EP02256368 A EP 02256368A EP 1306683 A2 EP1306683 A2 EP 1306683A2
- Authority
- EP
- European Patent Office
- Prior art keywords
- test
- progress
- graphical
- specification limit
- datapoint
- Prior art date
- Legal status (The legal status is an assumption and is not a legal conclusion. Google has not performed a legal analysis and makes no representation as to the accuracy of the status listed.)
- Withdrawn
Links
Images


Classifications
-
- G—PHYSICS
- G06—COMPUTING OR CALCULATING; COUNTING
- G06F—ELECTRIC DIGITAL DATA PROCESSING
- G06F11/00—Error detection; Error correction; Monitoring
- G06F11/22—Detection or location of defective computer hardware by testing during standby operation or during idle time, e.g. start-up testing
-
- G—PHYSICS
- G01—MEASURING; TESTING
- G01R—MEASURING ELECTRIC VARIABLES; MEASURING MAGNETIC VARIABLES
- G01R31/00—Arrangements for testing electric properties; Arrangements for locating electric faults; Arrangements for electrical testing characterised by what is being tested not provided for elsewhere
- G01R31/28—Testing of electronic circuits, e.g. by signal tracer
- G01R31/317—Testing of digital circuits
- G01R31/3181—Functional testing
- G01R31/319—Tester hardware, i.e. output processing circuits
- G01R31/31903—Tester hardware, i.e. output processing circuits tester configuration
- G01R31/31912—Tester/user interface
Definitions
- the present invention relates to a test system, such as an electronic system for performing automated tests of complex electronic, electromechanical and mechanical equipment and products; and an electronic test system with a progress window that enables the user to see in a glance the progress and results of an entire test.
- Test executive programs which are capable of controlling a variety of automated tests, referred to in the art as "test executive" programs, have been developed.
- Test executive programs in the prior art include internal test executive programs developed by Agilent Technologies and TESTSTAND software developed by National Instruments Corporation, which is described as a ready-to-run test executive for organizing, controlling, and executing automated prototype, validation, or production test systems.
- the prior art Agilent Technologies programs did not use a graphical user interface (GUI), therefore limiting the ability of the program to display large amounts of data in a simple fashion.
- GUI graphical user interface
- the TESTSTAND software while using a GUI, requires the user to scroll through multiple windows to determine the overall progress of a test.
- Tests usually are defined by a set of rules or specifications to which the DUT is compared.
- the rules or specifications generally comprise various inputs defined by electrical and mechanical parameters applied to the DUT, such as voltage, current, specified manipulations of controls and device parts, as well as environmental parameters under which the test is conducted, such as temperature, humidity, pressure, and the time period over which a parameter is applied.
- Each test will include many combinations of the parameters applied to each element of the DUT, and often will be repeated many time.
- Each combination of parameters will define a measurement that results in one or more datapoints, which are recorded and compared to numerical or Boolean limits defining the specifications.
- electronic test programs have become very long and complex, often requiring several days, or even a week or more to run a complete test.
- test results are displayed as text on a computer display screen as the test progresses, with the current test conditions and results, or a small portion of the conditions and results just prior to the current time, visible. If the user desired to see results from earlier portions of the test, the user scrolls through a display to extract information on the status of the test. Because of the length and complexity of the test, it is not physically possible to display the entire report of a test on the screen at one time. At any given point in the scrolling, the user had only a partial view of the results, making it difficult for the user to draw conclusions on the overall progress of the test without time consuming and tedious recording and summarizing.
- the present invention seeks to provide improved testing.
- the preferred embodiment can provide a test executive system in which at any given point in a lengthy test, the overall progress and status of the test can be quickly determined.
- the preferred embodiment allows the user to see the progress of the entire procedure on a small graphical display called a progress window.
- the progress window enables the user to evaluate an entire test in a single glance while the test is still running. This allows the user to save time by immediately seeing if the number of failed or false results is unacceptable. The user does not have to search through the whole listing of results to determine if the test is running properly. Tests that are not progressing properly according to a set of rules, or specifications, predetermined by the user are quickly identified.
- the electronic test output is preferably displayed through an easy to use graphical user interface (GUI). It is preferably divided into windows containing either icons for controlling the test procedure or windows for displaying the results as text, tables, graphical points or graphical colored bars, and other GUI elements.
- GUI graphical user interface
- the user can control the test procedure by accessing the programs represented by the icons and windows with a pointing device such as a mouse, a keyboard, a trackball, a touch pad, a roller ball and a joystick.
- the portion of the display containing the progress window is preferably a small portion of the graphical user interface (GUI) where the results are displayed as single graphical elements such as graphical points, graphical bars, graphical sectors or single alphanumeric characters.
- GUI graphical user interface
- the graphical elements are preferably grouped in a manner to display the progress of the test.
- the graphical elements are grouped on this window along a first axis, and the distance of these graphical elements extends along the first axis representing the total length of the whole test procedure.
- each graphical element is color coded to facilitate rapid distinguishing of the test progress.
- the color coding indicates that the corresponding result is a "pass”, i.e., within specification, a "fail”, i.e., outside specification, or "marginal”, i.e., just barely within specification.
- each graphical element is a bar extending in a direction perpendicular to the first axis.
- each bar is color coded to indicate if the corresponding result is a "pass", i.e., within specification, a "fail”, i.e., outside specification, or "marginal”, i.e., just barely within specification.
- Monitoring the progress window allows the user to check the time left to accomplish the test procedure but, more importantly, it allows the user to check the status of the test; that is, how many of the results are pass, fail or marginal.
- the pass/fail criterion is determined by comparing the results to a specification.
- the specification is displayed on the progress window by at least one specification limit.
- each specification limit is a line.
- the upper specification limit is a line above and parallel to the first axis.
- the lower specification limit is a line below and parallel to the second axis.
- the length of each bar is normalized so it is proportional to the ratio of the numerical value of the datapoint and the numerical value of the corresponding specification.
- a mathematical criterion is applied to determine if the result is within the specification limits, outside the specification limits, or barely inside the specification limits, which criterion determines if the test is pass, fail or marginal.
- a color is assigned to the vertical graphical bar, representing the value of the datapoint, depending on its pass, fail or marginal status. This color code is a visual tool helping the user to determine instantly how the test is progressing.
- the lines representing the upper and lower specification limits are placed at a unit (1) distance above and below the first axis, respectively.
- the data point is within specification, its length is such that it is within the area defined by the specification limit lines, and if the data point is outside specification, its length extends beyond the corresponding specification limit line, and if the datapoint is marginal, its length is equal to or close to the corresponding specification limit line.
- the preferred embodiment not only provides an electronic test program that displays the overall output in a form that can be observed in a glance, but also displays the output in a form which permits the user to quickly check individual results.
- the test system preferably comprises a computer 100.
- Computer system 100 includes a memory 101, a microprocessor 102, an input device 104, and an output device 106.
- Memory 101 communicates with microprocessor 102 via electrical line 110.
- Input device 104 communicates with microprocessor 102 through electrical line 112.
- Microprocessor 102 outputs the data through output device 106 via electrical line 114.
- the test system can take the form of software stored in memory 101 and run or executed by processor 102.
- the user interacts with the test system through input device 104 such as, but not limited to, a keyboard, a mouse, a track ball, a touch pad, and a joystick.
- the input device 104 allows moving a cursor or a pointer on the output device 106 (a display system such as a Cathode Ray Tube monitor or a Liquid Crystal Display).
- the results of the test are displayed on the output device 106.
- the test is controlled by processor 102, which communicates the instructions of the test program to the product under test or device under test (DUT) 108 via electrical line 116.
- Processor 102 controls the test equipment 117 via electrical line 118.
- the test results are processed by processor 102 and stored in memory 101 to be visualized by display 106.
- the display information contains both information as to the configuration and position of the cursor and other visual information of interest to the user such as the results of the test and how the
- test system may be implemented in a variety of actual electronic devices that follow the general form outlined on FIG 1.
- the test system may be embodied in a computer system or it may also be embodied in other hardware as a logic circuit, embodied as an electronic testing device such as, but not limited to, an electronic analyzer.
- FIG. 2 there is shown a block diagram 200 illustrating the hierarchical, i.e., multi-level, characteristic of the test program.
- the first level 201 corresponds to the product model, a file the test developer creates to test a family of specific device model numbers. It contains test procedures and inputs.
- the next level 202 corresponds to the procedure itself.
- a procedure is an ordered list, sequence, or script of tests to be run.
- Several procedures may exist, which is represented in FIG. 2 by a deck of cards 202, each representing a different procedure.
- Each procedure includes a plurality of tests, i.e., test 1, test 2, test 3... test N, as shown at 203.
- Each test includes a plurality of measurements. This is illustrated in FIG. 2 for test 2 shown at 205.
- test 205 includes measurements 207, i.e., measurement 1, measurement 2... measurement N.
- Each measurement includes one or more datapoints, represented as a deck of cards 210, 211, 212, associated with each measurement.
- a procedure is defined by writing a program or a code to build a structure of software objects.
- the software objects are Component Object Model (COM) objects.
- COM is a language independent component architecture, not a programming language. It is meant to be a general purpose, object-oriented means to encapsulate commonly used functions and services. See Newton's Telecom Dictionary by Harry Newton, Publishers Group West, page 197.
- a test 205 is a group of measurements 207 in a procedure 202 that share the same test algorithm or the same test software code. Some examples of tests include amplitude accuracy test, test of harmonic distortion, etc.
- the test program repeatedly calls a test for each measurement and datapoint.
- a measurement such as measurement 206, is a configuration or a set up for a test.
- Each measurement, in measurements 207, within a test 205 can have different setups or configuration parameters.
- Tests are parameter driven and the parameters are inputs at the measurement level. Measurements are elements such as range in volts, frequency in kilohertz or harmonic (an integer number).
- the test procedure 202 views the measurements 207 as data to be passed from the procedure to a test.
- a measurement is also a phase of test execution. During the measurement phase of test execution, the measurement is started but data is not collected. This allows for multiple devices under test (DUTs) to be configured and triggered together.
- DUTs devices under test
- a datapoint such as 210, 211, 212 is a subset of a measurement, such as 206, containing additional parameters that select a result when one measurement generates multiple results.
- Some examples of multiple datapoints for a measurement are the minimum and maximum of a spectrum analyzer sweep or each channel of a device.
- a value result is extracted.
- the results obtained are compared to specifications.
- Specifications are numerical limits, string match, or Boolean pass/fail. There are three sets of limits: marginal limits, line limits and customer limits. Each limit has an upper and a lower value.
- FIG. 1 All the inputs and outputs of the electronic test system (FIG. 1) are handled preferably through a graphical user interface (GUI).
- GUI graphical user interface
- FIG. 3 shows the graphical user interface 300 as displayed on the output device 106.
- the tape recorder buttons 301 on the top left are used to control the test. From left to right: abort 302, restart test 303, restart measurement 304, pause 305, run 306, skip measurement 307, skip test 308.
- the bottom of the screen 309 shows a window describing the hierarchy of tests, measurements, and datapoints. Icons, such as 313, indicate pass, fail, marginal and not yet tested. A "smiling" 310, “surprised” 311, and “sad” 312 icon correspond respectively to pass, marginal and fail. The pass/fail icon 313 on top of the window is for the entire procedure. It summarizes the status of all the tests with the fail having priority. That is, if there is one fail test the whole procedure is fail. An algorithm that promotes the least optimal result is used to compute the final status of the procedure.
- a window 314 shows a series of rows 315 and columns 316 of alphanumeric test information.
- Window 314 displays the time the test is run, such as at 317, as well as the status of the test, such as at 318.
- the test can be sorted by clicking on the icon view 325 on top of the window 314. This function allows the test results to be filtered and displayed depending on their status.
- the bottom right window 330 represents the preferred embodiment of progress window.
- FIG. 4 shows an enlarged view of this window.
- axis 400 represents the length of the entire procedure.
- Datapoints corresponding to the test results are preferably plotted as datapoint units 410 along a progress axis 400.
- Each datapoint unit 410 preferably is a single graphical element, such as 402, 403, 404, etc.
- each graphical element comprises a bar.
- the length of each bar in the direction perpendicular to the progress axis 400 is normalized to "1". That is, the vertical length of the bar is proportional to the ratio of results numerical value to specification numerical value.
- the progress window 330 also preferably includes specification limit elements 401A and 401B.
- the specification limit elements 401A and 401B comprise dotted horizontal lines 401A and 401B, with 401A indicating the upper limit and 401B indicating the lower limit. That is, the line 401A above the axis 400 corresponds to the upper specification limit and the line 401B below the axis 400 corresponds to the lower specification limit. Since the length of the bars are normalized, the specification lines 401A and 401B are preferably placed at a unit (1) distance above and below axis 400. Thus, if the bar representing the result is within specification, that is, its length is such that it is within the area defined by the specification limit lines, such as 404, the result is pass.
- the result is fail. If the bar representing the result is barely inside the specification limits, that is, its length is equal to or close to the corresponding specification limit line, such as 403, the result is marginal.
- each graphical element is also color coded to indicate the pass 404, fail 409 or marginal 403 status.
- the color red is chosen for fail, the color green for pass and the color yellow for marginal.
- the graphical elements are colored bars 402, 403, etc.
- each datapoint results in a colored vertical bar, such as 402, 403, etc.
- the graphical elements 410 are lined for color. As shown at 440, a hatched lining indicates a yellow color; as shown at 441, a diagonal lining indicates a green color; and, as shown at 442, a vertical lining indicates a red color.
- the bars are preferably color coded to indicate the status of the test measurements, the color code is not essential since the user can distinguish the status of each measurement by looking at the length of each bar relative to the specification lines. However, adding a color to the bar facilitates the determination of the status of each test result.
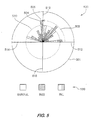
- the progress window 500 is comprised of graphical elements, such as 504.
- the graphical elements are grouped in a circle 501 using radial coordinates.
- the radius, such as 505, for each element, such as 504, corresponds to the numerical value of the result, and the angle, such as 503, conveys the time at which the result was measured.
- Each datapoint results in a sector, such as 504, wherein the radius of that sector is proportional to the ratio of results numerical value to specification numerical value.
- the specification limit 520 is preferably plotted as a dotted circle inside circle 501 defining the progress window.
- the sectors, corresponding to the datapoints or results, are preferably color coded or design coded to show the pass, fail and marginal status of each result.
- the graphical elements, such as 505 are lined for color and a reference chart 530 is provided in the figure to explain the lining.
- the color or the design feature is only intended as a visual tool to help the user distinguish the status of each test result since the user can determine the status of each result by observing if the sector is inside, barely inside or outside specification circle 520.
- each sector, corresponding to the value result is preferably assigned a color or a design according to the length of its radius by applying a mathematical criterion.
- the sector is assigned a design or color so as to display that the result is "fail”. If the radius of the sector corresponding to the datapoint is less than the radius of the circle corresponding to the specification, the sector is assigned a design or color so as to display that the result is "pass”. If the radius of the sector corresponding to the datapoint is equal or very close to the radius of the circle corresponding to the specification, the sector is assigned a design or color so as to display that the result is "marginal".
- the progress window 500 not only allows the user to distinguish between possible outcomes of test results; it also permits the user to check the time left to accomplish the test procedure by observing how much of the area inside the circle 501 is covered by the sectors corresponding to the results.
- the window 500 also includes a start line 512 and progress lines 513, 514, and 515 which divide the window into quadrants to assist in quickly showing how much of the test is completed.
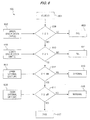
- the inputs used to determine the status include the value (V) 601 for the result, the upper specification limit (U) 602, the lower specification limit (L) 603, the upper marginal limit (UM) 604, and the lower marginal limit (LM) 605.
- the value (V), which is determined by the test measurement, and the limits U, L, UM, and LM, which are entered by the user, are stored in memory 101 (FIG. 1).
- the test system 100 determines if V is less than or equal to U. If it is not, then the system assigns a fail status to the result at step 609.
- step 610 determines if V is greater than or equal to L. If it is not, the system assigns a fail status to the result at step 611. If it is, the system proceeds to step 612, where it determines if V is less than or equal to UM. If it is not, the system assigns a marginal status to the result in step 613. If it is, the system proceeds to step 614, where the system determines if V is greater than or equal to LM. If it is not, in step 615, the system assigns a marginal status to the result. If it is, the system proceeds to step 617 and assigns a pass status to the result.
- the ability for the user to distinguish easily in one glance at the progress bar if the test is pass, fail or marginal is a feature of the invention. All the information on the test results is available on one window. The user may take immediate action as to whether to let the test progress or terminate the test and modify some of the parameters.
Landscapes
- Engineering & Computer Science (AREA)
- General Engineering & Computer Science (AREA)
- Physics & Mathematics (AREA)
- General Physics & Mathematics (AREA)
- Human Computer Interaction (AREA)
- Theoretical Computer Science (AREA)
- Quality & Reliability (AREA)
- Computer Hardware Design (AREA)
- Tests Of Electronic Circuits (AREA)
- Testing Electric Properties And Detecting Electric Faults (AREA)
- Testing Or Measuring Of Semiconductors Or The Like (AREA)
- User Interface Of Digital Computer (AREA)
- Debugging And Monitoring (AREA)
Abstract
Description
Claims (10)
- An electronic test system (100) including a memory (101) for storing a test procedure including a plurality of measurements (207); and a plurality of datapoints (210) corresponding to test results for said plurality of measurements; and an electronic processor (102) communicating with said memory for controlling the execution of said procedure and displaying said test data; said electronic test system providing a graphical user interface output device (106) communicating with said electronic processor for displaying information, said information including a plurality of datapoint units (210), each datapoint unit (210) including a single graphical element (403,404) having at least two dimensions and conveying the results of said test for a corresponding datapoint (210), said datapoint units (210) grouped in a manner to display the progress of said test procedure.
- An electronic test system as in claim 1, wherein said graphical elements are grouped along a progress axis (400), with the distance said elements extend along said progress axis (400) representing the length of said test procedure.
- An electronic test system (100) as in claim 2, wherein said memory stores upper (602) and lower (603) specification limits for each of said measurements and said information includes a first specification limit element (401A) representing said upper specification limit (602) and a second specification limit element (401B) representing said lower specification limit (602).
- An electronic test system (100) as in claim 3, wherein said graphical elements (403,404) are grouped along a progress axis (400), said upper specification limit (602) is a line (401A) positioned above and parallel to said progress axis (400), and said lower specification limit (603) is a line (401B)positioned below and parallel to said progress axis (400).
- An electronic test system (100) as in any preceding claim, wherein said graphical elements (403,404) are color coded, said color code indicating a status selected from the group comprising pass, fail and marginal.
- A method of displaying the results of an electronic test including the step of performing a test procedure comprising a plurality of test measurements (207) to determine a plurality of datapoints (210), each said datapoint (210) corresponding to the result of one of said test measurements (207); said method including steps of:displaying a plurality of graphical units (403,404), each of said graphical units (403,404) representing one of said datapoints (210), each of said graphical units (403,404) comprising a single graphical element (403,404) having at least two dimensions; andgrouping said graphical elements (403,404) in a manner to display the progress of said test procedure.
- A method as in claim 6, including the steps of storing a numerical value and a specification limit value (602,603) for each of said datapoints (210), and displaying said specification limit value (602,603).
- A method as in claim 7, including the steps of plotting said graphical elements (403,404) along a progress axis (400) representing the length of said test procedure, plotting an upper specification limit (602) as a line (401A) above and parallel to said progress axis (400), and plotting said lower specification limit (603) as a line (401B) below and parallel to said progress axis (400).
- A method as in claim 6, 7 or 8, including the step of normalizing each of said graphical elements (403,404).
- A method as in anyone of claims 6 to 9, wherein said step of displaying comprises displaying said graphical element (403,404) in color so as to convey the pass, fail and marginal status of said datapoint (210).
Applications Claiming Priority (2)
| Application Number | Priority Date | Filing Date | Title |
|---|---|---|---|
| US603 | 2001-10-23 | ||
| US10/000,603 US6823272B2 (en) | 2001-10-23 | 2001-10-23 | Test executive system with progress window |
Publications (2)
| Publication Number | Publication Date |
|---|---|
| EP1306683A2 true EP1306683A2 (en) | 2003-05-02 |
| EP1306683A3 EP1306683A3 (en) | 2004-01-07 |
Family
ID=21692217
Family Applications (1)
| Application Number | Title | Priority Date | Filing Date |
|---|---|---|---|
| EP02256368A Withdrawn EP1306683A3 (en) | 2001-10-23 | 2002-09-13 | Test system with progress window |
Country Status (5)
| Country | Link |
|---|---|
| US (1) | US6823272B2 (en) |
| EP (1) | EP1306683A3 (en) |
| JP (1) | JP2003202363A (en) |
| KR (1) | KR20030033969A (en) |
| TW (1) | TW559664B (en) |
Families Citing this family (19)
| Publication number | Priority date | Publication date | Assignee | Title |
|---|---|---|---|---|
| CN100437832C (en) * | 2000-11-28 | 2008-11-26 | 株式会社艾德温特斯特 | Fault analysis device |
| US7055138B2 (en) * | 2001-10-23 | 2006-05-30 | Agilent Technologies, Inc. | Test executive system with tree structure for summarizing results |
| KR20030087329A (en) * | 2002-05-08 | 2003-11-14 | 삼성전기주식회사 | Display method in detection system of magnetic permeability for coil |
| US7266781B1 (en) * | 2003-04-25 | 2007-09-04 | Veritas Operating Corporation | Method and apparatus for generating a graphical display report |
| US7480869B2 (en) * | 2003-10-31 | 2009-01-20 | International Business Machines Corporation | Method and apparatus for displaying status of hierarchical operations |
| US7793229B1 (en) * | 2003-12-19 | 2010-09-07 | Unisys Corporation | Recording relevant information in a GUI window of a panel dump browser tool |
| US7096142B2 (en) * | 2004-04-02 | 2006-08-22 | Agilent Technologies, Inc. | Report format editor for circuit test |
| MXPA06013286A (en) * | 2004-05-21 | 2007-07-19 | Pressco Tech Inc | Graphical re-inspection user setup interface. |
| TW200723081A (en) * | 2005-12-13 | 2007-06-16 | Universal Scient Ind Co Ltd | Circular multimedia playback progress indicator and method of indicating signals thereof |
| US20070168861A1 (en) * | 2006-01-17 | 2007-07-19 | Bell Denise A | Method for indicating completion status of user initiated and system created tasks |
| US20070192346A1 (en) * | 2006-01-31 | 2007-08-16 | Carli Connally | Apparatus for storing variable values to provide context for test results that are to be formatted |
| US20080270849A1 (en) * | 2007-04-26 | 2008-10-30 | Carli Connally | Method and Apparatus for Displaying Test Data |
| US20080270923A1 (en) * | 2007-04-26 | 2008-10-30 | Carli Connally | Method and Apparatus for Displaying Test Data |
| WO2009042238A1 (en) * | 2007-09-26 | 2009-04-02 | Precision Planting, Inc. | System and method for determining proper downforce for a planter row unit |
| US8176797B2 (en) * | 2009-09-04 | 2012-05-15 | Cnh Canada, Ltd. | System and method for measuring flow rate from a meter roller |
| US9141507B2 (en) * | 2009-12-23 | 2015-09-22 | Microsoft Technology Licensing, Llc | Visualization of states of a process |
| JP5456600B2 (en) * | 2010-06-29 | 2014-04-02 | エスペック株式会社 | Environmental test equipment |
| EP3725141B1 (en) | 2012-07-25 | 2022-09-07 | Precision Planting LLC | Agricultural implement with downforce controller |
| JP6959879B2 (en) * | 2018-02-08 | 2021-11-05 | 株式会社Screenホールディングス | Data processing method, data processing device, and data processing program |
Family Cites Families (28)
| Publication number | Priority date | Publication date | Assignee | Title |
|---|---|---|---|---|
| JP2941308B2 (en) * | 1989-07-12 | 1999-08-25 | 株式会社日立製作所 | Inspection system and electronic device manufacturing method |
| US5390131A (en) * | 1992-04-06 | 1995-02-14 | Hewlett-Packard Company | Apparatus and method for displaying wafer test results in real time |
| AU6247094A (en) * | 1993-03-11 | 1994-09-26 | Fibercraft/Descon Engineering, Inc. | Design and engineering project management system |
| US5631825A (en) * | 1993-09-29 | 1997-05-20 | Dow Benelux N.V. | Operator station for manufacturing process control system |
| US5991699A (en) * | 1995-05-04 | 1999-11-23 | Kla Instruments Corporation | Detecting groups of defects in semiconductor feature space |
| US5726920A (en) * | 1995-09-29 | 1998-03-10 | Advanced Micro Devices, Inc. | Watchdog system having data differentiating means for use in monitoring of semiconductor wafer testing line |
| US5761064A (en) * | 1995-10-06 | 1998-06-02 | Advanced Micro Devices, Inc. | Defect management system for productivity and yield improvement |
| KR100192216B1 (en) * | 1996-02-29 | 1999-06-15 | 황인길 | Wafer Map Conversion Method |
| US5808920A (en) * | 1996-03-19 | 1998-09-15 | Digital Lightwave, Inc. | Communications line test apparatus with an improved graphical user interface |
| US6138252A (en) * | 1996-07-01 | 2000-10-24 | Sun Microsystems, Inc. | Graphical test progress monitor |
| US6222547B1 (en) * | 1997-02-07 | 2001-04-24 | California Institute Of Technology | Monitoring and analysis of data in cyberspace |
| DE19713932A1 (en) * | 1997-04-04 | 1998-10-08 | Omicron Electronics Gmbh | Test system and test procedure |
| US6038588A (en) * | 1997-06-30 | 2000-03-14 | Sun Microsystems, Inc. | Method and apparatus for creating and executing a progress dialog window |
| US6033316A (en) * | 1997-08-07 | 2000-03-07 | Nixon; Rodger | Golf course progress monitor to alleviate slow play |
| US6091997A (en) * | 1997-09-23 | 2000-07-18 | Case Corporation | Enhanced statistical/status display |
| US6446021B1 (en) * | 1998-02-27 | 2002-09-03 | Micron Technology, Inc. | Method and apparatus to display processing parameter |
| CA2236063C (en) * | 1998-04-28 | 2005-07-12 | Ibm Canada Limited-Ibm Canada Limitee | Multi-variable graphical interface and method |
| US6577981B1 (en) * | 1998-08-21 | 2003-06-10 | National Instruments Corporation | Test executive system and method including process models for improved configurability |
| US6473707B1 (en) * | 1998-08-21 | 2002-10-29 | National Instruments Corporation | Test executive system and method including automatic result collection |
| US6639687B1 (en) * | 1998-09-08 | 2003-10-28 | International Business Machines Corporation | Progress indicator for multiple actions |
| US6453435B1 (en) * | 1998-12-29 | 2002-09-17 | Fujitsu Network Communications, Inc. | Method and apparatus for automated testing of circuit boards |
| US6597381B1 (en) * | 1999-07-24 | 2003-07-22 | Intelligent Reasoning Systems, Inc. | User interface for automated optical inspection systems |
| US6590587B1 (en) * | 1999-11-30 | 2003-07-08 | Agilent Technologies, Inc. | Monitoring system and method implementing navigation interface logic |
| JP2002016115A (en) * | 2000-06-30 | 2002-01-18 | Agilent Technologies Japan Ltd | Semiconductor parametric test equipment |
| US6859747B2 (en) * | 2001-04-26 | 2005-02-22 | Siemens Energy & Automation, Inc. | Method and apparatus for self-calibrating a motion control system |
| US6745140B2 (en) * | 2001-10-23 | 2004-06-01 | Agilent Technologies, Inc. | Electronic test system with test results view filter |
| JP2004021744A (en) * | 2002-06-18 | 2004-01-22 | Hitachi Ltd | Business process status grasping system, business process status grasping system recording medium, and business process status grasping display device |
| US7313728B2 (en) * | 2003-02-05 | 2007-12-25 | American Megatrends, Inc. | Method and system for logging and accessing diagnostic result messages |
-
2001
- 2001-10-23 US US10/000,603 patent/US6823272B2/en not_active Expired - Lifetime
-
2002
- 2002-04-18 TW TW091107947A patent/TW559664B/en not_active IP Right Cessation
- 2002-09-13 EP EP02256368A patent/EP1306683A3/en not_active Withdrawn
- 2002-10-21 JP JP2002305333A patent/JP2003202363A/en active Pending
- 2002-10-22 KR KR1020020064560A patent/KR20030033969A/en not_active Ceased
Also Published As
| Publication number | Publication date |
|---|---|
| KR20030033969A (en) | 2003-05-01 |
| TW559664B (en) | 2003-11-01 |
| US20030079162A1 (en) | 2003-04-24 |
| EP1306683A3 (en) | 2004-01-07 |
| JP2003202363A (en) | 2003-07-18 |
| US6823272B2 (en) | 2004-11-23 |
Similar Documents
| Publication | Publication Date | Title |
|---|---|---|
| US7047442B2 (en) | Electronic test program that can distinguish results | |
| US6823272B2 (en) | Test executive system with progress window | |
| US6745140B2 (en) | Electronic test system with test results view filter | |
| US20030078679A1 (en) | Test executive system with tree structure for summarizing results | |
| EP0988558B1 (en) | Low cost, easy to use automatic test system software | |
| US6246408B1 (en) | Graphical system and method for invoking measurements in a signal measurement system | |
| US5210859A (en) | Program debugging support method and apparatus | |
| EP1314989A2 (en) | Electronic test system and method | |
| US8225152B2 (en) | Method and apparatus for generating electronic test and data structure | |
| EP0463732A2 (en) | Method and system for animating the execution of a computer program | |
| US7050921B2 (en) | Electronic test program with run selection | |
| US7286951B2 (en) | Externally controllable electronic test program | |
| US6807506B2 (en) | Electronic test program with test triggered interactive displays | |
| US20030093728A1 (en) | Test executive system with a tape recorder type control interface | |
| US20030093718A1 (en) | Electronic test program with selectable specifications | |
| US11169203B1 (en) | Determining a configuration of a test system | |
| JPH11212630A (en) | Plant data analyzer |
Legal Events
| Date | Code | Title | Description |
|---|---|---|---|
| PUAI | Public reference made under article 153(3) epc to a published international application that has entered the european phase |
Free format text: ORIGINAL CODE: 0009012 |
|
| AK | Designated contracting states |
Designated state(s): AT BE BG CH CY CZ DE DK EE ES FI FR GB GR IE IT LI LU MC NL PT SE SK TR |
|
| AX | Request for extension of the european patent |
Extension state: AL LT LV MK RO SI |
|
| PUAL | Search report despatched |
Free format text: ORIGINAL CODE: 0009013 |
|
| AK | Designated contracting states |
Kind code of ref document: A3 Designated state(s): AT BE BG CH CY CZ DE DK EE ES FI FR GB GR IE IT LI LU MC NL PT SE SK TR |
|
| AX | Request for extension of the european patent |
Extension state: AL LT LV MK RO SI |
|
| 17P | Request for examination filed |
Effective date: 20040601 |
|
| AKX | Designation fees paid |
Designated state(s): DE FR GB |
|
| RAP1 | Party data changed (applicant data changed or rights of an application transferred) |
Owner name: AGILENT TECHNOLOGIES, INC. |
|
| STAA | Information on the status of an ep patent application or granted ep patent |
Free format text: STATUS: THE APPLICATION IS DEEMED TO BE WITHDRAWN |
|
| 18D | Application deemed to be withdrawn |
Effective date: 20090401 |