EP1259795B1 - Imaging apparatus and method - Google Patents
Imaging apparatus and method Download PDFInfo
- Publication number
- EP1259795B1 EP1259795B1 EP01909982A EP01909982A EP1259795B1 EP 1259795 B1 EP1259795 B1 EP 1259795B1 EP 01909982 A EP01909982 A EP 01909982A EP 01909982 A EP01909982 A EP 01909982A EP 1259795 B1 EP1259795 B1 EP 1259795B1
- Authority
- EP
- European Patent Office
- Prior art keywords
- thz
- sample
- radiation
- shows
- image
- Prior art date
- Legal status (The legal status is an assumption and is not a legal conclusion. Google has not performed a legal analysis and makes no representation as to the accuracy of the status listed.)
- Expired - Lifetime
Links
Images











Classifications
-
- A—HUMAN NECESSITIES
- A61—MEDICAL OR VETERINARY SCIENCE; HYGIENE
- A61B—DIAGNOSIS; SURGERY; IDENTIFICATION
- A61B5/00—Measuring for diagnostic purposes; Identification of persons
- A61B5/05—Detecting, measuring or recording for diagnosis by means of electric currents or magnetic fields; Measuring using microwaves or radio waves
-
- A—HUMAN NECESSITIES
- A61—MEDICAL OR VETERINARY SCIENCE; HYGIENE
- A61B—DIAGNOSIS; SURGERY; IDENTIFICATION
- A61B5/00—Measuring for diagnostic purposes; Identification of persons
- A61B5/05—Detecting, measuring or recording for diagnosis by means of electric currents or magnetic fields; Measuring using microwaves or radio waves
- A61B5/0507—Detecting, measuring or recording for diagnosis by means of electric currents or magnetic fields; Measuring using microwaves or radio waves using microwaves or terahertz waves
-
- A—HUMAN NECESSITIES
- A61—MEDICAL OR VETERINARY SCIENCE; HYGIENE
- A61B—DIAGNOSIS; SURGERY; IDENTIFICATION
- A61B5/00—Measuring for diagnostic purposes; Identification of persons
- A61B5/45—For evaluating or diagnosing the musculoskeletal system or teeth
- A61B5/4538—Evaluating a particular part of the muscoloskeletal system or a particular medical condition
- A61B5/4542—Evaluating the mouth, e.g. the jaw
- A61B5/4547—Evaluating teeth
-
- G—PHYSICS
- G01—MEASURING; TESTING
- G01N—INVESTIGATING OR ANALYSING MATERIALS BY DETERMINING THEIR CHEMICAL OR PHYSICAL PROPERTIES
- G01N21/00—Investigating or analysing materials by the use of optical means, i.e. using sub-millimetre waves, infrared, visible or ultraviolet light
- G01N21/17—Systems in which incident light is modified in accordance with the properties of the material investigated
- G01N21/25—Colour; Spectral properties, i.e. comparison of effect of material on the light at two or more different wavelengths or wavelength bands
- G01N21/31—Investigating relative effect of material at wavelengths characteristic of specific elements or molecules, e.g. atomic absorption spectrometry
- G01N21/35—Investigating relative effect of material at wavelengths characteristic of specific elements or molecules, e.g. atomic absorption spectrometry using infrared light
- G01N21/3581—Investigating relative effect of material at wavelengths characteristic of specific elements or molecules, e.g. atomic absorption spectrometry using infrared light using far infrared light; using Terahertz radiation
-
- G—PHYSICS
- G01—MEASURING; TESTING
- G01N—INVESTIGATING OR ANALYSING MATERIALS BY DETERMINING THEIR CHEMICAL OR PHYSICAL PROPERTIES
- G01N21/00—Investigating or analysing materials by the use of optical means, i.e. using sub-millimetre waves, infrared, visible or ultraviolet light
- G01N21/17—Systems in which incident light is modified in accordance with the properties of the material investigated
- G01N21/47—Scattering, i.e. diffuse reflection
- G01N21/4795—Scattering, i.e. diffuse reflection spatially resolved investigating of object in scattering medium
-
- G—PHYSICS
- G01—MEASURING; TESTING
- G01N—INVESTIGATING OR ANALYSING MATERIALS BY DETERMINING THEIR CHEMICAL OR PHYSICAL PROPERTIES
- G01N21/00—Investigating or analysing materials by the use of optical means, i.e. using sub-millimetre waves, infrared, visible or ultraviolet light
- G01N21/17—Systems in which incident light is modified in accordance with the properties of the material investigated
- G01N21/41—Refractivity; Phase-affecting properties, e.g. optical path length
- G01N21/43—Refractivity; Phase-affecting properties, e.g. optical path length by measuring critical angle
Definitions
- the present invention is concerned with the field of investigating and imaging samples primarily using radiation in the frequency range from 25GHz to 100THz.
- This frequency range extends from the mid infrared range up to, and including the lower end of the microwave range.
- This range of frequencies encompasses the Terahertz (THz) range and is generally referred to as THz radiation.
- THz Terahertz
- Such radiation is non-ionising and, as a result, it is particularly of use in medical applications.
- radiation is generally reflected from or transmitted through the patient. Radiation in the above frequency range is generally quite heavily absorbed in structures having a high water content. Therefore, reflection measurements are believed to be of particular use in such investigations.
- EP 0 864 857 describes a method and apparatus for tomographic imaging using Terahertz radiation.
- WO 00/75641 describes a method of forming 3 dimensional images using Terahertz radiation.
- the present invention provides a method of imaging a sample, the method comprising the steps of:
- the area of the sample which is to be imaged will be subdivided into a two-dimensional array of pixels and the radiation will be detected from each of the pixels.
- the sample may be moved relative to the beam of radiation or the beam may be moved relative to the sample, or both.
- the whole area of the sample could be irradiated and the radiation transmitted through or detected form the area of the sample could be detected by a CCD camera or the like.
- the Terahertz pulse which is used to irradiate the sample will spread out due to its passage through the sample. As a result, different parts of the pulse will be detected at different times.
- the method of the first aspect of the present invention generates an image using a specific 't'.
- the radiation can be detected at a specific time 't', this is advantageous as it does not require detecting radiation for every 't' and hence the acquisition time of the image is substantially improved.
- This method could be used for either or both of transmitted data or reflected data.
- the present invention provides an apparatus for imaging a sample comprising:
- the apparatus preferably further comprising means for displaying a plurality of images generated from different time points. More preferably, the apparatus comprises optimising means for optimising the image using the variable parameter of the delay time.
- FIG. 1 shows a basic THz imaging system.
- the system can be simplified into three main sections, a generator 31, an imaging section 33 and a detection section 35.
- THz radiation is generated in the generating section 31 by using a THz emitter which is supplied by a visible pulsed laser 37.
- a THz beam 39 is emitted from generation section 31 and is directed onto sample 41 of the imaging section 33.
- the THz beam 39 is then reflected from sample 41 and directed via further optics 45 into the detection section 35.
- the THz beam which is reflected from the sample 41 is beam 39.
- the detection section reads the information carried in the detected THz signal via a visible light signal and AC Pockels effect.
- the visible light can be obtained from laser 37 via beam splitter 47.
- Laser 37 is a Ti : Sapphire laser which typically produces wavelengths in the range of 900nm to 350nm, with a pulse width of 50fs and a repetition rate of 82 MHz.
- Beam splitter 47 splits the beam into a reference beam 55 and a beam for THz generation.
- a time delay is added to the reference beam 55 via time delay line 34. Varying the time delay via the time delay line allows the phase of the reference beam to be varied with respect to that of the THz beam 39. This is used in detecting the THz beam in detection system 35.
- the system e.g. the control of the sample 41 movement, the time delay 34 and the detected signal processing
- computer 36 controls computer 36. Details of the AC Pockels effect will be described with reference to Figure 3.
- Figure 2 shows a generator which can be used with the imaging system of Figure 1
- details of the detection part of the system will be omitted. These will be described with reference to Figure 3.
- FIG. 2 shows a THz generator using a frequency conversion member which may be a crystal which non-linear properties of the like such as ZnTe.
- the radiation used to generate the THz radiation via frequency conversion member 315.
- Radiation is supplied to frequency conversion member 315 from Ti:Sapphire crystal 317.
- Ti:Sapphire crystal 317 emits a pump beam, which comprises pulses of radiation, in response to radiation with laser driving beam 319.
- the driving beam 319 is directed onto crystal 317 using mirrors M1 and M2.
- the driving beam 319 can pass through mirror M3 and onto lasing crystal 317.
- the driving beam 319 which is not absorbed by crystal 317, is emitted through mirror M4.
- Mirror M4 serves to reflect any radiation back onto the lasing crystal 317. This radiation is then reflected via mirror M3 onto mirror M5 and onto output coupler 321.
- Output coupler 321 serves to reflect the pump beam 307 onto the frequency conversion member 315 to produce Terahertz radiation.
- the pump beam is focused onto frequency conversion member 315 via lens L1. Any radiation which is transmitted through the frequency conversion member 315 is reflected back through the frequency conversion member 315 by mirror M6. This radiation then impinges on output coupler 321.
- Output coupler 321 transmits terahertz radiation, but it reflects most of the pump beam back onto mirror M5, which in turn reflects the radiation back onto the lasing crystal 317 via mirror M3.
- the lasing crystal 317 and the frequency conversion member 315 are all located within the same lasing cavity defined by mirror M6, the output coupler and mirrors M5, M3 and M4.
- the pump beam 307 is continuously reflected within this cavity to efficiently generate the pump beam and the THz beam.
- the THz beam 53 which is emitted from output coupler 321 is directed into the imaging section 33 and onto sample 41 via THz imaging optics (not shown).
- the sample 41 is located on a motorised X-Y translation stage (not shown) so that the whole sample 41 can be imaged. (The x-y plane is orthogonal to the beam axis).
- the THz radiation carrying the imaging information from the sample is reflected into the THz detection system 35 via THz imaging optics 45.
- Output coupler 321 transmits some visible radiation 55 as well as THz radiation as a reference beam 55. Imaging and electro-optic detection can be performed inside a single nitrogen-purged unit.
- the sample 41 is mounted on a X-Y motorised translation stage (not shown) which is controlled by a PC computer (not shown). Each section (pixel) of the object may then be imaged.
- a PC computer not shown
- Each section (pixel) of the object may then be imaged.
- off-axis parabolic mirrors, condenser cones, and lenses may be used to focus the beam to a diffraction limit spot.
- the diffraction limit By mounting the sample in the near field of a condenser cone, the diffraction limit may be overcome and spatial resolution of about 50 ⁇ m may be achieved.
- the imaging system can function with or without such objects depending on the nature of the object to be imaged and the nature of the detection circuit.
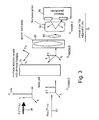
- FIG. 3 shows the detection system in detail.
- the THz beam 39 carrying the imaging information and a visible light beam 55 are inputted into the THz detection system.
- the visible light beam 55 acts as a reference beam which is incident on the detection crystal 73.
- the reference beam 55 is linearly polarised and the polarisation is orientated such that it has components along both the ordinary and extraordinary axis of the detection crystal 73.
- Each of the axes has distinct refractive indices n o and n e along the ordinary and extraordinary axis of the crystal 73 respectively.
- the linearly polarised reference beam 55 passes through the detection crystal 73 with negligible change in its polarisation.
- variable retardation waveplate e.g. a quarter waveplate 81.
- the emitted beam 77 is converted into a circularly polarised beam 83 using quarter wave plate 81. This is then split into two linearly polarised beams by a Wollaston Prism 79 (or equivalent device for separating orthogonal polarisation components) which directs the two orthogonal components of the polarised beam onto a balanced photodiode 85.
- the balanced photodiode signal is adjusted using wave plate 81 such that the difference in outputs between the two diodes is zero.
- the detector 73 also detects a secondary beam 69 (in this case a beam with a frequency in the THz range) as well as a reference beam, the angle ⁇ through which the polarisation is rotated by is not negligible. This is because the THz electric field modifies the refractive index of the visible (fundamental) radiation along one of the axes n e , n o . This results in the visible field after the detector 73 being elliptical and hence the polarisation components separated by the prism 79 are not equal. The difference in the voltage between the output diodes gives a detection voltage.
- the reference beam 55 and the THz beam 39 should stay in phase as they pass through the crystal 73. Otherwise the polarisation rotation ⁇ is obscured. Therefore, the detection crystal 73 has phase matching means to produce a clear signal.
- Figure 4 illustrates a so-called photoconductive emitter.
- the emitter comprises a member 91 comprising a semiconductor such as low temperature GaAs, GaAs, Si on Sapphire etc.
- the semiconductor member has a pair of electrodes 93a and 93b located on its surface.
- the electrodes 93a and 93b are connected to a power supply such that a field can be generated between the two electrodes 93a and 93b.
- the electrodes may be triangular and arranged in a bow-tie shape, a so-called bow-tie antenna or they may be interdigitated electrodes at the centre of a bow tie or spiral antenna. Alternatively, such designs may be incorporated into transmission lines on the chip.
- the semiconductor member is irradiated by a pump beam which is a pulse of radiation (about 70fs) of the type which can be emitted by laser 37.
- the pulse comprises at least two frequencies ⁇ 1 and ⁇ 2 , the difference of which gives a frequency in the THz regime.
- the pump beam impinges on the semiconductor member 91 on the part of its surface between the electrodes 93a and 93b, i.e. where the field is applied.
- the beating of the two visible or near-infrared frequencies in the non-linear region of the semiconductor member between the two electrodes 93a and 93b results in the emission of THz radiation from the semiconductor member 91.
- the semiconductor member 23 is provided with a lens 95, which may be of a hemispherical or other design, on its surface which is opposite to that of the surface with the electrodes, to allow the emission of a beam of THz radiation.
- FIG. 5 shows a further example of a detector which may be used with the imaging system of Figure 1.
- This type of detector is known as a photoconductive detector and comprises a detection member which may be, for example, GaAs, Si on Sapphire etc.
- the THz radiation is incident on the back surface of the detection member 96.
- the radiation is collected by lens 98 which may be hemispherical or have another shape.
- On the opposing side of the detection member 96 is located a pair of electrodes 97a and 97b. The region between these two electrodes 97a and 97b is illuminated by radiation of the visible or near infrared range.
- the near-infrared/visible radiation illuminates the surface of the detector between the electrodes 97a and 97b.
- the Terahertz radiation which is collected by lens 98 induces a photocurrent through the region between the electrodes 97a and 97b which is being illuminated by the visible/infrared radiation.
- the current which can be detected by the electrodes is proportional to the strength of the THz field.
- the electrode 97a, 97b may be of a simple diode formation embedded in a transmission line. Alternatively, they may be triangular and arranged in the shape of a bow-tie to from a so-called bow-tie antenna. They may also be interdigitated electrodes at the centre of a bow-tie or spiral antenna.
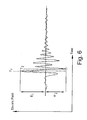
- Figure 6 shows a schematic trace of a THz pulse which has been reflected from the sample using the type of apparatus which is shown for the example in Figure 1.
- An oscillating electric field is plotted on the y axis against time along the x-axis.
- methods of extracting information from the trace have used either the position in time of the maxima of the electric field (T 1 ) or the position in time of the minima of the electric field (T 2 ).
- Figure 7 shows a reflection image of a skin carcinoma.
- Figure 7a shows the THz image and
- Figure 7b shows the image using visible radiation.
- the delay time may be the maxima of the electric field in some parts of the sample or the minima of the electric field in other parts of the sample. It can be seen that this image shows good contrast. As it is only necessary to measure the THz signal at a particular delay time, there is no need to continually sample the whole of the THz pulse. Therefore, the image can be produced using a much shorter acquisition time. Also, the image requires less processing.
- Figures 8a and 8b show two images generated using THz radiation of a tooth.
- Figures 8a and 8b were produced in a similar manner to that of Figure 7. In other words, the image was taken for a single time delay. The time delay chosen was 0 picoseconds for Figure 8a.
- Figure 8b shows the same tooth of Figure 8a, however, here the time delay is 6.99 picoseconds. It can be seen that the image in Figure 8b is far sharper than that of Figure 8a. The optimum image can be obtained by choosing the correct time delay.
- Figure 9a shows a visible image of a tooth.
- the tooth is actually a slice through a tooth, the various regions such as the enamel-dentine region 201 and the pulp cavity region 203 can be distinguished.
- the enamel dentine region 201 has decayed due to caries in regions 205 and 207.
- Figure 9b shows four THz traces plotted as amplitude of detected THz signal against time delay for three regions of the tooth and a reference signal. It can be seen that the reflected detected THz is quite different for the various regions. For example at peak 209, the signal taken in the enamel region (E) of the tooth is seen to dominate. Similarly, at peak 211, the dentine signal (D) is seen to dominate. At peak 213 the signal due to caries (C) dominates the trace. The reference signal (R) is generally seen to be the lowest peak.
- Figures 9c, 9d and 9e show images of the tooth taken at times -0.08ps, 0.1ps and 3.34ps. These times correspond to the x axis of the Figure 9b.
- the trace as seen in Figure 9b will have to gathered for every part of the tooth of Figure 10a, but only for a single point on the x-axis, looking at a particular delay time is referred to as taking a time slice through the spectra.
- the decayed regions 205 and 207 can be seen in all of figures 9c, 9d and 9e.
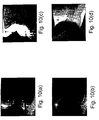
- Figures 10a to 10d show further time slices of the tooth of figure 9a, which have not been optimised to illustrate carious regions 205 and 207. Comparing the time slices of Figures 10a to 10d with those of Figures 9c to 9e, it can be seen that the contrast especially in the caries region 205 and 207 is far more marked in Figures 9c to 9e as opposed to Figures 10a to 10b.
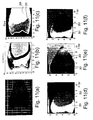
- Figure 11 shows a range of different images for a tooth.
- the tooth used to generate the images of Figure 11 is different to the tooth used to generate the images of Figure 9.
- a visible image of a slice through the tooth is shown in Figure 11a. It can be seen that there is no decay in this tooth.
- Figure 11b shows a THz absorption image of the tooth of Figure 11a. This is just simply obtained by measuring the electric field for each point on the tooth at the detector.
- the absorption image here is generated from all of the frequencies of the incident pulse of THz radiation, i.e. it is a panchromatic image.
- Figure 11c is a so-called time of flight image.
- Figure 9c which shows the THz trace, it can be seen that there is a maxima of the electric field.
- the time of flight image looks at this maxima and plots the change in temporal position of the this maxima for each point in the area of the sample being imaged.
- the pulp cavity 203 and the enamel dentine region 201 can be easily distinguished.
- Figures 11d, 11e and 11f show time slices (similar to those described for Figures 9c to 9Ee) for delay times -0.1ps, 2.4ps and 3.1ps respectively. It can be seen that the contrast of the enamel dentine region 201 with the pulp cavity 203 changes dramatically between the three figures. Also, there is no indication of caries in any of the enamel regions in all of the time slices.
- Figure 12 shows a further tooth.
- Figure 12a shows a visible image of the tooth, again the enamel dentine region 201 and the root/pulp cavity 203 can be easily determined.
- the tooth has a caries region 205 which can not be easily seen on the visible image 203.
- Figure 12b shows the absorption image which is obtained in the same way as Figure 11B.
- Figure 12c shows a time slice.
- the caries region 205 can be easily seen.
- Figure 12d shows an image which is plotted by plotting the maxima of the electric field for each point of the sample which is irradiated.
- the enamel dentine region 201 can be seen.
- the caries region 205 is very weak and much weaker for that than the time slice shown in Figure 12c.
- the acquisition time for the time slice can be very fast because it is only necessary to detect the reflected THz for a single point in time.
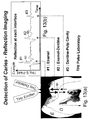
- Figure 13 shows a further image of a tooth.
- Figure 13a shows a visible image whereas Figure 13b shows a single plot of the THz reflected electric field against time.
- the THz image is taken along path 101 of the tooth.
- the first peak 103 is due to reflection of the THz from the enamel/air surface.
- the second peak 105 is due to reflection of the THz from the enamel/dentine interface e-d in the tooth.
- the third and weakest reflection is due to the dentine/pulp cavity interface d-p of the tooth.
- Figure 14a shows a visible image of a slice of a tooth.
- the tooth has a healthy region 109 and a decayed region 111.
- Figure 14b shows a THz pulse in the time domain measured in the healthy region 109.
- Figure 14c shows a THz pulse measured in the time domain for the unhealthy region which is decayed due to caries 111.
- two interfaces can be seen. The first is the enamel/air interface 113, the second is the enamel/dentine interface 115.
- the healthy region two peaks 117 and 119 can be easily distinguished.
- the upper peak 117 is believed to be due to the reflection of the THz at interface 113
- the second peak 119 is due to the reflection of THz at interface 115.
- the peak due to the reflection from interface 113 is seen to be of almost the same height as the corresponding peak in Figure 14b.
- the second peak which is due to the reflection from interface 115 is seen to be much smaller. This is because a region of the tooth which is decayed due to caries absorbs THz far more strongly than a region which has not decayed. Hence, less of the THz penetrates as far as interface 115 and THz which is reflected from this interface is also more strongly absorbed than in the case of healthy teeth. Hence, peak 119 is considerably reduced in the trace of the unhealthy region.
- the height of the peak from interface 113 should be identical in both traces b and c. However, due to their different positions on the tooth, possibly dirt on the surface of the tooth, they will almost always be different, therefore, in order to detect the presence of caries, the ratio of peak heights 117 and 119 between a healthy region and an unhealthy region should be compared.
- Figure 15 shows a schematic of a healthy area of skin and an unhealthy area of skin.
- Figure 15b shows the THz pulse which has been reflected from a healthy region of the skin
- Figure 15c shows a THz pulse in the time domain which has been reflected from an unhealthy portion of the skin.
- a skin/air interface 121 is shown and a skin/fat interface 123.
- a healthy area 125 and an unhealthy area 127 which contains tumour 129.
- Figure 15b shows a THz time domain pulse for the healthy area 125.
- the first peak 131 is due to reflection from interface 121.
- the second peak 133 is due to reflection from skin/fat interface 123.
- Figure 15c shows a similar trace except here, it is taken in unhealthy region 127.
- the size of peak 131 remains virtually the same. However, the size of peak 133 is substantially reduced due to the absorption by the tumour 129.
- the lateral extent of the tumour can be determined as shown in Figure 15d.
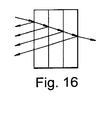
- FIG 16 shows a THz pulse incident on a sample.
- the THz pulse propagates in the x-direction and is scattered (reflected) into a counter-propagating, or reflected, pulse by the object.
- the following analysis will only consider one spatial dimension (x) (i.e. for the case of a collimated THz beam path). It will also be assumed the object is uniform in the y-z plane over the dimensions of the THz beam. Given the 1-D analysis described here to provide information on the structure of the object in the x-direction, the variation of the object in the y-z directions may be obtained by scanning the object through the THz beam in the y-z plane (or, alternatively, scanning the THz beam over the object).
- the analysis can be used to determine both how the absorption and the refractive index spatially varies within the sample.
- both the absorption coefficient and the refractive index vary also with frequency.
- the following analysis assumes that the frequency response of the refractive index is known and also that the absorption coefficient does not vary with frequency.
- THz pulses are characterised by electric fields T (x,t) and R (x,t) respectively.
- the ⁇ -subscripts indicate that a quantity is a function of ⁇ .
- the left-hand-sides of the above equations describe the propagation of the two counter-propagating waves.
- the right-hand-sides provide the 'coupling' terms which transfer energy from one beam to the other in the presence of a scattering potential.
- ⁇ / 2 For a lossy medium where ⁇ / 2 >> n ⁇ / c (such as water-based biological media) a Real spatial variation in ⁇ is due to a spatial variation in the absorption coefficient of the medium. Previously, only a spatial variation in the refractive index have been considered.
- the spatial variation of k is much smaller than the absolute value of k i.e. dk dx ⁇ k, and that the loss of energy from the incident wave due to reflection is much smaller than the loss due to absorption.
- Equation 2 may be solved (by the method of Laplace transformation, for example), to obtain R ⁇ :
- the THz reference pulse may be obtained by measuring the THz pulse reflected off a sample of known reflectivity such as a silver mirror, for example.
- W windowing function
- Equation 6 constitutes the main result.
- ⁇ (x) is obtained by numerical evaluation of Equation 6, once all the constituent factors have been determined. Since ⁇ is complex either the real or the imaginary part of the function may be plotted to form an image, or some combination. ⁇ obtained in this way is considered only an approximation to the exact structural form of the sample, in view of the approximations described above.
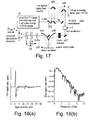
- FIG 17 shows an imaging system which is similar to Figure 1. To avoid unnecessary repetition, like reference numerals will be used to denote like features.
- a Ti:Sapphire laser system 37 (coherent Reg A9000) operating at a 250 kHz repetition rate is used to provide the input radiation.
- the radiation is split using beam splitter 47 to produce a probe beam 55 and a pump beam 39.
- the pump beam is first directed through a 1 ns delay line 401. This is a static delay line and is used to make fine adjustments to the path length.
- the pump beam is then directed into a 150 ps scanning delay line 403 having a scanning frequency of 20 Hz.
- the scanning delay line has a linear-position output so that it is possible to know the position of the delay line when each measurement is taken.
- the pump beam is then fed through a 64 kHz modulator 405 which chops the beam at this frequency in order to provide a frequency for detection using lock-in techniques.
- the pump beam 39 is then directed onto GaAs antenna 407.
- the antenna is biased to 1.1 kV and average powers of over I nW are generator.
- the pump beam 39 power delivered to the antenna is 1 to 2 ⁇ J.
- Such antennas are described in detail in J.T. Darrow and B.B. Hu and X.-C. Zhang and D.H. Auston 1990, Optics Lett., 15 (6), pages 323-5, Z.G. Lu and P.Campbell and X.-C. Zhang, 1997 Appl. Phys. Lett., 71 (5), pages 593-5, and G. Mouret and W. Chen and D. Boucher and R. Bocquet and P Mounaix and D. Theron and D.
- a quartz window is used in order to flatten the skin to improve the image.
- Figure 18a shows a typical plot of THz signal (arbitrary units) against delay time of the optical pulse (measured by the 150 ps scanning delay line) which can be obtained using the apparatus of Figure 17.
- the smaller oscillations after the main pulse are due to atmospheric water-vapour absorption and dispersion in the THz beam path.
- a small signal can be seen at 10 ps after the main pulse due to back-reflections from the GaAs antenna substrate.
- the signal-to-noise ratio for a typical THz waveform is greater than 6000 to 1 for a single delay line scan. This typically has an acquisition time of 50 ms.
- FIG. 18b The bandwidth envelope which is obtained from Fourier transforming the time domain waveform of Figure 18a is shown in Figure 18b.
- Figure 18b actually shows the THz power spectrum.
- the spectrum peaks at 300 GHz with useful power to over 3 THz.
- the large THz throughput of the system allows the acquisition time for 3D data sets to be reduced to just a few minutes.
- Figure 19 is a schematic of the outermost layers of human skin.
- the stratum corneum 421 being the outermost layer
- the middle layer is the epidermis 423
- the innermost layer of interest in these experiments is the dermis layer 425.
- a single THz pulse 427 is reflected from the skin, multiple reflections due to the stratum corneum/air interface 429, stratum corneum/epidermis interface 431 and the epidermis/dermis interface 433. The signal from each of these interfaces can be seen in the output pulse 435.
- FIG. 20 to 25 The data shown in Figures 20 to 25 is taken from the human arm shown in Figure 20.
- Point a indicates the centre inside forum
- point b indicates the inside wrist
- point c indicates the palm of the hand
- point d indicates the side of the hand
- point e indicates the second fingertip.
- THz radiation is non-ionising and low average powers are used (typically 1 mW). Therefore, brief exposure to it is not thought to be hazardous.
- Figure 21 a shows a time domain THz waveform obtained from point a on Figure 20.
- the time domain waveform has been processed in order to remove some unwanted artefacts.
- the oscillations following the main pulse due to atmospheric water removed by deconvolving the data set with the reference pulse waveform obtained in the absence of the sample.
- the data set is also spectrally filtered to remove out of band noise by applying a band pass filter with pass band adjusted to match that of the reference pulse.
- Figure 21a the data for point a is shown as a solid line. This is compared with a dashed line which shows data for air (measured in absence of sample) and a dotted line which shows the waveform obtained from a pure water sample.
- the THz waveform in the absence of the sample shows a gaussian pulse corresponding to reflection from the top surface of the window (window-air interface).
- the width of this gaussian indicates the temporal resolution obtainable with the technology as determined by the band width of the THz pulse.
- the waveform obtained from water is opposite in polarity to the no-sample case as expected for a reflection from a higher refractive-index dielectric. After the initial transient, water displays a damped decay back to zero over a period of 1 to 2 ps.
- the THz waveform of the forearm from point a displays a positive peak at zero optical delay corresponding to the presence of the relatively dehydrated stratum corneum layer. For delay values greater than this, the THz waveform appears to be substantially similar to that for water. This indicates that there is a high water content in the upper dermal layer.
- the bandwidth of the system is efficient to a depth resolution of about 40 ⁇ m into the skin.
- the stratum corneum of the forearm is typically 10 to 20 ⁇ m.
- the positive peak can be taken as a measure of the dehydration volume of the stratum corneum. The stratum corneum thickness cannot be distinguished from the dehydration level in this case.
- Figure 21b shows a process waveform for skin at point a (solid line), point b (dashed line) and point c (dotted line).
- point a solid line
- point b dashed line
- point c dotted line
- Figure 22a and b show images obtained by raster scanning a 1 cm by 1 cm area of the side of the subject's hand (point d) in Figure 20.
- Figure 22a is generated by plotting the peak value of the processed THz waveform corresponding to the outside surface of the stratum corneum along the z axis (i.e. out of the palm) across the whole 1 cm by 1 cm area). Typical features of the skin surface (lines, wrinkles etc) are evident.
- Figure 22b shows essentially a time slice image where the THz waveform values at a time delay corresponding to the stratum comeumepidermis interface are plotted. This allows variations in the stratum corneum thickness over the scanned area to be seen. (Low x values are towards the palm side of the hand while the higher values are towards the back-side).
- Figures 23a and 23b show slices through a 3D data set.
- the grey scale indicates the THz amplitude and is plotted against optical delay (vertical access) and x position across the horizontal axis.
- the figures indicate the stratum comeum/epidermis interface and also the stratum corneum surface.
- Figure 23a is taken at point c whereas Figure 23b is taken at point d.
- THz The sensitivity of THz towards absorption is shown in Figure 24a.
- the reflective parts from the forearm of Figure 20 were measured before and at intervals after hydrating the stratum corneum by application of water-soaked gauze.
- Trace “a” shows a THz signal prior to removal of the gauze
- trace “b” shows the signal immediately after removal of the gauze.
- the THz waveform is strongly suppressed at zero optical delay indicating near-saturated hydration of the stratum corneum
- traces "c" to "e” show the same measurement five minutes, ten minutes and fifteen minutes respectively after removal of the gauze.
- the soaked region of skin is exposed to an ambient atmosphere (23°C).
- the zero-delay peak covers over a characteristic time of 15 minutes. It is interesting to note that although the positive peak covers after initial hydration, the following minimum is first reduced in depth by hydration and subsequently increases to become more negative than before hydration.
- Figure 24b shows the change in the hydration level of the stratum corium produced by application of 60 milligrams of 10% glycerine solution.
- the dotted line indicates the waveform before the glycerine is applied.
- the solid line shows the waveform 8 minutes after application of the solution.
- the forearm for glycerine results display the same suppression of the zero-delay peak as those achieved using pure water. Actually, the zero-delay peak appears more strongly suppressed than in the pure water case after five minutes drying time. Indicating the improved retention of water in the presence of glycerine. Little change is seen in the hydration level of the palm. However, small changes in the features of a later time delay can be seen.
- Figure 25a illustrates the effect of occlusion of the stratum corneum interface by the quartz window.
- THz measurements were made at 45 second intervals over a 15 minute period with the skin in continuous contact with quartz.
- the scans are offset from one another along the x axis with the later most times to the right.
- the size of the zero-delay peak decreases with an exponential decay form.
Landscapes
- Health & Medical Sciences (AREA)
- Life Sciences & Earth Sciences (AREA)
- Physics & Mathematics (AREA)
- Pathology (AREA)
- General Health & Medical Sciences (AREA)
- Veterinary Medicine (AREA)
- Biophysics (AREA)
- Public Health (AREA)
- Engineering & Computer Science (AREA)
- Biomedical Technology (AREA)
- Heart & Thoracic Surgery (AREA)
- Medical Informatics (AREA)
- Molecular Biology (AREA)
- Surgery (AREA)
- Animal Behavior & Ethology (AREA)
- General Physics & Mathematics (AREA)
- Spectroscopy & Molecular Physics (AREA)
- Immunology (AREA)
- Nuclear Medicine, Radiotherapy & Molecular Imaging (AREA)
- Biochemistry (AREA)
- Analytical Chemistry (AREA)
- Radiology & Medical Imaging (AREA)
- Chemical & Material Sciences (AREA)
- Rheumatology (AREA)
- Toxicology (AREA)
- Orthopedic Medicine & Surgery (AREA)
- Oral & Maxillofacial Surgery (AREA)
- Dentistry (AREA)
- Physical Education & Sports Medicine (AREA)
- Optics & Photonics (AREA)
- Investigating Or Analysing Materials By Optical Means (AREA)
- Analysing Materials By The Use Of Radiation (AREA)
- Air Bags (AREA)
- Traffic Control Systems (AREA)
- Vehicle Body Suspensions (AREA)
- Ultra Sonic Daignosis Equipment (AREA)
- Length Measuring Devices By Optical Means (AREA)
Abstract
Description
- The present invention is concerned with the field of investigating and imaging samples primarily using radiation in the frequency range from 25GHz to 100THz. This frequency range extends from the mid infrared range up to, and including the lower end of the microwave range. This range of frequencies encompasses the Terahertz (THz) range and is generally referred to as THz radiation.
- Such radiation is non-ionising and, as a result, it is particularly of use in medical applications. In any type of medical imaging, radiation is generally reflected from or transmitted through the patient. Radiation in the above frequency range is generally quite heavily absorbed in structures having a high water content. Therefore, reflection measurements are believed to be of particular use in such investigations.
- Reflection measurements in non-lossy materials have been previously demonstrated in
EP 0 864 857. This document explains how to perform simple analysis using reflection measurements on non-lossy materials which have sharp discontinuities in their refractive index, The position of the dielectric interfaces within a floppy disc is used to demonstrate the technique. - However, medical samples in general are particularly lossy media, in other words, Terahertz radiation is strongly absorbed in such structures. Also, there is a need to be able to determine the structure of sample which does not have sharp discontinuities in its refractive index.
- Mittleman et al "T-Ray Imaging" IEEE Journal of Selected Problems in Quantum Electronics Vol. 2, No. 3 pg 679 to 692 presents an overview of imaging using Terahertz radiation.
-
EP 0 864 857 describes a method and apparatus for tomographic imaging using Terahertz radiation. -
WO 00/75641 describes a method of forming 3 dimensional images using Terahertz radiation. - When studying a sample, it is usually desirable to generate and image of the sample.
Typically, images of the sample have been generated by plotting the maxima or minima of the detected Terahertz radiation. However, it has been found that a better contrast can be obtained by looking at the THz electric field for a particular time delay. - Therefore, in a first aspect, the present invention provides a method of imaging a sample, the method comprising the steps of:
- irradiating a sample with a pulse of electromagnetic radiation, said pulse having a plurality of frequencies in the range from 25 GHz to 100 THz;
- detecting the amplitude of the radiation; and
- generating an image of sample using the amplitude of the detected radiation at a particular point in time.
- In order to generate an image, it is necessary to measure the THz signal from a number of different parts of the sample. Typically, the area of the sample which is to be imaged will be subdivided into a two-dimensional array of pixels and the radiation will be detected from each of the pixels. In order to detect radiation from each of the pixels, the sample may be moved relative to the beam of radiation or the beam may be moved relative to the sample, or both. Alternatively, the whole area of the sample could be irradiated and the radiation transmitted through or detected form the area of the sample could be detected by a CCD camera or the like.
- The Terahertz pulse which is used to irradiate the sample will spread out due to its passage through the sample. As a result, different parts of the pulse will be detected at different times. The leading edge of the pulse of a particular features of the pulse, can be thought of as arriving at the detector at a time t=0, then the other parts of the pulse will arrive at the detector with a delay time "t".
- The method of the first aspect of the present invention generates an image using a specific 't'.
- The radiation can be detected at a specific time 't', this is advantageous as it does not require detecting radiation for every 't' and hence the acquisition time of the image is substantially improved.
- Alternatively, it may be desirable to detect the radiation for a range of 't' and then select a particular "t" in order to generate the image. This allows an image to be scannable using "t" as the scanning variable. Thus, someone using the method could scan the image for various "t" until the image with the best contrast was obtained.
- This method could be used for either or both of transmitted data or reflected data.
- In a second aspect, the present invention provides an apparatus for imaging a sample comprising:
- means for irradiating a sample with a pulse of electromagnetic radiation, said pulse having a plurality of frequencies in the range from 25 GHz to 100 THz;
- means for detecting the amplitude of the radiation reflected from or transmitted by the sample; and
- means for generating an image of sample using the amplitude of the radiation detected at a single point in time.
- The apparatus preferably further comprising means for displaying a plurality of images generated from different time points. More preferably, the apparatus comprises optimising means for optimising the image using the variable parameter of the delay time.
- The present invention will now be described with reference to following preferred nonlimiting embodiments:
- Figure 1 shows a schematic imaging system;
- Figure 2 shows an example of a generation section for use with the imaging system of Figure 1;
- Figure 3 shows an example of a detection section for use with the imaging system of Figure 1;
- Figure 4 shows a further example of a generator for use with the imaging system of Figure 1;
- Figure 5 shows a further example of a detector for use with the imaging system of Figure 1;
- Figure 6 shows a schematic trace of a pulse detected by the imaging system of Figure 1;
- Figure 7 shows an image of a skin carcinoma produced in accordance with an embodiment of the present invention;
- Figures 8a and 8b shows two images of a tooth produced using a method in accordance with an embodiment of the present invention;
- Figure 9a shows a visible image of a slice through a tooth, figure 9b shows a typical THz time domain trace for a tooth, figures 9c, d and e show time slice images for the tooth at delayed times -0.08ps, 0.1ps and 3.34ps;
- Figure 10a to 10a show four images of time slices through the tooth shown in Figure 9A;
- Figure 11a shows a visible image of a tooth, Figure 11b shows an absorption image of the tooth of Figure 11a, Figure 11c shows a time of flight image of the tooth of Figure 11a, Figures 11d to 11f show time slices of the tooth of Figure 11a for times -0.1ps, 2.4ps and 3.1ps respectively;
- Figure 12a shows a visible image of a tooth, Figure 12b shows the absorption image of that tooth, Figure 12c shows a time slice through that tooth and Figure 12d shows an image of the tooth plotting the time of the maximum peak of the electric field;
- Figure 13 shows a visible image of a tooth and a THz signal from the tooth;
- Figure 14 shows a visible image of a tooth and two THz traces of diseased and healthy parts of the tooth;
- Figure 15 is a schematic of skin and shows a schematic signal from the skin; and
- Figure 16 shows a schematic layer structure of a sample which can be investigated using a method in accordance with an example, useful for understanding the present invention;
- Figure 17 shows a schematic of a variation of the imaging system of Figure 1;
- Figure 18a shows a typical signal measured by the apparatus of Figure 17 and Figure 18b shows the corresponding THz power spectrum;
- Figure 19 shows a schematic of the layers of skin and an input and reflected pulses;
- Figure 20 is a visible image of a human arm and hand indicating points on the arm and hand which are measured to produce the results in the following figures;
- Figure 21a is a plot of a time domain THz waveform measured from the forearm and compared with that from air and water; Figure 21b is a THz waveform comparing the reflected pulse from the forearm, wrist and palm;
- Figure 22a is a 1cm by 1cm image of the side of the hand of Figure 20; Figure 22b is a time slice image of the hand;
- Figure 23a is an image of the palm of the hand of Figure 20, Figure 23b shows the corresponding data from the edge of the subject's palm;
- Figure 24a is a comparative plot of a THz measurement of the forearm of Figure 20 under different wetting conditions; and Figure 24b shows plots of measurements of the palm and forearm before and after application of glycerine solution; and
- Figure 25 is a comparative plot of the changing characteristics of a forearm over a 15 minute period, Figure 25b is a plot of the maximas of the traces of Figure 25b against time.
- Figure 1 shows a basic THz imaging system. The system can be simplified into three main sections, a
generator 31, animaging section 33 and adetection section 35. THz radiation is generated in the generatingsection 31 by using a THz emitter which is supplied by a visiblepulsed laser 37. - A
THz beam 39 is emitted fromgeneration section 31 and is directed ontosample 41 of theimaging section 33. TheTHz beam 39 is then reflected fromsample 41 and directed viafurther optics 45 into thedetection section 35. The THz beam which is reflected from thesample 41 isbeam 39. - The detection section reads the information carried in the detected THz signal via a visible light signal and AC Pockels effect. The visible light can be obtained from
laser 37 viabeam splitter 47.Laser 37 is a Ti : Sapphire laser which typically produces wavelengths in the range of 900nm to 350nm, with a pulse width of 50fs and a repetition rate of 82 MHz. -
Beam splitter 47 splits the beam into areference beam 55 and a beam for THz generation. A time delay is added to thereference beam 55 viatime delay line 34. Varying the time delay via the time delay line allows the phase of the reference beam to be varied with respect to that of theTHz beam 39. This is used in detecting the THz beam indetection system 35. The system (e.g. the control of thesample 41 movement, thetime delay 34 and the detected signal processing) is controlled bycomputer 36.
Details of the AC Pockels effect will be described with reference to Figure 3. - Figure 2 shows a generator which can be used with the imaging system of Figure 1 Here, for simplicity, details of the detection part of the system will be omitted. These will be described with reference to Figure 3.
- Figure 2 shows a THz generator using a frequency conversion member which may be a crystal which non-linear properties of the like such as ZnTe. The radiation used to generate the THz radiation via
frequency conversion member 315. Radiation is supplied tofrequency conversion member 315 from Ti:Sapphire crystal 317. Ti:Sapphire crystal 317 emits a pump beam, which comprises pulses of radiation, in response to radiation withlaser driving beam 319. In order to provide efficient lasing, it is desirable to continually reflect thepump beam 307 onto Ti:Sapphire crystal 317. Therefore, the lasingcrystal 317 is typically provided within a lasing cavity. - The
driving beam 319 is directed ontocrystal 317 using mirrors M1 and M2. Thedriving beam 319 can pass through mirror M3 and onto lasingcrystal 317. Thedriving beam 319 which is not absorbed bycrystal 317, is emitted through mirror M4. Mirror M4 serves to reflect any radiation back onto thelasing crystal 317. This radiation is then reflected via mirror M3 onto mirror M5 and onto output coupler 321. Output coupler 321 serves to reflect thepump beam 307 onto thefrequency conversion member 315 to produce Terahertz radiation. The pump beam is focused ontofrequency conversion member 315 via lens L1. Any radiation which is transmitted through thefrequency conversion member 315 is reflected back through thefrequency conversion member 315 by mirror M6. This radiation then impinges on output coupler 321. - Output coupler 321 transmits terahertz radiation, but it reflects most of the pump beam back onto mirror M5, which in turn reflects the radiation back onto the
lasing crystal 317 via mirror M3. In other words, the lasingcrystal 317 and thefrequency conversion member 315 are all located within the same lasing cavity defined by mirror M6, the output coupler and mirrors M5, M3 and M4. Thepump beam 307 is continuously reflected within this cavity to efficiently generate the pump beam and the THz beam. - The
THz beam 53 which is emitted from output coupler 321 is directed into theimaging section 33 and ontosample 41 via THz imaging optics (not shown). Thesample 41 is located on a motorised X-Y translation stage (not shown) so that thewhole sample 41 can be imaged. (The x-y plane is orthogonal to the beam axis). The THz radiation carrying the imaging information from the sample is reflected into theTHz detection system 35 viaTHz imaging optics 45. - Output coupler 321 transmits some
visible radiation 55 as well as THz radiation as areference beam 55. Imaging and electro-optic detection can be performed inside a single nitrogen-purged unit. - The
sample 41 is mounted on a X-Y motorised translation stage (not shown) which is controlled by a PC computer (not shown). Each section (pixel) of the object may then be imaged. To improve the spatial resolution of the technique, off-axis parabolic mirrors, condenser cones, and lenses may be used to focus the beam to a diffraction limit spot. By mounting the sample in the near field of a condenser cone, the diffraction limit may be overcome and spatial resolution of about 50 µm may be achieved. The imaging system can function with or without such objects depending on the nature of the object to be imaged and the nature of the detection circuit. - Figure 3 shows the detection system in detail. The
THz beam 39 carrying the imaging information and avisible light beam 55 are inputted into the THz detection system. Thevisible light beam 55 acts as a reference beam which is incident on thedetection crystal 73. Thereference beam 55 is linearly polarised and the polarisation is orientated such that it has components along both the ordinary and extraordinary axis of thedetection crystal 73. Each of the axes has distinct refractive indices no and ne along the ordinary and extraordinary axis of thecrystal 73 respectively. In the absence of a second (THz)radiation beam 39, the linearly polarisedreference beam 55 passes through thedetection crystal 73 with negligible change in its polarisation. - The applicant wishes to clarify that the angle Θ through which the polarisation is rotated by is negligible. However, the linearly polarised beam can become slightly elliptical. This effect is compensated for by a variable retardation waveplate, e.g. a
quarter waveplate 81. - The emitted beam 77 is converted into a circularly polarised
beam 83 usingquarter wave plate 81. This is then split into two linearly polarised beams by a Wollaston Prism 79 (or equivalent device for separating orthogonal polarisation components) which directs the two orthogonal components of the polarised beam onto abalanced photodiode 85. The balanced photodiode signal is adjusted usingwave plate 81 such that the difference in outputs between the two diodes is zero. - However, if the
detector 73 also detects a secondary beam 69 (in this case a beam with a frequency in the THz range) as well as a reference beam, the angle Θ through which the polarisation is rotated by is not negligible. This is because the THz electric field modifies the refractive index of the visible (fundamental) radiation along one of the axes ne, no. This results in the visible field after thedetector 73 being elliptical and hence the polarisation components separated by theprism 79 are not equal. The difference in the voltage between the output diodes gives a detection voltage. - The
reference beam 55 and theTHz beam 39 should stay in phase as they pass through thecrystal 73. Otherwise the polarisation rotation Θ is obscured. Therefore, thedetection crystal 73 has phase matching means to produce a clear signal. - Other types of generator may also be used. Figure 4 illustrates a so-called photoconductive emitter. The emitter comprises a
member 91 comprising a semiconductor such as low temperature GaAs, GaAs, Si on Sapphire etc. The semiconductor member has a pair ofelectrodes electrodes electrodes - The simplest electrode arrangement is show in figure 4. However, the electrodes may be triangular and arranged in a bow-tie shape, a so-called bow-tie antenna or they may be interdigitated electrodes at the centre of a bow tie or spiral antenna. Alternatively, such designs may be incorporated into transmission lines on the chip.
- The semiconductor member is irradiated by a pump beam which is a pulse of radiation (about 70fs) of the type which can be emitted by
laser 37. The pulse comprises at least two frequencies ω1 and ω2, the difference of which gives a frequency in the THz regime. The pump beam impinges on thesemiconductor member 91 on the part of its surface between theelectrodes electrodes semiconductor member 91. The semiconductor member 23 is provided with alens 95, which may be of a hemispherical or other design, on its surface which is opposite to that of the surface with the electrodes, to allow the emission of a beam of THz radiation. - Figure 5 shows a further example of a detector which may be used with the imaging system of Figure 1. This type of detector is known as a photoconductive detector and comprises a detection member which may be, for example, GaAs, Si on Sapphire etc. The THz radiation is incident on the back surface of the
detection member 96. The radiation is collected bylens 98 which may be hemispherical or have another shape. On the opposing side of thedetection member 96 is located a pair ofelectrodes electrodes - The near-infrared/visible radiation illuminates the surface of the detector between the
electrodes lens 98 induces a photocurrent through the region between theelectrodes - The
electrode - Figure 6 shows a schematic trace of a THz pulse which has been reflected from the sample using the type of apparatus which is shown for the example in Figure 1.
- An oscillating electric field is plotted on the y axis against time along the x-axis. Typically, methods of extracting information from the trace have used either the position in time of the maxima of the electric field (T1) or the position in time of the minima of the electric field (T2).
- As it can be seen from Figure 6, the magnitude of the measured electric field changes considerably with time. There is only a small time difference between T1 and T2. When looking at an area of the sample, a trace like the one shown in Figure 6 will be obtained for each point of the sample. The trace will change from point to point or pixel to pixel dependent on the composition of the sample.
- Figure 7 shows a reflection image of a skin carcinoma. Figure 7a shows the THz image and Figure 7b shows the image using visible radiation.
- To generate the image in Figure 7a, only reflected radiation from a single delay time i.e. a single point on the x axis of Figure 6, is plotted. The delay time may be the maxima of the electric field in some parts of the sample or the minima of the electric field in other parts of the sample. It can be seen that this image shows good contrast. As it is only necessary to measure the THz signal at a particular delay time, there is no need to continually sample the whole of the THz pulse. Therefore, the image can be produced using a much shorter acquisition time. Also, the image requires less processing.
- Figures 8a and 8b show two images generated using THz radiation of a tooth. Figures 8a and 8b were produced in a similar manner to that of Figure 7. In other words, the image was taken for a single time delay. The time delay chosen was 0 picoseconds for Figure 8a.
- Figure 8b shows the same tooth of Figure 8a, however, here the time delay is 6.99 picoseconds. It can be seen that the image in Figure 8b is far sharper than that of Figure 8a. The optimum image can be obtained by choosing the correct time delay.
- Figure 9a shows a visible image of a tooth. The tooth is actually a slice through a tooth, the various regions such as the enamel-
dentine region 201 and thepulp cavity region 203 can be distinguished. Theenamel dentine region 201 has decayed due to caries inregions - Figure 9b shows four THz traces plotted as amplitude of detected THz signal against time delay for three regions of the tooth and a reference signal. It can be seen that the reflected detected THz is quite different for the various regions. For example at peak 209, the signal taken in the enamel region (E) of the tooth is seen to dominate. Similarly, at
peak 211, the dentine signal (D) is seen to dominate. Atpeak 213 the signal due to caries (C) dominates the trace. The reference signal (R) is generally seen to be the lowest peak. - By looking at the detected THz signals for different delay times, it is possible to distinguish differences between the different parts of the tooth.
- Figures 9c, 9d and 9e show images of the tooth taken at times -0.08ps, 0.1ps and 3.34ps. These times correspond to the x axis of the Figure 9b. The trace as seen in Figure 9b will have to gathered for every part of the tooth of Figure 10a, but only for a single point on the x-axis, looking at a particular delay time is referred to as taking a time slice through the spectra.
- The
decayed regions - Figures 10a to 10d show further time slices of the tooth of figure 9a, which have not been optimised to illustrate
carious regions caries region - Figure 11 shows a range of different images for a tooth. The tooth used to generate the images of Figure 11 is different to the tooth used to generate the images of Figure 9. Here, a visible image of a slice through the tooth is shown in Figure 11a. It can be seen that there is no decay in this tooth. Figure 11b shows a THz absorption image of the tooth of Figure 11a. This is just simply obtained by measuring the electric field for each point on the tooth at the detector. The absorption image here is generated from all of the frequencies of the incident pulse of THz radiation, i.e. it is a panchromatic image.
- Figure 11c is a so-called time of flight image. Returning momentarily back to Figure 9c which shows the THz trace, it can be seen that there is a maxima of the electric field. The time of flight image looks at this maxima and plots the change in temporal position of the this maxima for each point in the area of the sample being imaged.
- As with the absorption and visible images, the
pulp cavity 203 and theenamel dentine region 201 can be easily distinguished. - Figures 11d, 11e and 11f show time slices (similar to those described for Figures 9c to 9Ee) for delay times -0.1ps, 2.4ps and 3.1ps respectively. It can be seen that the contrast of the
enamel dentine region 201 with thepulp cavity 203 changes dramatically between the three figures. Also, there is no indication of caries in any of the enamel regions in all of the time slices. - Figure 12 shows a further tooth. Figure 12a shows a visible image of the tooth, again the
enamel dentine region 201 and the root/pulp cavity 203 can be easily determined.
The tooth has acaries region 205 which can not be easily seen on thevisible image 203. - Figure 12b shows the absorption image which is obtained in the same way as Figure 11B.
- Figure 12c shows a time slice. In both figures 12c and 12b, the
caries region 205 can be easily seen. Figure 12d shows an image which is plotted by plotting the maxima of the electric field for each point of the sample which is irradiated. Theenamel dentine region 201 can be seen. However, thecaries region 205 is very weak and much weaker for that than the time slice shown in Figure 12c. The acquisition time for the time slice can be very fast because it is only necessary to detect the reflected THz for a single point in time. - Figure 13 shows a further image of a tooth. Figure 13a shows a visible image whereas Figure 13b shows a single plot of the THz reflected electric field against time. The THz image is taken along
path 101 of the tooth. There are three strong features in the reflected THz. The first peak 103 is due to reflection of the THz from the enamel/air surface. Thesecond peak 105 is due to reflection of the THz from the enamel/dentine interface e-d in the tooth. The third and weakest reflection is due to the dentine/pulp cavity interface d-p of the tooth. - Figure 14a shows a visible image of a slice of a tooth. The tooth has a
healthy region 109 and adecayed region 111. Figure 14b shows a THz pulse in the time domain measured in thehealthy region 109. Figure 14c shows a THz pulse measured in the time domain for the unhealthy region which is decayed due tocaries 111. Returning to the visible image of the tooth slice in Figure 14a, two interfaces can be seen. The first is the enamel/air interface 113, the second is the enamel/dentine interface 115. In the THz trace, the healthy region twopeaks upper peak 117 is believed to be due to the reflection of the THz at interface 113, thesecond peak 119 is due to the reflection of THz atinterface 115. - In the THz pulse of the unhealthy region, the peak due to the reflection from interface 113 is seen to be of almost the same height as the corresponding peak in Figure 14b.
- However, the second peak which is due to the reflection from
interface 115 is seen to be much smaller. This is because a region of the tooth which is decayed due to caries absorbs THz far more strongly than a region which has not decayed. Hence, less of the THz penetrates as far asinterface 115 and THz which is reflected from this interface is also more strongly absorbed than in the case of healthy teeth. Hence, peak 119 is considerably reduced in the trace of the unhealthy region. - Regardless of whether or not the tooth is healthy, the height of the peak from interface 113 should be identical in both traces b and c. However, due to their different positions on the tooth, possibly dirt on the surface of the tooth, they will almost always be different, therefore, in order to detect the presence of caries, the ratio of
peak heights - This type of analysis does not only apply to teeth. Figure 15 shows a schematic of a healthy area of skin and an unhealthy area of skin. Figure 15b shows the THz pulse which has been reflected from a healthy region of the skin, Figure 15c shows a THz pulse in the time domain which has been reflected from an unhealthy portion of the skin.
- In Figure 15a, a skin/
air interface 121 is shown and a skin/fat interface 123. There is ahealthy area 125 and anunhealthy area 127 which containstumour 129. Figure 15b shows a THz time domain pulse for thehealthy area 125. Thefirst peak 131 is due to reflection frominterface 121. Thesecond peak 133 is due to reflection from skin/fat interface 123. Figure 15c shows a similar trace except here, it is taken inunhealthy region 127. The size ofpeak 131 remains virtually the same. However, the size ofpeak 133 is substantially reduced due to the absorption by thetumour 129. - By plotting the ratio of the reflection from the
first interface 121 to thesecond interface 123, across the skin, the lateral extent of the tumour can be determined as shown in Figure 15d. - It is also possible to obtain information about the depth of a sample using reflection measurement which does not have particularly strongly defined interfaces. Lossy materials, such as biological samples have a relatively large absorption coefficient which dominates how radiation is reflected from the sample.
- Figure 16, shows a THz pulse incident on a sample. The THz pulse propagates in the x-direction and is scattered (reflected) into a counter-propagating, or reflected, pulse by the object.
- To simplify matters, the following analysis will only consider one spatial dimension (x) (i.e. for the case of a collimated THz beam path). It will also be assumed the object is uniform in the y-z plane over the dimensions of the THz beam. Given the 1-D analysis described here to provide information on the structure of the object in the x-direction, the variation of the object in the y-z directions may be obtained by scanning the object through the THz beam in the y-z plane (or, alternatively, scanning the THz beam over the object).
- The analysis can be used to determine both how the absorption and the refractive index spatially varies within the sample. In practice, both the absorption coefficient and the refractive index vary also with frequency. The following analysis assumes that the frequency response of the refractive index is known and also that the absorption coefficient does not vary with frequency.
- Since the electric field due to the reflected THz pulse may only be measured at discrete points in time, all the integral transforms below must be replaced by the appropriate discrete transform in order to operate on the finite dataset.
- The incident and reflected THz pulses are characterised by electric fields T(x,t) and R(x,t) respectively. The quantities in brackets indicate that T and R are both functions of position, x, and time, t. It will be assumed that all electric fields are polarised along a similar axis perpendicular to the x-direction and hence they can be written as scalar quantities (i.e. ignore directional dependence):


where i is the imaginary unit
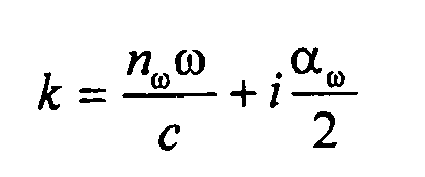
where c is the speed of light in a vacuum, n ω, and αω are the refractive index and absorption coefficients of the object at angular frequency ω. Thus both n ω and αω may be functions of position and frequency. These are the materials parameters which characterise the object. - The propagation and coupling of energy between the incident and reflected waves is described by two, coupled 1st order differential equations (easily derived from Maxwell's Equations):

- The left-hand-sides of the above equations describe the propagation of the two counter-propagating waves. The right-hand-sides provide the 'coupling' terms which transfer energy from one beam to the other in the presence of a scattering potential. In this case, the scattering potential is provided by a spatially varying wave-vector, k. I.e.


- In a lossy, dispersive medium α≠0 and where n ω is frequency dependent.
- It will be assumed that the scattering potential is provided by a spatially varying coefficient, Δ(x) such that


where k' is the spatial average of k and k' is independent of x. (k' remains a function of ω, while Δ is independent of ω). - In order to derive spatial information (i.e. information on how Δ varies with respect to x), it is necessary to know the spectral characteristics of the material in advance (i.e. to know how n ω depends on ω). A functional form of n ω(ω) and also the coefficient α are assumed. For the purposes of imaging, this may be calculated from the spatial average THz reflectivity of the sample (i.e. such that structural information is averaged out). The derivation of the spectral characteristics of a sample by THz reflection has been described elsewhere in the literature and will not be reproduced here.
- For a lossy medium where α/2 >> nω/ c (such as water-based biological media) a Real spatial variation in Δ is due to a spatial variation in the absorption coefficient of the medium. Previously, only a spatial variation in the refractive index have been considered.
- Furthermore, it is assumed that the spatial variation of k is much smaller than the absolute value of k i.e.


where T x=0 is the amplitude of the incident electric field at position x=0 and is a function of ω. - The spatial dependence of the reflected wave may now be described by a single differential equation:
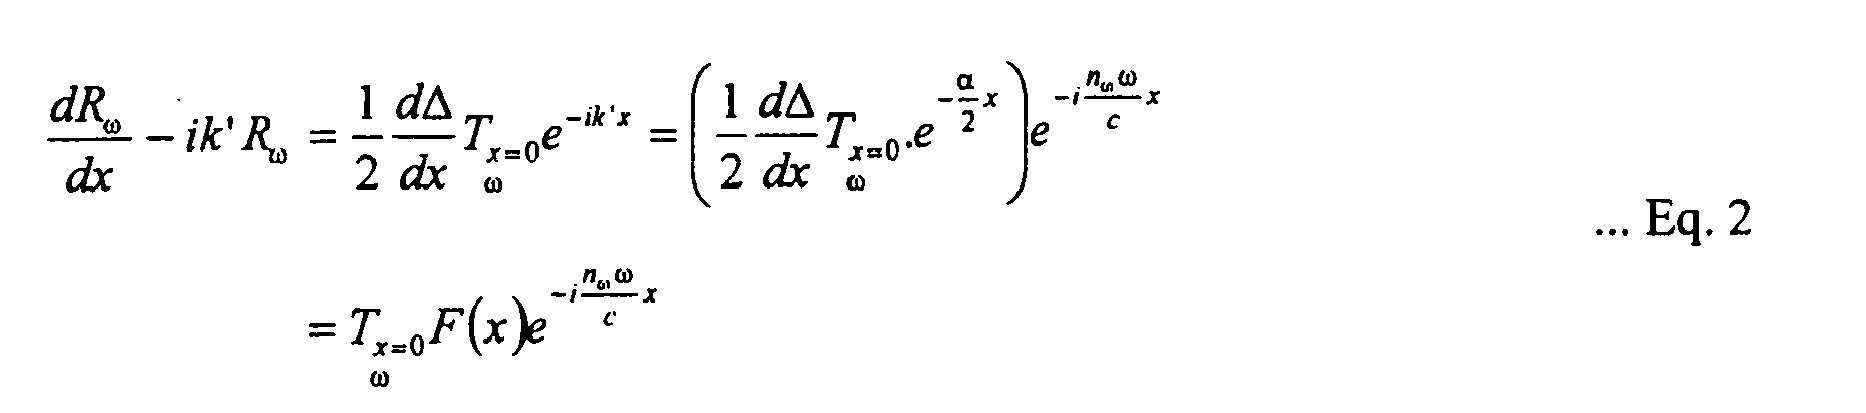

-
Equation 2 may be solved (by the method of Laplace transformation, for example), to obtain R ω :
- Since it is necessary to measure the reflected wave at one point, we set x=0 to get

- This expression may be inverted to obtain F(x) under the assumption that F is independent of

- By inverse Fourier transformation of
Equation 3 we get
- The spatial dependence of the parameter Δ(x) contains the structural information about the object which we are trying to deduce. This is obtained by rearranging
Equation 4 and integrating over the position, x.
- The factor R x=0, ω is obtained by Fourier transform of the measured reflected THz electric field, R(t) (i.e. as measured at point x=0, corresponding to the surface of the medium or sample):

- The factor T x=0, ω is obtained by Fourier transform of a reference THz pulse. The THz reference pulse may be obtained by measuring the THz pulse reflected off a sample of known reflectivity such as a silver mirror, for example. The THz pulse reflected from a silver mirror is an exact replica of the incident THz pulse i.e.

- A similar transformation is performed on T(t):

- In practice, the incident THz pulse must have a finite bandwidth; that is, T x=0. ω will drop below the noise-level of the measurement apparatus at frequencies above some threshold, ωmax. Similarly, T x=0, ω will drop below the measurement noise at frequencies below some minimum threshold, ωmin. In order to exclude artefacts due to noise where T x=0, ω has become small, we included a windowing function W(ω). This function has the property that it drops to zero at both high and low frequencies faster than T x=0, ω.
- For example, we may choose W ω=W(ω) to be a square-pulse function:

- The final result is


-
Equation 6 constitutes the main result. Δ(x) is obtained by numerical evaluation ofEquation 6, once all the constituent factors have been determined. Since Δ is complex either the real or the imaginary part of the function may be plotted to form an image, or some combination. Δ obtained in this way is considered only an approximation to the exact structural form of the sample, in view of the approximations described above. - Figure 17 shows an imaging system which is similar to Figure 1. To avoid unnecessary repetition, like reference numerals will be used to denote like features. A Ti:Sapphire laser system 37 (coherent Reg A9000) operating at a 250 kHz repetition rate is used to provide the input radiation. The radiation is split using
beam splitter 47 to produce aprobe beam 55 and apump beam 39. The pump beam is first directed through a 1 nsdelay line 401. This is a static delay line and is used to make fine adjustments to the path length. The pump beam is then directed into a 150 psscanning delay line 403 having a scanning frequency of 20 Hz. The scanning delay line has a linear-position output so that it is possible to know the position of the delay line when each measurement is taken. The pump beam is then fed through a 64kHz modulator 405 which chops the beam at this frequency in order to provide a frequency for detection using lock-in techniques. - The
pump beam 39 is then directed ontoGaAs antenna 407. The antenna is biased to 1.1 kV and average powers of over I nW are generator. Thepump beam 39 power delivered to the antenna is 1 to 2 µJ. Such antennas are described in detail in J.T. Darrow and B.B. Hu and X.-C. Zhang and D.H. Auston 1990, Optics Lett., 15(6), pages 323-5, Z.G. Lu and P.Campbell and X.-C. Zhang, 1997 Appl. Phys. Lett., 71(5), pages 593-5, and G. Mouret and W. Chen and D. Boucher and R. Bocquet and P Mounaix and D. Theron and D. Lippens, 1998, Microwave and optical technol. lett., 17(1), pages 23-7. In the specific antenna of this example, an acrylic anti-corona coating is used and a 100 KΩ series resistor to suppress dielectric breakdown of the device and to reduce power-dissipation in the GaAs. The emitted THz pulses are guided fromantenna 407 via off-axisparabolic mirror 409 ontosample 411. The reflected radiation from the sample is then collected viaparabolic mirror 413 and directed intodetector 35. The detector is of the EOS type described with reference to Figure 3. In the specific example of Figure 17, the reflected THz beam is directed onto 1mm thick ZnTe crystal coiinearly with theprobe beam 55. - Where non-planar soft materials, for example, human skin are measured, a quartz window is used in order to flatten the skin to improve the image.
- Figure 18a shows a typical plot of THz signal (arbitrary units) against delay time of the optical pulse (measured by the 150 ps scanning delay line) which can be obtained using the apparatus of Figure 17. The smaller oscillations after the main pulse are due to atmospheric water-vapour absorption and dispersion in the THz beam path. A small signal can be seen at 10 ps after the main pulse due to back-reflections from the GaAs antenna substrate. The signal-to-noise ratio for a typical THz waveform (measured with a metallic mirror in place of a sample) is greater than 6000 to 1 for a single delay line scan. This typically has an acquisition time of 50 ms.
- The bandwidth envelope which is obtained from Fourier transforming the time domain waveform of Figure 18a is shown in Figure 18b. Figure 18b actually shows the THz power spectrum. The spectrum peaks at 300 GHz with useful power to over 3 THz. The large THz throughput of the system allows the acquisition time for 3D data sets to be reduced to just a few minutes.
- Figure 19 is a schematic of the outermost layers of human skin. The stratum corneum 421 being the outermost layer, the middle layer is the epidermis 423 and the innermost layer of interest in these experiments is the dermis layer 425. When a single THz pulse 427 is reflected from the skin, multiple reflections due to the stratum corneum/air interface 429, stratum corneum/epidermis interface 431 and the epidermis/dermis interface 433. The signal from each of these interfaces can be seen in the output pulse 435.
- The data shown in Figures 20 to 25 is taken from the human arm shown in Figure 20. Point a indicates the centre inside forum, point b indicates the inside wrist, point c indicates the palm of the hand, point d indicates the side of the hand and point e indicates the second fingertip. THz radiation is non-ionising and low average powers are used (typically 1 mW). Therefore, brief exposure to it is not thought to be hazardous.
- Figure 21 a shows a time domain THz waveform obtained from point a on Figure 20. The time domain waveform has been processed in order to remove some unwanted artefacts. The oscillations following the main pulse due to atmospheric water removed by deconvolving the data set with the reference pulse waveform obtained in the absence of the sample. The data set is also spectrally filtered to remove out of band noise by applying a band pass filter with pass band adjusted to match that of the reference pulse.
- In Figure 21a, the data for point a is shown as a solid line. This is compared with a dashed line which shows data for air (measured in absence of sample) and a dotted line which shows the waveform obtained from a pure water sample.
- The THz waveform in the absence of the sample (dashed line) shows a gaussian pulse corresponding to reflection from the top surface of the window (window-air interface). The width of this gaussian indicates the temporal resolution obtainable with the technology as determined by the band width of the THz pulse.
- The waveform obtained from water is opposite in polarity to the no-sample case as expected for a reflection from a higher refractive-index dielectric. After the initial transient, water displays a damped decay back to zero over a period of 1 to 2 ps.
- The THz waveform of the forearm from point a displays a positive peak at zero optical delay corresponding to the presence of the relatively dehydrated stratum corneum layer. For delay values greater than this, the THz waveform appears to be substantially similar to that for water. This indicates that there is a high water content in the upper dermal layer. The bandwidth of the system is efficient to a depth resolution of about 40 µm into the skin. The stratum corneum of the forearm is typically 10 to 20 µm. The positive peak can be taken as a measure of the dehydration volume of the stratum corneum. The stratum corneum thickness cannot be distinguished from the dehydration level in this case.
- Figure 21b shows a process waveform for skin at point a (solid line), point b (dashed line) and point c (dotted line). There is little reproducible difference between the scans for the forearm and the wrist. However, the palm gives significantly different results. In this case, there is a differential feature due to reflection of the stratum corium surface followed, at a longer delay time by a broader negative transient due to the stratum corneum-epidermis interface. This transient displays the damp decay to zero expected for the water-like epidermis. The stratum corneum has a thickness from 100 to 150 µm on the palm of the hand which is thick enough for its inner and outer boundaries to be separated.
- Figure 22a and b show images obtained by raster scanning a 1 cm by 1 cm area of the side of the subject's hand (point d) in Figure 20.
- Figure 22a is generated by plotting the peak value of the processed THz waveform corresponding to the outside surface of the stratum corneum along the z axis (i.e. out of the palm) across the whole 1 cm by 1 cm area). Typical features of the skin surface (lines, wrinkles etc) are evident. Figure 22b shows essentially a time slice image where the THz waveform values at a time delay corresponding to the stratum comeumepidermis interface are plotted. This allows variations in the stratum corneum thickness over the scanned area to be seen. (Low x values are towards the palm side of the hand while the higher values are towards the back-side).
- In the data of both Figure 22a and Figure 22b, the reflected THz waveforms are acquired over a spatial interval of 3 waveforms per millimetre along the two axis. This is roughly equivalent to the diffraction limited resolution achievable in this frequency regime. Figures 23a and 23b show slices through a 3D data set. The grey scale indicates the THz amplitude and is plotted against optical delay (vertical access) and x position across the horizontal axis. A depth calibration is obtained from the optical delay time based on an assumed refractive index of n=2 for skin tissues over the THz regime. The figures indicate the stratum comeum/epidermis interface and also the stratum corneum surface. Figure 23a is taken at point c whereas Figure 23b is taken at point d.
- The sensitivity of THz towards absorption is shown in Figure 24a. Here, the reflective parts from the forearm of Figure 20 were measured before and at intervals after hydrating the stratum corneum by application of water-soaked gauze. Trace "a" shows a THz signal prior to removal of the gauze, trace "b" shows the signal immediately after removal of the gauze. Here, it can be seen that the THz waveform is strongly suppressed at zero optical delay indicating near-saturated hydration of the stratum corneum and traces "c" to "e" show the same measurement five minutes, ten minutes and fifteen minutes respectively after removal of the gauze. The soaked region of skin is exposed to an ambient atmosphere (23°C). The zero-delay peak covers over a characteristic time of 15 minutes. It is interesting to note that although the positive peak covers after initial hydration, the following minimum is first reduced in depth by hydration and subsequently increases to become more negative than before hydration.
- Figure 24b shows the change in the hydration level of the stratum corium produced by application of 60 milligrams of 10% glycerine solution. The dotted line indicates the waveform before the glycerine is applied. The solid line shows the
waveform 8 minutes after application of the solution. The upper trace for point "c" (palm) whereas the lower trace is for point "a" (forearm). - The forearm for glycerine results display the same suppression of the zero-delay peak as those achieved using pure water. Actually, the zero-delay peak appears more strongly suppressed than in the pure water case after five minutes drying time. Indicating the improved retention of water in the presence of glycerine. Little change is seen in the hydration level of the palm. However, small changes in the features of a later time delay can be seen.
- Figure 25a illustrates the effect of occlusion of the stratum corneum interface by the quartz window. Here, THz measurements were made at 45 second intervals over a 15 minute period with the skin in continuous contact with quartz. The scans are offset from one another along the x axis with the later most times to the right. The size of the zero-delay peak decreases with an exponential decay form.
- The peak-to-peak values for each waveform is plotted as a function of time in Figure 25b. An exponential decay is fitted to the data. It was found that the time-constant for the decay is 3.1 minutes.
Claims (7)
- A method of imaging a sample (41), the method comprising the steps of:irradiating a sample (41) with a pulse of electromagnetic radiation (39), said pulse having a plurality of frequencies in the range from 25 GHz to 100 THz; anddetecting the amplitude of the radiation reflected from or transmitted by the sample (41); characterised in that the method further comprises:generating an image of sample (41) using the amplitude of the radiation detected at a single point in time.
- A method according to claim 1, wherein the amplitude of the radiation is detected for a period of time, and the image is generated for a single time point.
- A method according to claim 2, wherein the step of generating the image comprises the step of generating a plurality of images for a plurality of different time points.
- A method according to claim 3, further comprising the step of optimising the contrast of the image generated using time points as an optimising parameter.
- A method according to claim 1, wherein the radiation is only detected for a single time point.
- An apparatus for generating an image of a sample (41), the apparatus comprising:means (31) for irradiating a sample (41) with a pulse of electromagnetic radiation (39), said pulse having a plurality of frequencies in the range from 25 GHz to 100 THz; andmeans (35) for detecting the amplitude of the radiation reflected from or transmitted by the sample (41); characterised in that the apparatus further comprises:means (36) for generating an image of sample using the amplitude of the radiation detected at a single point in time.
- An apparatus according to claim 6, the apparatus further comprising means (36) for displaying a plurality of images generated from different time points.
Applications Claiming Priority (3)
| Application Number | Priority Date | Filing Date | Title |
|---|---|---|---|
| GB0005225 | 2000-03-03 | ||
| GB0005225A GB2360186B (en) | 2000-03-03 | 2000-03-03 | Apparatus and method for investigating a sample |
| PCT/GB2001/000956 WO2001065240A1 (en) | 2000-03-03 | 2001-03-05 | Imaging apparatus and method |
Publications (2)
| Publication Number | Publication Date |
|---|---|
| EP1259795A1 EP1259795A1 (en) | 2002-11-27 |
| EP1259795B1 true EP1259795B1 (en) | 2006-11-22 |
Family
ID=9886960
Family Applications (1)
| Application Number | Title | Priority Date | Filing Date |
|---|---|---|---|
| EP01909982A Expired - Lifetime EP1259795B1 (en) | 2000-03-03 | 2001-03-05 | Imaging apparatus and method |
Country Status (8)
| Country | Link |
|---|---|
| US (1) | US10076261B2 (en) |
| EP (1) | EP1259795B1 (en) |
| JP (1) | JP2003525447A (en) |
| AT (1) | ATE346286T1 (en) |
| AU (1) | AU2001237568A1 (en) |
| DE (1) | DE60124676T2 (en) |
| GB (3) | GB2372930B (en) |
| WO (1) | WO2001065240A1 (en) |
Cited By (1)
| Publication number | Priority date | Publication date | Assignee | Title |
|---|---|---|---|---|
| RU2800077C1 (en) * | 2022-08-15 | 2023-07-18 | Федеральное государственное автономное образовательное учреждение высшего образования "Национальный исследовательский Томский государственный университет" | Method and device of determining human psychophysiological state |
Families Citing this family (121)
| Publication number | Priority date | Publication date | Assignee | Title |
|---|---|---|---|---|
| GB0122052D0 (en) * | 2001-09-12 | 2001-10-31 | Teraview Ltd | Imaging apparatus and method |
| JP2005504959A (en) * | 2001-09-12 | 2005-02-17 | テラビュー リミテッド | Image processing apparatus and method |
| US7505811B2 (en) | 2001-11-19 | 2009-03-17 | Dune Medical Devices Ltd. | Method and apparatus for examining tissue for predefined target cells, particularly cancerous cells, and a probe useful in such method and apparatus |
| US6813515B2 (en) * | 2002-01-04 | 2004-11-02 | Dune Medical Devices Ltd. | Method and system for examining tissue according to the dielectric properties thereof |
| US8116845B2 (en) | 2005-08-04 | 2012-02-14 | Dune Medical Devices Ltd. | Tissue-characterization probe with effective sensor-to-tissue contact |
| GB2385415B (en) | 2002-02-15 | 2005-09-14 | Teraview Ltd | An analysis apparatus and method |
| GB2397207B (en) | 2003-01-10 | 2005-04-13 | Teraview Ltd | Imaging techniques and associated apparatus |
| US6909094B2 (en) | 2003-02-12 | 2005-06-21 | Philip Norris Usa Inc. | System and method for terahertz imaging using a single terahertz detector |
| WO2004075782A2 (en) * | 2003-02-26 | 2004-09-10 | Alfred, E. Mann Institute For Biomedical Engineering At The University Of Southern California | An implantable device with sensors for differential monitoring of internal condition |
| DE10309845A1 (en) * | 2003-03-06 | 2004-09-16 | Albert-Ludwigs-Universität Freiburg | Non-contact identification of a chemical substance, in a letter envelope or other package, uses an electromagnetic beam directed at the sample for the absorption spectrum to be measured and compared with a reference |
| JP2004286716A (en) * | 2003-03-25 | 2004-10-14 | Institute Of Physical & Chemical Research | Target discriminating method and apparatus by terahertz wave spectrometry |
| GB2402471B (en) | 2003-06-02 | 2006-01-18 | Teraview Ltd | An analysis method and apparatus |
| GB2405466B (en) | 2003-08-27 | 2006-01-25 | Teraview Ltd | Method and apparatus for investigating a non-planner sample |
| JP4209765B2 (en) * | 2003-12-26 | 2009-01-14 | 潤一 西澤 | Terahertz wave imaging device |
| US20100160774A1 (en) * | 2004-03-17 | 2010-06-24 | Ali Dabiri | Method and apparatus for non-invasive cancerous tissue diagnosis and tomography using terahertz imaging |
| US7643869B1 (en) * | 2004-03-17 | 2010-01-05 | Dabiri Ali E | Apparatus for non-invasive cancerous tissue diagnosis and tomography using terahertz imaging |
| US7904145B2 (en) | 2004-03-23 | 2011-03-08 | Dune Medical Devices Ltd. | Clean margin assessment tool |
| US9750425B2 (en) | 2004-03-23 | 2017-09-05 | Dune Medical Devices Ltd. | Graphical user interfaces (GUI), methods and apparatus for data presentation |
| JP4620959B2 (en) * | 2004-03-26 | 2011-01-26 | キヤノン株式会社 | Biological information monitor device |
| GB2414294B (en) * | 2004-05-20 | 2006-08-02 | Teraview Ltd | Apparatus and method for investigating a sample |
| EP1749201A1 (en) | 2004-05-26 | 2007-02-07 | Picometrix, LLC | Terahertz imaging in reflection and transmission mode for luggage and personnel inspection |
| CN101076295A (en) * | 2004-08-13 | 2007-11-21 | 生物激光科技公司 | Magnolia detection using the time difference between exciting pulse and return pulse |
| GB2418337B (en) * | 2004-09-17 | 2008-07-16 | Tera View Ltd | An imaging apparatus and method |
| US7991242B2 (en) | 2005-05-11 | 2011-08-02 | Optosecurity Inc. | Apparatus, method and system for screening receptacles and persons, having image distortion correction functionality |
| US20090174554A1 (en) | 2005-05-11 | 2009-07-09 | Eric Bergeron | Method and system for screening luggage items, cargo containers or persons |
| KR20070034169A (en) * | 2005-09-23 | 2007-03-28 | 삼성전자주식회사 | Apparatus and method for measuring blood component concentration using terahertz wave |
| US20070184402A1 (en) * | 2006-01-03 | 2007-08-09 | Dmitri Boutoussov | Caries detection using real-time imaging and multiple excitation frequencies |
| GB0718706D0 (en) | 2007-09-25 | 2007-11-07 | Creative Physics Ltd | Method and apparatus for reducing laser speckle |
| US7899232B2 (en) | 2006-05-11 | 2011-03-01 | Optosecurity Inc. | Method and apparatus for providing threat image projection (TIP) in a luggage screening system, and luggage screening system implementing same |
| US8494210B2 (en) | 2007-03-30 | 2013-07-23 | Optosecurity Inc. | User interface for use in security screening providing image enhancement capabilities and apparatus for implementing same |
| DE102006042642B4 (en) * | 2006-09-12 | 2010-06-24 | Batop Gmbh | Terahertz time-domain spectrometer |
| EP1935337A1 (en) * | 2006-12-21 | 2008-06-25 | Nederlandse Organisatie voor toegepast- natuurwetenschappelijk onderzoek TNO | An electromagnetic imaging system, a method and a computer program product |
| GB2465896B (en) | 2007-01-29 | 2011-12-07 | Teraview Ltd | A pharmaceutical analysis method and apparatus |
| JP2008197080A (en) * | 2007-02-15 | 2008-08-28 | Tohoku Univ | Caries detection method and apparatus |
| US8147423B2 (en) | 2007-03-01 | 2012-04-03 | Dune Medical Devices, Ltd. | Tissue-characterization system and method |
| US7897924B2 (en) * | 2007-04-12 | 2011-03-01 | Imra America, Inc. | Beam scanning imaging method and apparatus |
| US7641343B1 (en) * | 2007-07-26 | 2010-01-05 | Motamedi Manouchehr E | Method and apparatus for early diagnosis of Alzheimer's using non-invasive eye tomography by terahertz |
| GB0818775D0 (en) | 2008-10-13 | 2008-11-19 | Isis Innovation | Investigation of physical properties of an object |
| JP6053284B2 (en) * | 2009-02-04 | 2016-12-27 | ザ ジェネラル ホスピタル コーポレイション | Apparatus and method for use of a high speed optical wavelength tuning source |
| US11726332B2 (en) | 2009-04-27 | 2023-08-15 | Digilens Inc. | Diffractive projection apparatus |
| US9335604B2 (en) | 2013-12-11 | 2016-05-10 | Milan Momcilo Popovich | Holographic waveguide display |
| US11300795B1 (en) | 2009-09-30 | 2022-04-12 | Digilens Inc. | Systems for and methods of using fold gratings coordinated with output couplers for dual axis expansion |
| US11320571B2 (en) | 2012-11-16 | 2022-05-03 | Rockwell Collins, Inc. | Transparent waveguide display providing upper and lower fields of view with uniform light extraction |
| US10795160B1 (en) | 2014-09-25 | 2020-10-06 | Rockwell Collins, Inc. | Systems for and methods of using fold gratings for dual axis expansion |
| US8233204B1 (en) | 2009-09-30 | 2012-07-31 | Rockwell Collins, Inc. | Optical displays |
| US8659826B1 (en) | 2010-02-04 | 2014-02-25 | Rockwell Collins, Inc. | Worn display system and method without requiring real time tracking for boresight precision |
| DE102010010285B4 (en) * | 2010-03-04 | 2012-03-22 | Technische Universität Carolo-Wilhelmina Zu Braunschweig | Sample analysis using terahertz spectroscopy |
| DE102010032382A1 (en) | 2010-07-27 | 2012-02-02 | Batop Gmbh | Fiber-coupled terahertz time domain spectrometer has pulse laser that uses transmitting antenna and receiving antenna, where both antennas are assigned with collimating terahertz optics in each case |
| US9274349B2 (en) | 2011-04-07 | 2016-03-01 | Digilens Inc. | Laser despeckler based on angular diversity |
| JP5710355B2 (en) * | 2011-04-18 | 2015-04-30 | 株式会社東芝 | Inspection apparatus and inspection method using terahertz waves |
| JP5300915B2 (en) * | 2011-05-12 | 2013-09-25 | 株式会社アドバンテスト | Electromagnetic wave measuring apparatus, measuring method, program, recording medium |
| EP2995986B1 (en) | 2011-08-24 | 2017-04-12 | Rockwell Collins, Inc. | Data display |
| WO2016020630A2 (en) | 2014-08-08 | 2016-02-11 | Milan Momcilo Popovich | Waveguide laser illuminator incorporating a despeckler |
| US10670876B2 (en) | 2011-08-24 | 2020-06-02 | Digilens Inc. | Waveguide laser illuminator incorporating a despeckler |
| ES2675308T3 (en) | 2011-09-07 | 2018-07-10 | Rapiscan Systems, Inc. | X-ray inspection system that integrates manifest data with imaging / detection processing |
| GB201116518D0 (en) | 2011-09-23 | 2011-11-09 | Isis Innovation | Investigation of physical properties of an object |
| US9715067B1 (en) | 2011-09-30 | 2017-07-25 | Rockwell Collins, Inc. | Ultra-compact HUD utilizing waveguide pupil expander with surface relief gratings in high refractive index materials |
| US8634139B1 (en) | 2011-09-30 | 2014-01-21 | Rockwell Collins, Inc. | System for and method of catadioptric collimation in a compact head up display (HUD) |
| US9599813B1 (en) | 2011-09-30 | 2017-03-21 | Rockwell Collins, Inc. | Waveguide combiner system and method with less susceptibility to glare |
| US9366864B1 (en) | 2011-09-30 | 2016-06-14 | Rockwell Collins, Inc. | System for and method of displaying information without need for a combiner alignment detector |
| JP5749628B2 (en) * | 2011-10-27 | 2015-07-15 | 株式会社東芝 | Inspection apparatus using terahertz wave and inspection method |
| WO2013102759A2 (en) | 2012-01-06 | 2013-07-11 | Milan Momcilo Popovich | Contact image sensor using switchable bragg gratings |
| JP2013174548A (en) * | 2012-02-27 | 2013-09-05 | Otsuka Denshi Co Ltd | Measuring instrument and measuring method |
| US9228878B2 (en) * | 2012-03-19 | 2016-01-05 | Advanced Energy Industries, Inc. | Dual beam non-contact displacement sensor |
| JP2013195176A (en) | 2012-03-19 | 2013-09-30 | Canon Inc | Electromagnetic wave pulse measuring device, electromagnetic wave pulse measuring method, and application device using electromagnetic wave pulse measuring device |
| US9523852B1 (en) | 2012-03-28 | 2016-12-20 | Rockwell Collins, Inc. | Micro collimator system and method for a head up display (HUD) |
| WO2013163347A1 (en) | 2012-04-25 | 2013-10-31 | Rockwell Collins, Inc. | Holographic wide angle display |
| US9933684B2 (en) | 2012-11-16 | 2018-04-03 | Rockwell Collins, Inc. | Transparent waveguide display providing upper and lower fields of view having a specific light output aperture configuration |
| DE102012023947B4 (en) | 2012-12-03 | 2016-11-24 | Leibniz-Institut für Photonische Technologien e. V. | Method and device for the non-invasive, nondestructive identification of bird embryo sexes through the bird shells |
| US20140198195A1 (en) * | 2013-01-17 | 2014-07-17 | Electronics And Telecommunications Research Institute | Terahertz health checker |
| CN103169450B (en) * | 2013-03-08 | 2014-12-10 | 深圳先进技术研究院 | Terahertz (THz) needle movement all-in-one machine |
| US9674413B1 (en) | 2013-04-17 | 2017-06-06 | Rockwell Collins, Inc. | Vision system and method having improved performance and solar mitigation |
| US9727772B2 (en) | 2013-07-31 | 2017-08-08 | Digilens, Inc. | Method and apparatus for contact image sensing |
| JP6245600B2 (en) * | 2013-08-30 | 2017-12-13 | 国立研究開発法人物質・材料研究機構 | Polarization sensitive terahertz wave detector |
| US9244281B1 (en) | 2013-09-26 | 2016-01-26 | Rockwell Collins, Inc. | Display system and method using a detached combiner |
| US10732407B1 (en) | 2014-01-10 | 2020-08-04 | Rockwell Collins, Inc. | Near eye head up display system and method with fixed combiner |
| US9519089B1 (en) | 2014-01-30 | 2016-12-13 | Rockwell Collins, Inc. | High performance volume phase gratings |
| US9244280B1 (en) | 2014-03-25 | 2016-01-26 | Rockwell Collins, Inc. | Near eye display system and method for display enhancement or redundancy |
| US10359736B2 (en) | 2014-08-08 | 2019-07-23 | Digilens Inc. | Method for holographic mastering and replication |
| US10241330B2 (en) | 2014-09-19 | 2019-03-26 | Digilens, Inc. | Method and apparatus for generating input images for holographic waveguide displays |
| US10088675B1 (en) | 2015-05-18 | 2018-10-02 | Rockwell Collins, Inc. | Turning light pipe for a pupil expansion system and method |
| US9715110B1 (en) | 2014-09-25 | 2017-07-25 | Rockwell Collins, Inc. | Automotive head up display (HUD) |
| EP3245444B1 (en) | 2015-01-12 | 2021-09-08 | DigiLens Inc. | Environmentally isolated waveguide display |
| US9632226B2 (en) | 2015-02-12 | 2017-04-25 | Digilens Inc. | Waveguide grating device |
| US11366316B2 (en) | 2015-05-18 | 2022-06-21 | Rockwell Collins, Inc. | Head up display (HUD) using a light pipe |
| US10126552B2 (en) | 2015-05-18 | 2018-11-13 | Rockwell Collins, Inc. | Micro collimator system and method for a head up display (HUD) |
| US10247943B1 (en) | 2015-05-18 | 2019-04-02 | Rockwell Collins, Inc. | Head up display (HUD) using a light pipe |
| US10108010B2 (en) | 2015-06-29 | 2018-10-23 | Rockwell Collins, Inc. | System for and method of integrating head up displays and head down displays |
| CN113759555B (en) | 2015-10-05 | 2024-09-20 | 迪吉伦斯公司 | Waveguide Display |
| US10598932B1 (en) | 2016-01-06 | 2020-03-24 | Rockwell Collins, Inc. | Head up display for integrating views of conformally mapped symbols and a fixed image source |
| EP3772702A3 (en) | 2016-02-22 | 2021-05-19 | Rapiscan Systems, Inc. | Methods for processing radiographic images |
| WO2017162999A1 (en) | 2016-03-24 | 2017-09-28 | Popovich Milan Momcilo | Method and apparatus for providing a polarization selective holographic waveguide device |
| US10890707B2 (en) | 2016-04-11 | 2021-01-12 | Digilens Inc. | Holographic waveguide apparatus for structured light projection |
| DE102016105599A1 (en) * | 2016-04-14 | 2017-10-19 | Inoex Gmbh | Terahertz measuring device for the measurement of test objects and a terahertz measuring method |
| EP3548939A4 (en) | 2016-12-02 | 2020-11-25 | DigiLens Inc. | WAVE GUIDE DEVICE WITH UNIFORM OUTPUT LIGHTING |
| WO2018129398A1 (en) | 2017-01-05 | 2018-07-12 | Digilens, Inc. | Wearable heads up displays |
| US10295824B2 (en) | 2017-01-26 | 2019-05-21 | Rockwell Collins, Inc. | Head up display with an angled light pipe |
| GB2559164B (en) * | 2017-01-27 | 2021-11-10 | Teraview Ltd | Method and system for measuring coating thicknesses |
| US10942430B2 (en) | 2017-10-16 | 2021-03-09 | Digilens Inc. | Systems and methods for multiplying the image resolution of a pixelated display |
| KR20250004154A (en) | 2018-01-08 | 2025-01-07 | 디지렌즈 인코포레이티드. | Methods for fabricating optical waveguides |
| US20190212588A1 (en) | 2018-01-08 | 2019-07-11 | Digilens, Inc. | Systems and Methods for Manufacturing Waveguide Cells |
| US10914950B2 (en) | 2018-01-08 | 2021-02-09 | Digilens Inc. | Waveguide architectures and related methods of manufacturing |
| US10732569B2 (en) | 2018-01-08 | 2020-08-04 | Digilens Inc. | Systems and methods for high-throughput recording of holographic gratings in waveguide cells |
| WO2020023779A1 (en) | 2018-07-25 | 2020-01-30 | Digilens Inc. | Systems and methods for fabricating a multilayer optical structure |
| KR102075356B1 (en) * | 2018-08-27 | 2020-02-10 | 한양대학교 산학협력단 | Specimen thickness measuring device and Specimen Thickness Measuring Method |
| WO2020149956A1 (en) | 2019-01-14 | 2020-07-23 | Digilens Inc. | Holographic waveguide display with light control layer |
| US20200247017A1 (en) | 2019-02-05 | 2020-08-06 | Digilens Inc. | Methods for Compensating for Optical Surface Nonuniformity |
| CN113692544B (en) | 2019-02-15 | 2025-04-22 | 迪吉伦斯公司 | Method and apparatus for providing holographic waveguide displays using integrated gratings |
| US20220283377A1 (en) | 2019-02-15 | 2022-09-08 | Digilens Inc. | Wide Angle Waveguide Display |
| US20200292745A1 (en) | 2019-03-12 | 2020-09-17 | Digilens Inc. | Holographic Waveguide Backlight and Related Methods of Manufacturing |
| CN114207492A (en) | 2019-06-07 | 2022-03-18 | 迪吉伦斯公司 | Waveguide with transmission grating and reflection grating and method for producing the same |
| US11681143B2 (en) | 2019-07-29 | 2023-06-20 | Digilens Inc. | Methods and apparatus for multiplying the image resolution and field-of-view of a pixelated display |
| KR102775783B1 (en) | 2019-08-29 | 2025-02-28 | 디지렌즈 인코포레이티드. | Vacuum grid and method for manufacturing the same |
| CN112212984B (en) * | 2020-09-30 | 2022-11-01 | 上海理工大学 | A modulation and demodulation method for improving the sensitivity of terahertz passive imaging unit |
| US11692883B2 (en) | 2020-10-28 | 2023-07-04 | Advanced Energy Industries, Inc. | Fiber optic temperature probe |
| WO2022150841A1 (en) | 2021-01-07 | 2022-07-14 | Digilens Inc. | Grating structures for color waveguides |
| EP4288831A4 (en) | 2021-03-05 | 2025-01-15 | Digilens Inc. | EVACUATED PERIODIC STRUCTURES AND THEIR MANUFACTURING PROCESSES |
| US20230172475A1 (en) * | 2021-12-06 | 2023-06-08 | Ian Petro | System and method for the detection of dental anomalies using millimeter wave antenna |
| EP4475750A4 (en) * | 2022-03-10 | 2025-08-06 | Univ Nat Tsing Hua | SCANNING-BASED THZ NEAR-FIELD IMAGING DEVICE |
| CN114587586B (en) * | 2022-03-21 | 2022-11-11 | 黄伟 | Noninvasive layered display equipment and system for dental injury and dental pulp injury |
| GB2617330B (en) | 2022-03-31 | 2024-10-16 | Teraview Ltd | Method, system and sensor for analysing a sample, and process for manufacturing an electrode |
Family Cites Families (11)
| Publication number | Priority date | Publication date | Assignee | Title |
|---|---|---|---|---|
| EP0299465B1 (en) * | 1987-07-14 | 1993-09-29 | Hamamatsu Photonics K.K. | An apparatus for sampling, analyzing and displaying an electrical signal |
| US5413098A (en) * | 1991-12-24 | 1995-05-09 | Sextant Medical Corporation | Path constrained spectrophotometer and method for determination of spatial distribution of light or other radiation scattering and absorbing substances in a radiation scattering medium |
| US5623145A (en) * | 1995-02-15 | 1997-04-22 | Lucent Technologies Inc. | Method and apparatus for terahertz imaging |
| US5710430A (en) * | 1995-02-15 | 1998-01-20 | Lucent Technologies Inc. | Method and apparatus for terahertz imaging |
| US5789750A (en) * | 1996-09-09 | 1998-08-04 | Lucent Technologies Inc. | Optical system employing terahertz radiation |
| US5939721A (en) * | 1996-11-06 | 1999-08-17 | Lucent Technologies Inc. | Systems and methods for processing and analyzing terahertz waveforms |
| US6078047A (en) * | 1997-03-14 | 2000-06-20 | Lucent Technologies Inc. | Method and apparatus for terahertz tomographic imaging |
| US6208886B1 (en) * | 1997-04-04 | 2001-03-27 | The Research Foundation Of City College Of New York | Non-linear optical tomography of turbid media |
| US6356349B1 (en) * | 1998-07-10 | 2002-03-12 | Massachusetts Institute Of Technology | Polariton wave imaging |
| JP2004500546A (en) * | 1999-06-04 | 2004-01-08 | テラビュー リミテッド | 3D image formation |
| EP1242808A4 (en) * | 1999-12-28 | 2004-03-17 | Picometrix Inc | System and method for monitoring changes in state of matter with terahertz radiation |
-
2000
- 2000-03-03 GB GB0207462A patent/GB2372930B/en not_active Expired - Fee Related
- 2000-03-03 GB GB0005225A patent/GB2360186B/en not_active Expired - Fee Related
- 2000-03-03 GB GB0207459A patent/GB2372929B/en not_active Expired - Fee Related
-
2001
- 2001-03-05 AU AU2001237568A patent/AU2001237568A1/en not_active Abandoned
- 2001-03-05 EP EP01909982A patent/EP1259795B1/en not_active Expired - Lifetime
- 2001-03-05 WO PCT/GB2001/000956 patent/WO2001065240A1/en not_active Ceased
- 2001-03-05 JP JP2001563889A patent/JP2003525447A/en active Pending
- 2001-03-05 AT AT01909982T patent/ATE346286T1/en not_active IP Right Cessation
- 2001-03-05 US US10/220,717 patent/US10076261B2/en not_active Expired - Fee Related
- 2001-03-05 DE DE60124676T patent/DE60124676T2/en not_active Expired - Fee Related
Cited By (1)
| Publication number | Priority date | Publication date | Assignee | Title |
|---|---|---|---|---|
| RU2800077C1 (en) * | 2022-08-15 | 2023-07-18 | Федеральное государственное автономное образовательное учреждение высшего образования "Национальный исследовательский Томский государственный университет" | Method and device of determining human psychophysiological state |
Also Published As
| Publication number | Publication date |
|---|---|
| DE60124676D1 (en) | 2007-01-04 |
| GB2360186A (en) | 2001-09-12 |
| GB2372930B (en) | 2003-03-19 |
| GB2360186B (en) | 2003-05-14 |
| WO2001065240A1 (en) | 2001-09-07 |
| DE60124676T2 (en) | 2007-09-13 |
| GB0005225D0 (en) | 2000-04-26 |
| JP2003525447A (en) | 2003-08-26 |
| GB2372929B (en) | 2003-03-12 |
| ATE346286T1 (en) | 2006-12-15 |
| GB0207462D0 (en) | 2002-05-08 |
| GB2372929A (en) | 2002-09-04 |
| US20030149346A1 (en) | 2003-08-07 |
| AU2001237568A1 (en) | 2001-09-12 |
| GB2372930A (en) | 2002-09-04 |
| US10076261B2 (en) | 2018-09-18 |
| EP1259795A1 (en) | 2002-11-27 |
| GB0207459D0 (en) | 2002-05-08 |
Similar Documents
| Publication | Publication Date | Title |
|---|---|---|
| US10076261B2 (en) | Imaging apparatus and method | |
| Cole et al. | Terahertz imaging and spectroscopy of human skin in vivo | |
| US7335883B2 (en) | Imaging apparatus and method | |
| Woodward et al. | Terahertz pulse imaging in reflection geometry of human skin cancer and skin tissue | |
| US7693571B2 (en) | Method and apparatus for terahertz imaging | |
| Pickwell et al. | In vivo study of human skin using pulsed terahertz radiation | |
| US7214940B2 (en) | Apparatus and method for investigating a sample | |
| Berry et al. | Optical properties of tissue measured using terahertz-pulsed imaging | |
| Fitzgerald et al. | An introduction to medical imaging with coherent terahertz frequency radiation | |
| US6605808B2 (en) | Diagnostic apparatus using terahertz radiation | |
| Ferguson et al. | Identification of biological tissue using chirped probe THz imaging | |
| Woodward et al. | Terahertz pulse imaging in reflection geometry of skin tissue using time-domain analysis techniques | |
| US6078047A (en) | Method and apparatus for terahertz tomographic imaging | |
| Baughman et al. | Observation of hydrofluoric acid burns on osseous tissues by means of terahertz spectroscopic imaging | |
| Beard et al. | Progress towards two-dimensional biomedical imaging with THz spectroscopy | |
| GB2359619A (en) | Investigating a sample by exciting terahertz radiaition within a sample and detecting the effect using a probe beam | |
| GB2347835A (en) | Terahertz radiation imaging | |
| GB2380920A (en) | Terahertz radiation imaging | |
| Shon et al. | High speed terahertz pulse imaging in the reflection geometry and image quality enhancement by digital image processing | |
| JP2006090863A (en) | Component analysis method and specimen identification method | |
| Sudworth et al. | The optical properties of human tissue at terahertz frequencies | |
| Karagoz et al. | Terahertz pulsed imaging for the monitoring of dental caries: a comparison with x-ray imaging | |
| Zhang | T-ray computed tomography | |
| WO2008135781A1 (en) | Pulse reconstruction | |
| Burcu et al. | Terahertz Propagation in Tissues and Its Thickness Limitation |
Legal Events
| Date | Code | Title | Description |
|---|---|---|---|
| PUAI | Public reference made under article 153(3) epc to a published international application that has entered the european phase |
Free format text: ORIGINAL CODE: 0009012 |
|
| 17P | Request for examination filed |
Effective date: 20020925 |
|
| AK | Designated contracting states |
Kind code of ref document: A1 Designated state(s): AT BE CH CY DE DK ES FI FR GB GR IE IT LI LU MC NL PT SE TR |
|
| AX | Request for extension of the european patent |
Free format text: AL;LT;LV;MK;RO;SI |
|
| RIN1 | Information on inventor provided before grant (corrected) |
Inventor name: CIESLA, CRAIG MICHAEL Inventor name: COLE, BRYAN EDWARD Inventor name: ARNONE, DONALD DOMINIC |
|
| 17Q | First examination report despatched |
Effective date: 20050309 |
|
| RAP1 | Party data changed (applicant data changed or rights of an application transferred) |
Owner name: TERAVIEW LIMITED |
|
| RIN1 | Information on inventor provided before grant (corrected) |
Inventor name: COLE, BRYAN EDWARD,C/O TERAVIEW LIMITED Inventor name: ARNONE, DONALD DOMINIC,C/O TERAVIEW LIMITED Inventor name: CIESLA, CRAIG MICHAEL,C/O TERAVIEW LIMITED |
|
| GRAP | Despatch of communication of intention to grant a patent |
Free format text: ORIGINAL CODE: EPIDOSNIGR1 |
|
| RBV | Designated contracting states (corrected) |
Designated state(s): AT BE CH CY DE DK ES FI FR GR IE IT LI LU MC NL PT SE TR |
|
| GRAS | Grant fee paid |
Free format text: ORIGINAL CODE: EPIDOSNIGR3 |
|
| GRAA | (expected) grant |
Free format text: ORIGINAL CODE: 0009210 |
|
| AK | Designated contracting states |
Kind code of ref document: B1 Designated state(s): AT BE CH CY DE DK ES FI FR GR IE IT LI LU MC NL PT SE TR |
|
| PG25 | Lapsed in a contracting state [announced via postgrant information from national office to epo] |
Ref country code: IT Free format text: LAPSE BECAUSE OF FAILURE TO SUBMIT A TRANSLATION OF THE DESCRIPTION OR TO PAY THE FEE WITHIN THE PRESCRIBED TIME-LIMIT;WARNING: LAPSES OF ITALIAN PATENTS WITH EFFECTIVE DATE BEFORE 2007 MAY HAVE OCCURRED AT ANY TIME BEFORE 2007. THE CORRECT EFFECTIVE DATE MAY BE DIFFERENT FROM THE ONE RECORDED. Effective date: 20061122 Ref country code: AT Free format text: LAPSE BECAUSE OF FAILURE TO SUBMIT A TRANSLATION OF THE DESCRIPTION OR TO PAY THE FEE WITHIN THE PRESCRIBED TIME-LIMIT Effective date: 20061122 Ref country code: LI Free format text: LAPSE BECAUSE OF FAILURE TO SUBMIT A TRANSLATION OF THE DESCRIPTION OR TO PAY THE FEE WITHIN THE PRESCRIBED TIME-LIMIT Effective date: 20061122 Ref country code: FI Free format text: LAPSE BECAUSE OF FAILURE TO SUBMIT A TRANSLATION OF THE DESCRIPTION OR TO PAY THE FEE WITHIN THE PRESCRIBED TIME-LIMIT Effective date: 20061122 Ref country code: NL Free format text: LAPSE BECAUSE OF FAILURE TO SUBMIT A TRANSLATION OF THE DESCRIPTION OR TO PAY THE FEE WITHIN THE PRESCRIBED TIME-LIMIT Effective date: 20061122 Ref country code: BE Free format text: LAPSE BECAUSE OF FAILURE TO SUBMIT A TRANSLATION OF THE DESCRIPTION OR TO PAY THE FEE WITHIN THE PRESCRIBED TIME-LIMIT Effective date: 20061122 Ref country code: CH Free format text: LAPSE BECAUSE OF FAILURE TO SUBMIT A TRANSLATION OF THE DESCRIPTION OR TO PAY THE FEE WITHIN THE PRESCRIBED TIME-LIMIT Effective date: 20061122 |
|
| REG | Reference to a national code |
Ref country code: CH Ref legal event code: EP |
|
| REG | Reference to a national code |
Ref country code: IE Ref legal event code: FG4D |
|
| REF | Corresponds to: |
Ref document number: 60124676 Country of ref document: DE Date of ref document: 20070104 Kind code of ref document: P |
|
| REG | Reference to a national code |
Ref country code: DE Ref legal event code: R096 Ref document number: 60124676 Country of ref document: DE Effective date: 20070104 |
|
| PG25 | Lapsed in a contracting state [announced via postgrant information from national office to epo] |
Ref country code: DK Free format text: LAPSE BECAUSE OF FAILURE TO SUBMIT A TRANSLATION OF THE DESCRIPTION OR TO PAY THE FEE WITHIN THE PRESCRIBED TIME-LIMIT Effective date: 20070222 Ref country code: SE Free format text: LAPSE BECAUSE OF FAILURE TO SUBMIT A TRANSLATION OF THE DESCRIPTION OR TO PAY THE FEE WITHIN THE PRESCRIBED TIME-LIMIT Effective date: 20070222 |
|
| PG25 | Lapsed in a contracting state [announced via postgrant information from national office to epo] |
Ref country code: ES Free format text: LAPSE BECAUSE OF FAILURE TO SUBMIT A TRANSLATION OF THE DESCRIPTION OR TO PAY THE FEE WITHIN THE PRESCRIBED TIME-LIMIT Effective date: 20070305 |
|
| PG25 | Lapsed in a contracting state [announced via postgrant information from national office to epo] |
Ref country code: PT Free format text: LAPSE BECAUSE OF FAILURE TO SUBMIT A TRANSLATION OF THE DESCRIPTION OR TO PAY THE FEE WITHIN THE PRESCRIBED TIME-LIMIT Effective date: 20070423 |
|
| NLV1 | Nl: lapsed or annulled due to failure to fulfill the requirements of art. 29p and 29m of the patents act | ||
| REG | Reference to a national code |
Ref country code: CH Ref legal event code: PL |
|
| ET | Fr: translation filed | ||
| PLBE | No opposition filed within time limit |
Free format text: ORIGINAL CODE: 0009261 |
|
| STAA | Information on the status of an ep patent application or granted ep patent |
Free format text: STATUS: NO OPPOSITION FILED WITHIN TIME LIMIT |
|
| 26N | No opposition filed |
Effective date: 20070823 |
|
| REG | Reference to a national code |
Ref country code: DE Ref legal event code: R097 Ref document number: 60124676 Country of ref document: DE Effective date: 20070823 |
|
| PG25 | Lapsed in a contracting state [announced via postgrant information from national office to epo] |
Ref country code: IE Free format text: LAPSE BECAUSE OF NON-PAYMENT OF DUE FEES Effective date: 20070305 Ref country code: MC Free format text: LAPSE BECAUSE OF NON-PAYMENT OF DUE FEES Effective date: 20070331 |
|
| PG25 | Lapsed in a contracting state [announced via postgrant information from national office to epo] |
Ref country code: GR Free format text: LAPSE BECAUSE OF FAILURE TO SUBMIT A TRANSLATION OF THE DESCRIPTION OR TO PAY THE FEE WITHIN THE PRESCRIBED TIME-LIMIT Effective date: 20070223 |
|
| PGFP | Annual fee paid to national office [announced via postgrant information from national office to epo] |
Ref country code: DE Payment date: 20080228 Year of fee payment: 8 Ref country code: FR Payment date: 20080311 Year of fee payment: 8 |
|
| PG25 | Lapsed in a contracting state [announced via postgrant information from national office to epo] |
Ref country code: LU Free format text: LAPSE BECAUSE OF NON-PAYMENT OF DUE FEES Effective date: 20070305 Ref country code: CY Free format text: LAPSE BECAUSE OF FAILURE TO SUBMIT A TRANSLATION OF THE DESCRIPTION OR TO PAY THE FEE WITHIN THE PRESCRIBED TIME-LIMIT Effective date: 20061122 |
|
| PG25 | Lapsed in a contracting state [announced via postgrant information from national office to epo] |
Ref country code: TR Free format text: LAPSE BECAUSE OF FAILURE TO SUBMIT A TRANSLATION OF THE DESCRIPTION OR TO PAY THE FEE WITHIN THE PRESCRIBED TIME-LIMIT Effective date: 20061122 |
|
| REG | Reference to a national code |
Ref country code: FR Ref legal event code: ST Effective date: 20091130 |
|
| REG | Reference to a national code |
Ref country code: DE Ref legal event code: R119 Ref document number: 60124676 Country of ref document: DE Effective date: 20091001 |
|
| PG25 | Lapsed in a contracting state [announced via postgrant information from national office to epo] |
Ref country code: DE Free format text: LAPSE BECAUSE OF NON-PAYMENT OF DUE FEES Effective date: 20091001 |
|
| PG25 | Lapsed in a contracting state [announced via postgrant information from national office to epo] |
Ref country code: FR Free format text: LAPSE BECAUSE OF NON-PAYMENT OF DUE FEES Effective date: 20091123 |
|
| P01 | Opt-out of the competence of the unified patent court (upc) registered |
Effective date: 20230517 |