EP1248234A2 - Method for improving breast cancer diagnosis using mountain-view and contrast-enhancement presentation of mammography - Google Patents
Method for improving breast cancer diagnosis using mountain-view and contrast-enhancement presentation of mammography Download PDFInfo
- Publication number
- EP1248234A2 EP1248234A2 EP02076109A EP02076109A EP1248234A2 EP 1248234 A2 EP1248234 A2 EP 1248234A2 EP 02076109 A EP02076109 A EP 02076109A EP 02076109 A EP02076109 A EP 02076109A EP 1248234 A2 EP1248234 A2 EP 1248234A2
- Authority
- EP
- European Patent Office
- Prior art keywords
- image
- tone
- scale
- contrast
- applying
- Prior art date
- Legal status (The legal status is an assumption and is not a legal conclusion. Google has not performed a legal analysis and makes no representation as to the accuracy of the status listed.)
- Withdrawn
Links
Images





Classifications
-
- G—PHYSICS
- G06—COMPUTING OR CALCULATING; COUNTING
- G06T—IMAGE DATA PROCESSING OR GENERATION, IN GENERAL
- G06T5/00—Image enhancement or restoration
- G06T5/40—Image enhancement or restoration using histogram techniques
-
- G—PHYSICS
- G06—COMPUTING OR CALCULATING; COUNTING
- G06T—IMAGE DATA PROCESSING OR GENERATION, IN GENERAL
- G06T5/00—Image enhancement or restoration
- G06T5/73—Deblurring; Sharpening
- G06T5/75—Unsharp masking
-
- G—PHYSICS
- G06—COMPUTING OR CALCULATING; COUNTING
- G06T—IMAGE DATA PROCESSING OR GENERATION, IN GENERAL
- G06T5/00—Image enhancement or restoration
- G06T5/90—Dynamic range modification of images or parts thereof
- G06T5/92—Dynamic range modification of images or parts thereof based on global image properties
-
- G—PHYSICS
- G06—COMPUTING OR CALCULATING; COUNTING
- G06T—IMAGE DATA PROCESSING OR GENERATION, IN GENERAL
- G06T7/00—Image analysis
- G06T7/10—Segmentation; Edge detection
- G06T7/12—Edge-based segmentation
-
- G—PHYSICS
- G06—COMPUTING OR CALCULATING; COUNTING
- G06T—IMAGE DATA PROCESSING OR GENERATION, IN GENERAL
- G06T2207/00—Indexing scheme for image analysis or image enhancement
- G06T2207/10—Image acquisition modality
- G06T2207/10116—X-ray image
-
- G—PHYSICS
- G06—COMPUTING OR CALCULATING; COUNTING
- G06T—IMAGE DATA PROCESSING OR GENERATION, IN GENERAL
- G06T2207/00—Indexing scheme for image analysis or image enhancement
- G06T2207/20—Special algorithmic details
- G06T2207/20016—Hierarchical, coarse-to-fine, multiscale or multiresolution image processing; Pyramid transform
-
- G—PHYSICS
- G06—COMPUTING OR CALCULATING; COUNTING
- G06T—IMAGE DATA PROCESSING OR GENERATION, IN GENERAL
- G06T2207/00—Indexing scheme for image analysis or image enhancement
- G06T2207/20—Special algorithmic details
- G06T2207/20112—Image segmentation details
- G06T2207/20132—Image cropping
-
- G—PHYSICS
- G06—COMPUTING OR CALCULATING; COUNTING
- G06T—IMAGE DATA PROCESSING OR GENERATION, IN GENERAL
- G06T2207/00—Indexing scheme for image analysis or image enhancement
- G06T2207/30—Subject of image; Context of image processing
- G06T2207/30004—Biomedical image processing
- G06T2207/30068—Mammography; Breast
Definitions
- This invention relates in general to a method for presenting image details in a digital image, and more particularly to a method for presenting diagnostically important image details in digital mammography.
- CADx methods usually estimate the likelihood of the malignancy of a tumor that is detected by CAD.
- Current methods of CAD produce markers that indicate abnormalities. These marks are typically circles, arrows, or some form of annotation. The drawback of these methods is that numerous false positives distract radiologists from the subtle signs of disease not detected by CAD.
- Sittek et al see H. Sittek and M. F. Reiser, "Initial clinical experience with CAD in mammography," Computer-Aided Diagnosis in Medical Imaging , K. Doi et al Eds, pp. 185-191, 1999
- Image processing techniques can be used to improve the visualization of mammographic images.
- the contrast of an area of particular interest in a digital mammographic image for example, the dense breast parenchymal pattern, is enhanced to help radiologists interpret the images.
- Another advantage of contrast enhancement is to overcome the dynamic range and modulation transfer function limitations of the output display media, such as radiographic film and monitor display.
- breast parenchymal zone More than 70% of breast cancers develop in the parenchymal zone. Cancers do not arise in the fat tissues because fat cells never divide.
- the breast parenchymal pattern contains the functional glandular elements (also called ductal elements, which are the milk channels) and stroma (connective and supporting tissues).
- the interpretation of a mammogram requires that radiologists visualize the 2 dimensional mammogram as the projection of a 3D anatomic object and to search ductal networks to detect cancers.
- the appearance of breast parenchyma pattern must be enhanced relative to the fatty-tissue surroundings.
- Contrast enhancement methods can be divided into two categories.
- the first category is called the single scale approach, where the image is processed in the original image domain, e.g., a simple look-up-table is used to transform the image.
- the second category is called the multi-scale approach, where the image is decomposed into multiple resolution scales and processing is performed in the multi-scale domain before the image is reconstructed back to the original image intensity domain.
- Leo Desautels, "Region-based contrast enhancement of mammograms," IEEE Transactions on Medical Imaging, vol. 11, no. 3, pp. 392-405, 1992) describe another contrast enhancement method based on region growing.
- the region growing is initiated at the area of interest in test mammogram images that were identified with the aid of an experienced radiologist.
- a tolerance parameter k is selected such that if a pixel value is between (1 - k ) ⁇ to (1 + k ) ⁇ , then the pixel belongs to the region, where ⁇ is the gray value of the starting pixel.
- a new contrast is then reassigned based on the property of the region. Because the initial seed is selected manually, the practical utility of this method is reduced.
- un-sharp masking is a special case since the image is decomposed into two scales.
- the image is first passed through a low-pass filter to obtain a low resolution (low frequency) image.
- the high frequency image is obtained by subtracting the low frequency image from the original image.
- the high frequency components are then amplified and added back to the low frequency components to form a new image that has enhanced image detail.
- Many variations of USM have been developed. The method of Tahoces et al (see P. G. Tahoces, J. Correa, M. Souto, C. Gonzalez, and L. Gomez, "Enhancement of chest and breast radiography by automatic spatial filtering," IEEE Transactions on Medical Imaging, vol. 10, no. 3, pp.
- a morphology operator used as a nonlinear compression function for the high frequency components.
- the high frequency amplitude is large, then it is attenuated. If the high frequency amplitude is small, it is passed unchanged or even amplified. All these methods assume that whenever the signal amplitude gets large, regardless of the cause, the amplitude should be reduced such that overshoot and undershoot artifacts near sharp edges are properly suppressed.
- the general purpose of contrast enhancement is to facilitate useful image information to be visually extracted without the addition of artifacts.
- the first is to identify specifically which image details should be enhanced.
- the second problem is to determine the degree of enhancement.
- the methods described in the prior art fail to address these two problems adequately for digital mammography.
- the amplitude information at each resolution is inadequate to determine whether a large amplitude is caused by a high contrast edge (e.g., from muscle to fat) or an area of interest (e.g., from ducts to fat).
- a high contrast edge e.g., from muscle to fat
- an area of interest e.g., from ducts to fat.
- Failure to make the distinction between useful edges and abundant edges will also cause the suppression of fine details associated with high amplitudes, resulting in a loss of important image detail.
- a predetermined nonlinear amplitude compression function is not sufficient to adaptively enhance the amount of image detail for each resolution at different spatial locations.
- a method for improving disease diagnosis using contrast enhancement presentation comprising:
- the invention provides a general method of enhancing the breast image contrast without adding the edge-banding artifacts around high-contrast edges.
- the invention has the following advantages.
- Fig. 1 is a block diagram of one embodiment of this invention. There are two output images. One output is a mountain-view presentation. The other output is a contrast-enhancement presentation.
- Fig. 2 is a block diagram of the skin line and the breast region extraction algorithm.
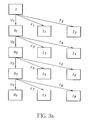
- Figs. 3a and 3b are diagrammatic views of the filter banks (FB) module (decomposition and reconstruction).
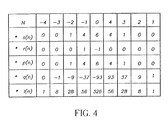
- Fig. 4 is a graphical view showing the filter coefficients in the preferred filter banks.
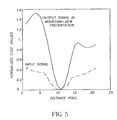
- Fig. 5 is a graphical view showing a comparison of the input signal profile (dashed line) of a line crossing a microcalcification in the input image I and the output signal profile (solid line) of the same line through the output mountain-view image I mv
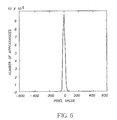
- Fig. 6 is a graphical view showing an example of the histogram of a mountain-view presentation image.
- Figs. 7a and 7b are block diagrams showing two preferred embodiments of this invention.
- Fig. 8 is a block diagram of the tone scale module.
- Fig. 9 is a graphical view showing an example of the image pattern histogram (solid line) and the code-value histogram (dashed line).
- Fig. 10 is a graphical view showing an example of the tone scale curve constructed from a region of interested duct and stroma range (solid line) and from the entire effective code value range (dashed line).
- Fig. 11 is a block diagram showing the contrast weight control module.
- Fig. 1 An overview of the invention is illustrated in Fig. 1.
- the input digital image I from source 10 is first passed into the skin line detection and breast region extraction algorithm 12 to extract the anatomic breast region in the image.
- the skin line detection and breast region extraction algorithm 12 to extract the anatomic breast region in the image.
- 2/3 of a digital mammographic image contains the breast, while the other 1/3 contains the background. Because the background does not have diagnostic information, it is not necessary to process or display the entire image including the background.
- the image containing only breast region is called preprocessed image, I b .
- the first output is the mountain-view presentation I mv .
- the preprocessed input image I b is passed through the decomposition filter bank 14 to produce I d .
- This multiscale edge representation 16 shows a mountain (or hill) presentation I mv of the input image.
- the mountains are the areas containing high-contrast edges. Instead of displaying the image in the traditional intensity domain, the mountain-view presentation displays the image in a multi-scale edge domain. Therefore, high-contrast edges are displayed in an enhanced manner.
- a second output image, called contrast enhancement presentation I cep is shown in the lower half of Fig. 1.
- the preprocessed input image I b is processed using a tone scale (by convention the tone scale is defined as the log exposure to density conversion) curve 18 ( producing I t ) before it passed through the decomposition filter bank 20 to produce I' d .
- the task of tone scaling is to map the dynamic range of the input original image into the dynamic range of the output display medium. After an optimized visualization tone scale is applied to an input image, the output looks pleasing when it is printed digitally. However, the image details still need to be enhanced in the tone-scaled image.
- This invention discloses a contrast weight control mechanism 22 to produce the desired weighting factors, W , and W' , to combine the respective outputs I d and I' d from filter banks 14, 20. Then the output image is reconstructed using a reconstruction filter bank 24. Because the edge information is determined at the coarse scale and adjusted at each scale before it is input to the reconstruction filter bank, the output reconstructed image I cep contains useful enhanced image details, and also contains a right dynamic range to match the intended output medium. The output image I cep is in the same intensity domain as is the input image I.
- the input digital mammographic images can be captured and digitized by various imaging devices. It is important to calibrate the digital image to the desired metric.
- all images are calibrated to relative log X-ray exposure.
- the relative log X-ray exposure is scaled up by a factor of 1000 so that one can use only integer values to represent the input and output images.
- the intermediate results from the various filters are represented as floating point numbers, so that proper precision is always retained.
- Fig. 2 is a block diagram of a method for determining the skin line and the bounding box detection.
- the first step (box 30) in Fig. 2 is to determine the orientation of the breast in the digital mammographic image, that is, to determine whether the breast is facing to the right or to the left.
- the mammographic images are presented such that the breast region is located either on the left or the right side of a mammogram. If the breast is located on the left, it is an image of the left breast and it indicates the breast facing right, and vice versa.
- the pixel values of the breast region are very different from those of the air-background.
- the pixels of the air-background are high values (usually close to the maximum code value in the image) appearing dark (high exposure), while, the pixels values for the breast region are low corresponding to less x-ray penetration.
- the orientation of the anatomy can be determined by the summation of the pixel values of each side. The side with the smaller sum is the side containing the breast region indicating the breast is facing the other side.
- the algorithm determines the candidate breast boundary (box 32) by setting a threshold on the mammogram. Since the pixels of the air-background contain high code values, close to the maximum value of the mammographic image, the threshold value is selected as a fraction of the maximum value, that is ⁇ x max, where ⁇ is selected close to 1. Therefore, there are no pixels of the breast region that are mis-classified as air-background. A binary image is obtained where the candidate breast region has 0 value and the air-background has the value of 1.
- a digital mammographic image may contain some objects other than breast tissues and air-background, such as lead markers, labels, etc.
- the pixels in these objects contain low values close to the breast region.
- the candidate breast region may contain these objects.
- the skin line is determined in the next step (box 36). To avoid searching for the skin line from the wrong side, the algorithm always starts searching from the chest wall side. If the breast is facing left, the image is flipped (box 34). Within a line passing through the breast and the labels, the pixel with the value 1 appears first at the transition from the skin line to the air-background and then appears at the transition from the air-background to the label. The first appearing pixel is selected as the location of the skin pixel on that line.
- the coordinates of the bounding box containing the breast is determined by adding extra pixels in both the x and y directions (box 44). Then the breast region is extracted according to the bounding box (box 46).
- the number of extra pixels can be selected as a reasonable value. For a mammogram with a resolution of 100 micrometers, an extra 80 pixels adds 8mm distance around the skin line. The output image looks natural.
- edges There is a technique that is used to detect edges by computing image gradients. However, it is not enough to simply compute the image gradient between the neighboring pixels because the change or difference could be small. It is natural to examine edges at different resolution scales. The important edges where radiologists look for a sign of cancers are the high-contrast edges at coarse levels where subtle image details have been smoothed out and only the high-contrast edges are left.
- a tool called multiresolution edge decomposition is utilized through filter banks.
- the filters in the decomposition filter bank are designed as the edge detector. Because the DC component is removed from the image, the output of decomposition contains fine details of the input image in different scales. This output is also called multiscale edge representation. For a given scale, the local edges can be displayed very pronouncedly, even for the small microcalcifications.
- Fig. 3a contains decomposition modules and Fig. 3b reconstruction modules. Because the reconstruction module is used in Contrast-Enhancement Presentation, for convenience, we describe these two modules together here.
- the task of the filter banks is to extract the high frequency details, and to remove the very low frequency (DC) component.
- the number of filter paths, N is determined by cost and system throughput constraints. As the number of filter paths increases, the banding artifact is reduced because more frequency channels allow the shape edges to be suppressed more successfully as a function of a spatial scale.
- the filter banks in this invention separate each filter path into two paths, F i , and H i .
- Filter F i is designed to be an edge detector in different spatial scales and orientations. The output from filter F i represents edge signals at a particular scale in a particular spatial orientation. It is this explicit edge contrast signal that is manipulated to display as an output image to produce the mountain-view presentation.
- Filter H i is required to reconstruct the image.
- the filter coefficients are derived as shown in Fig. 4.
- Fig. 5 displays the comparison of the input signal profile of a line crossing a microcalcification in the input image I and the output signal profile of the same line through the output image I mv .
- the contrast between the calcification and the surroundings is increased 10 times.
- this mountain-view image is displayed in a softcopy environment on a display monitor.
- a windowing technique is used to display this mountain-view image. First, the peak is searched and the position of the peak is selected as the window center. Then the algorithm finds the left value of the window by searching down the left of the peak until the histogram becomes too small. Similarly, the right value of the window is located to the right of the peak. The window width is calculated as the right value minus the left value.
- the mountain-view presentation image is displayed in an output medium such that the window width is stretched to fit the output medium range to maximize the visualization of high contrast edges.
- Fig. 1 The invention as shown in Fig. 1 can be performed more efficiently by two different embodiments shown in Figs 7a and 7b. Instead of processing the original version of the input image and its tone-scaled version through the decomposition filter bank separately, the new embodiments only process one of the versions and the coarsest scale of the other version.
- Fig. 7a shows the first embodiment where the preprocessed image I b is processed in the tone scale curve algorithm 50 to produce a tone-scaled image I t . The tone-scaled image is then passed through a filter U N /2 52 to produce the coarsest scale B N /2, t .
- the preprocessed input image I b in another pass, is passed through a filter bank, consisting of a set of N decomposition filters F 1 , F 2 , ⁇ , F N , 54 1 , 54 2 ,..., 54 n .
- the main function of the filters 54 1 -54 n in this invention is to extract the image edge features, which are considered as desirable targets for enhancement.
- the output I 1 , I 2 , ⁇ ,I N from each of the filters 54 1 -54 n is modulated in modulators M 1 , M 2 , ⁇ , M N , 56 1 -56 n , respectively, by a gain-control signal G 1 - G n , which is produced by the contrast weight control generator 58 from the decomposition signals I 1 -I n of the original input image I .
- Fig. 7b shows the second embodiment.
- the preprocessed input image I b is passed through two filters F N- 1 and F N , 70, 72 to produce the coarsest edge signals, I N -1 and I N respectively.
- the preprocessed image I b is processed in the tone scale curve algorithm 74 to produce a tone-scaled image I t .
- the tone-scaled image is passed through a filter bank, consisting of a set of N decomposition filters F 1 , F 2 , ⁇ , F N , 76 1 -76 n , and one low pass filter U N /2 78.
- the tone-scaled version output I t 1 , I t 2 , ⁇ , I tN from the filter bank is modulated in modulators in M 1 , M 2 , ⁇ , M N 80 1 - 80 n by a gain-control signal G 1 - G n , which is produced by the contrast weight control generator.
- the contrast weight control generator 82 in this embodiment is generated from all the output of the decomposition filter bank of the tone-scaled image I t1 - I tN as well as the output of coarsest scale of the original image I b , I N -1 , I N .
- the gain-adjusted signals I ' t 1 , I ' t 2 , ⁇ , I ' tN , together with the low pass filtered tone-scaled image, B N /2, t , are passed through a set of reconstruction filter banks, H 1 , H 2 , ⁇ , H N , 84 1 -84 n and V 1 , ⁇ , V N /2 , 86 and summed on adder 88 to produce the desired output image, I out .
- the contrast-enhancement presentation in Figs. 7a and 7b consists of three major modules: (1) tone scale curve module, (2) contrast weight control module, and (3) filter banks module.
- the filter banks module is already described in the Mountain-view Presentation section.
- the Tone Scale Curve module and The Contrast Weight Control module will be described in detail in this section.
- Fig. 8 shows a diagram of the Tone Scale Curve module.
- This module computes a unique tone scale curve for each input digital mammographic image and applies it to produce a tone-scaled version of the input image.
- the major function of the tone scale curve is to stretch or compress the dynamic range of the input image into a dynamic range of the output medium so that the output medium can render the image effectively.
- Lee et al see U.S. Patent, 5,633,511, "Automatic tone scale adjustment using image activity measures," H-C. Lee, L. L. Barski, and R. A. Senn
- the crucial input to this method is the four points (the far-left, the left, the right, and the far-right) representing the portion of the dynamic range that corresponds to the region of interest in the input image.
- the region of interest in a mammographic image is the location of ducts where breast cancers arise. Since locating the ducts themselves in a mammogram is very difficult, radiologists pay special attention to the ducts and stroma in a mammograhic image to detect any abnormalities that could lead to a cancer. Therefore, the ducts and stroma need to be adequately visualized.
- the ducts and stroma are located as the local high contrast edges in a coarse scale where other image details are smoothed out. Because of image noise in the image formation process, simply computing the edges through the gradient amplitudes among the neighboring pixels causes a lot of false alarms.
- the reliable method of extracting the ducts and stroma in the mammographic image is to extract the high contrast edges in a coarse scale. Then a histogram that represents the code value distribution of ducts and stroma is obtained. Because this histogram represents the distribution of the image pattern of interest in an image, this histogram is called the image pattern histogram.
- the four points that represent the dynamic range of the ducts and stroma structures of an input image are determined from its image pattern histogram generated in a coarse scale.
- the first step in the tone scale curve module is that the preprocessd input image I b is filtered through two filters 90, 92 in the filter bank, F N -1 and F N . These two filters 90, 92 produce the edge information in the horizontal and vertical directions in the coarsest resolution N /2.
- N 8.
- the algorithm then computes the edge gradient from the filters output, I N -1 and I N .
- the edge gradient amplitude is computed 94 by taking the square root of the sum of the square of I N -1 and the square of I N .
- the algorithm computes the edge map 96 by finding the local maximum gradient magnitude along the gradient direction.
- the edge map is a binary image where the pixel value 1 represents the local maximum gradient pixel and the pixel value 0 represents other pixels.
- the image pattern histogram is computed 98 from the input image pixels that are the local maximum gradient pixels (belonging to the edge map) at the coarsest resolution. This histogram represents the code value distribution of the local edge points at a desired coarse scale, which represents the distribution of ducts and stroma.
- Fig. 9 shows the image pattern histogram and the code value histogram obtained from the entire digital mammographic image. Fig. 9 illustrates that most of the code values of the region of interest fall between 1500 to 1800, while most of the code values of the entire image span the range of 1300 to 2600.
- contrast weight control is to preserve or amplify the edges that are important and suppress the edges that are not important.
- the large edges are almost always caused by X-ray attenuation differences in the skin region, which contains mostly the fat and skin and little of diagnostic value. This kind of edge needs to be suppressed.
- the function of the Contrast Weight Control module is to detect all the ductal and stroma edges in the input image and to generate a weight control signal for each pixel of the image.
- the small magnitude edges and very big magnitude edges are given a contrast small gain, while the moderate magnitude edges are given a higher gain.
- the important edges are greatly amplified in the output while the big and small edges are suppressed.
- Fig. 11 shows the preferred embodiment of the contrast-weight control signal generation.
- Two inputs, I N -1 and I N are the output of filters F N- 1 and F N from the preprocessed input image I b , respectively ( see: Figs. 7, 8). These two inputs represent the edge signals in the x and y directions at the coarsest scale.
- the gradient magnitude is computed by the gradient amplitude processor 110.
- the computed edge gradient magnitude is mapped through a function g 0 112, and the output T is used to modify the gain-control signals G 1 , G 2 , ⁇ , G N .
- the general functional form of g 0 112 is chosen so that when the edge gradient amplitude is very small or very large, its output value T is small and when the edge gradient amplitude is moderate, T is big.
- the T value is used as a mask image so that the functions g 1 , g 2 , ⁇ , g N can adjust its gain spatially.
- the gain control function, g i produces the local gain factor G i to suppress the edges
- the weight control function produces a larger gain to amplify the edges.
- the N additional input signals to the Contrast Weight Control module are J 1 , J 2 , ⁇ , J N from the output of decomposition filter F 1 , F 2 , ⁇ , F N .
- these N inputs are processed from the preprocessed input image I b .
- these N inputs are processed from the tone-scaled version of the input image.
- These input signals are modified by functions g 1 , g 2 , ⁇ , g N under the influence of T to produce the final weight control signals G 1 , G 2 , ⁇ , G N .
- the general form of the functions, g 1 , g 2 , ⁇ , g N is similar to that of g 0 .
- g i produces small gain factors for edge pixels in J i when T is small and produces big gain factors when T is big.
- the function g i allows contrast weight control with between-scale interactions because it adjusts the pixels at scale i whose corresponding pixels are being detected in the coarsest scale. Any scheme that attempts to suppress the banding artifacts has to use a coarse scale edge detector to control the contrast weight factor. This is why a gain-control function generated internally within each scale cannot work well.
- the weight contrast signal for the fine resolution details has to come from the coarse resolution edges. That means for the very big and very small image details that are detected in the coarsest scale, the corresponding pixels at an other scale, say i , are adjusted by the local small gain factor G i to suppress the edges. In comparison, for the moderate image details that are detected in the coarsest scale, the corresponding pixels at scale i are adjusted by the local large gain factor G i to enlarge the edges.
Landscapes
- Engineering & Computer Science (AREA)
- Physics & Mathematics (AREA)
- General Physics & Mathematics (AREA)
- Theoretical Computer Science (AREA)
- Computer Vision & Pattern Recognition (AREA)
- Apparatus For Radiation Diagnosis (AREA)
- Image Processing (AREA)
- Image Analysis (AREA)
Abstract
Description
- Preprocessing - an algorithm for detecting the skin line before extracting the breast region
- Mountain-view presentation method
- Contrast-enhancement presentation method



Claims (12)
- A method for improving disease diagnosis using contrast enhancement presentation comprising:providing an input digital diagnostic image;applying a decomposition filter bank to the input digital diagnostic image;constructing a tone scale curve from the input digital diagnostic image;applying said tone scale curve to the input digital diagnostic image to produce a tone-scaled image;applying a decomposition filter bank to the tone-scaled image;generating the contrast weight control signals from the input digital diagnostic image by extracting the high contrast edge signals at the coarse scale;adjusting the decomposition outputs from both the input image and the tone-scaled image according to the contrast weight control signals; andapplying a reconstruction filter bank to the adjusted signals to produce a contrast enhancement presentation output image.
- A method for improving disease diagnosis using mountain-view presentation comprising:providing an input digital diagnostic image;applying a decomposition filter bank to said digital diagnostic image to produce high contrast edge signals; andoutputting a mountain-view presentation image having mountains and plateaus wherein mountains are the areas containing high contrast edges and plateaus are the areas containing low frequency components.
- A method for improving breast cancer diagnosis using mountain-view presentation comprising:providing an input digital mammographic image;applying a decomposition filter bank to said digital mammographic image to produce high contrast edge signals; andoutputting a mountain-view presentation having mountains and plateaus where mountains are the areas containing high contrast edges and plateaus are the areas containing low frequency components.
- A method for improving breast cancer diagnosis using contrast enhancement presentation comprising:providing an input digital mammographic image;applying a decomposition filter bank to said input digital mammorgraphic image;constructing a tone scale curve from said input digital mammographic image;applying said tone scale curve to said input digital mammographic image to produce a tone-scaled image;applying a decomposition filter bank to said tone-scaled image;generating contrast weight control signals from the input digital mammographic image by extracting high contrast edge signals at the coarse scale;adjusting decomposition outputs from both the input image and the tone-scaled image according to the contrast weight control signals; andapplying a reconstruction filter bank to the adjusted signals to produce a contrast enhancement presentation output image.
- The method of claim 1 wherein said applying a decomposition filter bank to said input digital diagnostic image includes processing said image through a plurality of a pair of forward and reversed low pass, band pass and high pass filters.
- The method according to claim 1, wherein said constructing a tone scale curve includes:applying the decomposition filter bank to the input image to produce a high-passed input image at a coarse scale;computing the gradient amplitude of the high-passed input image at a coarse scale;computing a binary edge map image where value 1 represents the pixel being the local maximum gradient magnitude along the gradient direction and value 0 represents other pixels;computing an image pattern histogram from the pixels belonging to the edge map with value 1 at a coarse scale;finding a range that covers the most effective code values in the image pattern histogram; andconstructing the tone scale curve from the found range.
- The method according to claim 1, wherein said generating the contrast weight control signals include:applying the decomposition filter bank to the input image to produce a high-passed input image at a coarse scale;computing an image gradient amplitude of the high-passed input image at the coarse scale; andconstructing a mask image weight factors W such that W produces larger gain factors when the gradient amplitude at the coarse scale is moderate and smaller gain factors when the gradient amplitude at the coarse scale is very small and very big.
- A method of enhancing high contrast details of an input image for rendering it effectively on an output display medium comprising:constructing a tone scale curve from the input image;applying a tone scale curve to the input image to produce a tone-scaled image;applying a decomposition filter bank to the tone-scaled image to produce the low-pass tone-scaled image;applying the decomposition filter bank to the input image to produce the high-passed input image in each spatial scale;generating the contrast weight control signals from the high-passed input image in each spatial scale;adjusting the high-passed input image in each scale according to said contrast weight control signals; and,applying a reconstruction filter bank to the low-pass tone-scaled image and the adjusted high-pass input image to produce a contrast enhancement presentation image for rendering on an output display medium.
- The method according to claim 8, wherein said constructing a tone scale curve includes:applying a decomposition filter bank to the input image to produce a high-passed input image at a coarse scale;computing a gradient amplitude of the high-passed input image at the coarse scale;computing a binary edge map image where value 1 representing a pixel being the local maximum gradient magnitude along the gradient direction and value 0 represents other pixels;computing an image pattern histogram from the pixels belong to the edge map with value 1 at the coarse scale;finding a range that covers the most effective code values in the image pattern histogram; and,constructing the tone scale curve from the found range.
- The method according to claim 8, wherein said generating contrast weight control signals includes:applying a decomposition filter bank to the input image to produce a high-passed input image at a coarse scale;computing a gradient amplitude of the high-passed input image at the coarse scale;creating a mapping function that the output value T is large when the gradient amplitude at the coarse scale is moderate and the output value T is small when the gradient amplitude at the coarse scale is very small and very large; and,creating a mask image of the weight factor G such that G produces large gain factors for the pixels in each scale whose corresponding gradient amplitudes at the coarse scale having large T values and small gain factors for the pixels in each scale whose corresponding gradient amplitudes at the coarse scale having small T values.
- A method of enhancing high contrast details of an input image for rendering it effectively on an output display medium comprising;constructing a tone scale curve from the input image;applying the tone scale curve to the input image to produce the tone-scaled image;applying a decomposition filter bank to the tone-scaled image to produce a low-pass tone-scaled image and a high-pass tone-scaled image in each spatial scale;applying a decomposition filter bank to the input image to produce a high-pass input image at a coarse scale;generating contrast weight control signals from the high-passed input image at the coarse scale and the high-passed tone-scaled image in each spatial scale;adjusting the high-passed tone-scaled image in each scale according to the contrast weight control signals; andapplying a reconstruction filter bank to the low-pass tone-scaled image and the adjusted high-pass tone-scaled image to produce a contrast enhancement presentation image.
- A method of extracting the breast skin line and the bounding box containing the breast region in a digital diagnostic image of a breast comprises:determining whether the breast faces right or left by comparing the summation of the pixel values of the right and left sides of the image;determining a candidate boundary by thresholding the image with a value close to the pixels of the air-background;flipping the image if it faces the left;searching for the skin line from the left (the chest wall side) on the candidate boundary image;searching for the skin line from the right at the curvature bottom of the breast on the candidate boundary image;linking and smoothing the skin line;flipping the image back if it is facing to the left;determining the coordinates of a bounding box containing pixels between the skin line and the chest wall; andextracting the breast region according to said bounding box.
Applications Claiming Priority (2)
| Application Number | Priority Date | Filing Date | Title |
|---|---|---|---|
| US824602 | 1986-01-31 | ||
| US09/824,602 US6956975B2 (en) | 2001-04-02 | 2001-04-02 | Method for improving breast cancer diagnosis using mountain-view and contrast-enhancement presentation of mammography |
Publications (2)
| Publication Number | Publication Date |
|---|---|
| EP1248234A2 true EP1248234A2 (en) | 2002-10-09 |
| EP1248234A3 EP1248234A3 (en) | 2004-03-24 |
Family
ID=25241831
Family Applications (1)
| Application Number | Title | Priority Date | Filing Date |
|---|---|---|---|
| EP02076109A Withdrawn EP1248234A3 (en) | 2001-04-02 | 2002-03-21 | Method for improving breast cancer diagnosis using mountain-view and contrast-enhancement presentation of mammography |
Country Status (3)
| Country | Link |
|---|---|
| US (1) | US6956975B2 (en) |
| EP (1) | EP1248234A3 (en) |
| JP (1) | JP2002369079A (en) |
Cited By (3)
| Publication number | Priority date | Publication date | Assignee | Title |
|---|---|---|---|---|
| EP1480166A1 (en) * | 2003-05-17 | 2004-11-24 | STMicroelectronics Asia Pacific Pte Ltd | An edge enhancement process and system |
| EP1820447A4 (en) * | 2004-12-10 | 2009-07-22 | Konica Minolta Med & Graphic | Image processing device, image processing method, and image processing program |
| CN116228764A (en) * | 2023-05-08 | 2023-06-06 | 聊城市东昌府区妇幼保健院 | A method and system for detecting the quality of blood film collection for neonatal disease screening |
Families Citing this family (86)
| Publication number | Priority date | Publication date | Assignee | Title |
|---|---|---|---|---|
| US6996549B2 (en) * | 1998-05-01 | 2006-02-07 | Health Discovery Corporation | Computer-aided image analysis |
| DE10139708A1 (en) * | 2001-08-11 | 2003-02-20 | Philips Corp Intellectual Pty | Processing of digital cardiac radiographs so that small blood vessels are highlighted and other structure is suppressed by decomposition of an initial image into detailed images for highlighting and then recombination |
| US7176969B2 (en) * | 2001-12-13 | 2007-02-13 | International Business Machines Corporation | System and method for anti-moire imaging in a one dimensional sensor array |
| KR100403601B1 (en) * | 2001-12-21 | 2003-10-30 | 삼성전자주식회사 | Apparatus and method for enhancing edge of image |
| US7418123B2 (en) * | 2002-07-12 | 2008-08-26 | University Of Chicago | Automated method and system for computerized image analysis for prognosis |
| JP4045422B2 (en) * | 2002-07-23 | 2008-02-13 | 株式会社日立メディコ | Image processing device |
| EP1595227B1 (en) * | 2003-02-07 | 2011-06-15 | Koninklijke Philips Electronics N.V. | Image viewing system and method for generating filters for filtering image features according to their type |
| JP4822669B2 (en) * | 2003-02-19 | 2011-11-24 | アグフア・ヘルスケア・ナームローゼ・フエンノートシヤツプ | How to determine image orientation |
| FR2863749B1 (en) * | 2003-12-10 | 2006-04-07 | Ge Med Sys Global Tech Co Llc | RADIOLOGICAL IMAGE PROCESSING METHOD FOR DETECTION OF MICROCALCIFICATIONS |
| US20060008178A1 (en) * | 2004-07-08 | 2006-01-12 | Seeger Adam A | Simulation of scanning beam images by combination of primitive features extracted from a surface model |
| JP2006072555A (en) * | 2004-08-31 | 2006-03-16 | Secom Co Ltd | Biological information image correction device |
| US7736313B2 (en) * | 2004-11-22 | 2010-06-15 | Carestream Health, Inc. | Detecting and classifying lesions in ultrasound images |
| US20060110022A1 (en) * | 2004-11-24 | 2006-05-25 | Zhang Daoxian H | Automatic image contrast in computer aided diagnosis |
| US9083969B2 (en) | 2005-08-12 | 2015-07-14 | Sharp Laboratories Of America, Inc. | Methods and systems for independent view adjustment in multiple-view displays |
| US7515160B2 (en) | 2006-07-28 | 2009-04-07 | Sharp Laboratories Of America, Inc. | Systems and methods for color preservation with image tone scale corrections |
| US7768496B2 (en) | 2004-12-02 | 2010-08-03 | Sharp Laboratories Of America, Inc. | Methods and systems for image tonescale adjustment to compensate for a reduced source light power level |
| US7924261B2 (en) | 2004-12-02 | 2011-04-12 | Sharp Laboratories Of America, Inc. | Methods and systems for determining a display light source adjustment |
| US7800577B2 (en) | 2004-12-02 | 2010-09-21 | Sharp Laboratories Of America, Inc. | Methods and systems for enhancing display characteristics |
| US8120570B2 (en) | 2004-12-02 | 2012-02-21 | Sharp Laboratories Of America, Inc. | Systems and methods for tone curve generation, selection and application |
| US8111265B2 (en) | 2004-12-02 | 2012-02-07 | Sharp Laboratories Of America, Inc. | Systems and methods for brightness preservation using a smoothed gain image |
| US8922594B2 (en) | 2005-06-15 | 2014-12-30 | Sharp Laboratories Of America, Inc. | Methods and systems for enhancing display characteristics with high frequency contrast enhancement |
| US8913089B2 (en) | 2005-06-15 | 2014-12-16 | Sharp Laboratories Of America, Inc. | Methods and systems for enhancing display characteristics with frequency-specific gain |
| US7961199B2 (en) * | 2004-12-02 | 2011-06-14 | Sharp Laboratories Of America, Inc. | Methods and systems for image-specific tone scale adjustment and light-source control |
| US8947465B2 (en) | 2004-12-02 | 2015-02-03 | Sharp Laboratories Of America, Inc. | Methods and systems for display-mode-dependent brightness preservation |
| US7982707B2 (en) | 2004-12-02 | 2011-07-19 | Sharp Laboratories Of America, Inc. | Methods and systems for generating and applying image tone scale adjustments |
| US8004511B2 (en) | 2004-12-02 | 2011-08-23 | Sharp Laboratories Of America, Inc. | Systems and methods for distortion-related source light management |
| US7782405B2 (en) | 2004-12-02 | 2010-08-24 | Sharp Laboratories Of America, Inc. | Systems and methods for selecting a display source light illumination level |
| US7787703B2 (en) * | 2005-05-11 | 2010-08-31 | Xerox Corporation | Method and system for extending binary image data to contone image data |
| CN100548222C (en) * | 2005-09-15 | 2009-10-14 | Ge医疗系统环球技术有限公司 | Image processing method and X ray CT system |
| US9026404B2 (en) * | 2005-10-20 | 2015-05-05 | Syracuse University | Methods of improving detectors and classifiers using optimized stochastic resonance noise |
| US8214177B2 (en) * | 2005-10-20 | 2012-07-03 | Syracuse University | Optimized stochastic resonance signal detection method |
| US8139828B2 (en) * | 2005-10-21 | 2012-03-20 | Carestream Health, Inc. | Method for enhanced visualization of medical images |
| US7580569B2 (en) * | 2005-11-07 | 2009-08-25 | Xerox Corporation | Method and system for generating contone encoded binary print data streams |
| US7773254B2 (en) * | 2005-11-10 | 2010-08-10 | Xerox Corporation | Method and system for improved copy quality in a multifunction reprographic system |
| US7869093B2 (en) | 2005-11-17 | 2011-01-11 | Xerox Corporation | Method and system for improved copy quality in a multifunction reprographic system |
| US7742658B2 (en) * | 2006-01-26 | 2010-06-22 | Xerox Corporation | System and method for boundary artifact elimination in parallel processing of large format images |
| US7663782B2 (en) | 2006-01-26 | 2010-02-16 | Xerox Corporation | System and method for high addressable binary image generation using rank ordered error diffusion on pixels within a neighborhood |
| GB0602739D0 (en) * | 2006-02-10 | 2006-03-22 | Ccbr As | Breast tissue density measure |
| US20070206844A1 (en) * | 2006-03-03 | 2007-09-06 | Fuji Photo Film Co., Ltd. | Method and apparatus for breast border detection |
| US7839406B2 (en) | 2006-03-08 | 2010-11-23 | Sharp Laboratories Of America, Inc. | Methods and systems for enhancing display characteristics with ambient illumination input |
| FR2903211B1 (en) * | 2006-06-30 | 2009-03-06 | Gen Electric | METHODS AND DEVICES FOR CORRECTING IMPLANT MAMMOGRAPHY AND SEGMENTING AN IMPLANT |
| US20080049238A1 (en) * | 2006-08-28 | 2008-02-28 | Xerox Corporation | Method and system for automatic window classification in a digital reprographic system |
| US7916912B2 (en) * | 2006-09-14 | 2011-03-29 | Siemens Israel Ltd. | Efficient border extraction of image feature |
| US8644574B2 (en) * | 2006-10-03 | 2014-02-04 | The Brigham And Women's Hospital, Inc. | Measurement of thin-layered structures in X-ray computer tomography |
| WO2008046450A1 (en) * | 2006-10-18 | 2008-04-24 | Robert Bosch Gmbh | Image processing system, method and computer program for contrast enhancement of images |
| US8184874B2 (en) * | 2006-12-22 | 2012-05-22 | Carestream Health, Inc. | Enhanced display of medical images |
| WO2008091583A2 (en) * | 2007-01-23 | 2008-07-31 | Dtherapeutics, Llc | Image-based extraction for vascular trees |
| US7826681B2 (en) | 2007-02-28 | 2010-11-02 | Sharp Laboratories Of America, Inc. | Methods and systems for surround-specific display modeling |
| US8340387B2 (en) * | 2007-04-13 | 2012-12-25 | Three Palm Software | Fast preprocessing algorithms for digital mammography CAD and workstation |
| US8345038B2 (en) | 2007-10-30 | 2013-01-01 | Sharp Laboratories Of America, Inc. | Methods and systems for backlight modulation and brightness preservation |
| US8155434B2 (en) | 2007-10-30 | 2012-04-10 | Sharp Laboratories Of America, Inc. | Methods and systems for image enhancement |
| DE102007057013A1 (en) * | 2007-11-23 | 2009-05-28 | Image Diagnost International Gmbh | Digital mammogram e.g. raw mammogram, processing device for breast, involves optimizing contrast of pixel value of brightness optimized mammogram and/or sharpness of structure contained in displayed object |
| US9177509B2 (en) | 2007-11-30 | 2015-11-03 | Sharp Laboratories Of America, Inc. | Methods and systems for backlight modulation with scene-cut detection |
| US8378956B2 (en) | 2007-11-30 | 2013-02-19 | Sharp Laboratories Of America, Inc. | Methods and systems for weighted-error-vector-based source light selection |
| US20090154782A1 (en) * | 2007-12-17 | 2009-06-18 | Three Palm Software | Dual-magnify-glass visualization for soft-copy mammography viewing |
| US8203579B2 (en) | 2007-12-26 | 2012-06-19 | Sharp Laboratories Of America, Inc. | Methods and systems for backlight modulation with image characteristic mapping |
| US8223113B2 (en) | 2007-12-26 | 2012-07-17 | Sharp Laboratories Of America, Inc. | Methods and systems for display source light management with variable delay |
| US8169431B2 (en) | 2007-12-26 | 2012-05-01 | Sharp Laboratories Of America, Inc. | Methods and systems for image tonescale design |
| US8207932B2 (en) | 2007-12-26 | 2012-06-26 | Sharp Laboratories Of America, Inc. | Methods and systems for display source light illumination level selection |
| US8179363B2 (en) | 2007-12-26 | 2012-05-15 | Sharp Laboratories Of America, Inc. | Methods and systems for display source light management with histogram manipulation |
| US8531379B2 (en) | 2008-04-28 | 2013-09-10 | Sharp Laboratories Of America, Inc. | Methods and systems for image compensation for ambient conditions |
| US8416179B2 (en) | 2008-07-10 | 2013-04-09 | Sharp Laboratories Of America, Inc. | Methods and systems for color preservation with a color-modulated backlight |
| US9460491B2 (en) * | 2008-08-25 | 2016-10-04 | Xerox Corporation | Method for binary to contone conversion with non-solid edge detection |
| US9330630B2 (en) | 2008-08-30 | 2016-05-03 | Sharp Laboratories Of America, Inc. | Methods and systems for display source light management with rate change control |
| WO2010045406A2 (en) * | 2008-10-15 | 2010-04-22 | The Regents Of The University Of California | Camera system with autonomous miniature camera and light source assembly and method for image enhancement |
| US8588485B2 (en) * | 2008-11-25 | 2013-11-19 | Carestream Health, Inc. | Rendering for improved diagnostic image consistency |
| US8139832B2 (en) * | 2008-12-12 | 2012-03-20 | Hologic, Inc. | Processing medical images of the breast to detect anatomical abnormalities therein |
| US20100158332A1 (en) * | 2008-12-22 | 2010-06-24 | Dan Rico | Method and system of automated detection of lesions in medical images |
| DE102009019840B4 (en) * | 2009-05-04 | 2026-06-25 | Siemens Healthineers Ag | Contrast enhancement of CT images using a multiband filter |
| US8165724B2 (en) | 2009-06-17 | 2012-04-24 | Sharp Laboratories Of America, Inc. | Methods and systems for power-controlling display devices |
| JP5502382B2 (en) * | 2009-07-02 | 2014-05-28 | 株式会社東芝 | Mammography apparatus and image processing apparatus |
| EP2309447A1 (en) * | 2009-09-22 | 2011-04-13 | Nxp B.V. | Image contrast enhancement |
| US8400670B2 (en) * | 2009-11-16 | 2013-03-19 | Eastman Kodak Company | Image down-sampling with fine detail enhancement |
| EP2328124B1 (en) * | 2009-11-25 | 2019-05-15 | Agfa Nv | Method of enhancing the contrast of spatially-localized phenomena in an image |
| US20110123074A1 (en) * | 2009-11-25 | 2011-05-26 | Fujifilm Corporation | Systems and methods for suppressing artificial objects in medical images |
| JP5457812B2 (en) * | 2009-12-15 | 2014-04-02 | 株式会社東芝 | Medical image processing device |
| US20110200238A1 (en) * | 2010-02-16 | 2011-08-18 | Texas Instruments Incorporated | Method and system for determining skinline in digital mammogram images |
| JP5804340B2 (en) * | 2010-06-10 | 2015-11-04 | 株式会社島津製作所 | Radiation image region extraction device, radiation image region extraction program, radiation imaging device, and radiation image region extraction method |
| WO2012112627A2 (en) * | 2011-02-14 | 2012-08-23 | University Of Rochester | Method and apparatus of cone beam breast ct image-based computer-aided detection and diagnosis |
| US8744205B2 (en) * | 2011-06-16 | 2014-06-03 | Fraunhofer Gesellschaft zur Förderung der angewandten Forschung e.V. | Apparatus for decomposing images and recomposing adjusted images |
| JP5940474B2 (en) * | 2012-09-27 | 2016-06-29 | 富士フイルム株式会社 | Body motion detection device and method |
| US9092856B2 (en) * | 2013-10-31 | 2015-07-28 | Stmicroelectronics Asia Pacific Pte. Ltd. | Recursive de-banding filter for digital images |
| WO2015175031A1 (en) * | 2014-02-17 | 2015-11-19 | General Electric Company | Method and system for processing scanned images |
| US9741104B2 (en) * | 2015-05-18 | 2017-08-22 | Toshiba Medical Systems Corporation | Apparatus, method, and computer-readable medium for quad reconstruction using hybrid filter convolution and high dynamic range tone-mapping |
| US11246551B2 (en) | 2016-09-20 | 2022-02-15 | KUB Technologies, Inc. | System and method for computer aided detection (CAD) in a breast specimen radiograph |
| CN113039581B (en) * | 2018-09-14 | 2025-06-06 | 恩维医疗公司有限公司 | Multi-scale image reconstruction of 3D objects |
Family Cites Families (9)
| Publication number | Priority date | Publication date | Assignee | Title |
|---|---|---|---|---|
| DE69214229T2 (en) * | 1991-08-14 | 1997-04-30 | Agfa Gevaert Nv | Method and device for improving the contrast of images |
| EP0736842B1 (en) * | 1995-03-29 | 2003-12-17 | Fuji Photo Film Co., Ltd. | Image processing method and apparatus |
| US5633511A (en) * | 1995-12-22 | 1997-05-27 | Eastman Kodak Company | Automatic tone scale adjustment using image activity measures |
| US5799100A (en) * | 1996-06-03 | 1998-08-25 | University Of South Florida | Computer-assisted method and apparatus for analysis of x-ray images using wavelet transforms |
| US6075878A (en) | 1997-11-28 | 2000-06-13 | Arch Development Corporation | Method for determining an optimally weighted wavelet transform based on supervised training for detection of microcalcifications in digital mammograms |
| US6285798B1 (en) * | 1998-07-06 | 2001-09-04 | Eastman Kodak Company | Automatic tone adjustment by contrast gain-control on edges |
| US6175658B1 (en) | 1998-07-10 | 2001-01-16 | General Electric Company | Spatially-selective edge enhancement for discrete pixel images |
| DE69830494T2 (en) | 1998-11-10 | 2006-03-16 | Agfa-Gevaert | Method for improving artifacts in digital images |
| US6611627B1 (en) * | 2000-04-24 | 2003-08-26 | Eastman Kodak Company | Digital image processing method for edge shaping |
-
2001
- 2001-04-02 US US09/824,602 patent/US6956975B2/en not_active Expired - Fee Related
-
2002
- 2002-03-21 EP EP02076109A patent/EP1248234A3/en not_active Withdrawn
- 2002-04-02 JP JP2002100176A patent/JP2002369079A/en active Pending
Cited By (3)
| Publication number | Priority date | Publication date | Assignee | Title |
|---|---|---|---|---|
| EP1480166A1 (en) * | 2003-05-17 | 2004-11-24 | STMicroelectronics Asia Pacific Pte Ltd | An edge enhancement process and system |
| EP1820447A4 (en) * | 2004-12-10 | 2009-07-22 | Konica Minolta Med & Graphic | Image processing device, image processing method, and image processing program |
| CN116228764A (en) * | 2023-05-08 | 2023-06-06 | 聊城市东昌府区妇幼保健院 | A method and system for detecting the quality of blood film collection for neonatal disease screening |
Also Published As
| Publication number | Publication date |
|---|---|
| US20020181797A1 (en) | 2002-12-05 |
| JP2002369079A (en) | 2002-12-20 |
| US6956975B2 (en) | 2005-10-18 |
| EP1248234A3 (en) | 2004-03-24 |
Similar Documents
| Publication | Publication Date | Title |
|---|---|---|
| US6956975B2 (en) | Method for improving breast cancer diagnosis using mountain-view and contrast-enhancement presentation of mammography | |
| Laine et al. | Wavelets for contrast enhancement of digital mammography | |
| Laine et al. | Mammographic feature enhancement by multiscale analysis | |
| Giger et al. | Image processing and computer-aided diagnosis | |
| US9002134B2 (en) | Multi-scale image normalization and enhancement | |
| McLoughlin et al. | Noise equalization for detection of microcalcification clusters in direct digital mammogram images | |
| Sivaramakrishna et al. | Comparing the performance of mammographic enhancement algorithms: a preference study | |
| Chan et al. | Digitization requirements in mammography: Effects on computer‐aided detection of microcalcifications | |
| Scharcanski et al. | Denoising and enhancing digital mammographic images for visual screening | |
| Vikhe et al. | Mass detection in mammographic images using wavelet processing and adaptive threshold technique | |
| Linguraru et al. | A biologically inspired algorithm for microcalcification cluster detection | |
| Hogeweg et al. | Suppression of translucent elongated structures: applications in chest radiography | |
| JP2002099896A (en) | Abnormal shadow candidate detection method and apparatus | |
| Na'am et al. | Filter technique of medical image on multiple morphological gradient (MMG) method | |
| JP2009512511A (en) | Method for improved visualization of medical images | |
| Nishikawa | Detection of microcalcifications | |
| Guo | Computer-aided detection of breast cancer using ultrasound images | |
| Costaridou et al. | Locally adaptive wavelet contrast enhancement | |
| Stefanoyiannis | A digital density equalization technique to improve visualization of breast periphery in mammography | |
| Vidhyalakshmi et al. | Image Enhancement of Metastasis And Acrometastasis Images Using Clahe With Weiner Filter | |
| Snoeren et al. | Thickness correction of mammographic images by anisotropic filtering and interpolation of dense tissue | |
| Burhan et al. | Improved methods for mammogram breast cancer using by denoising filtering | |
| Costaridou et al. | Evaluating the effect of a wavelet enhancement method in characterization of simulated lesions embedded in dense breast parenchyma | |
| Singh et al. | Computer Assisted Health Care Framework for Breast Cancer Detection in Digital Mammograms | |
| Singh et al. | Quantitative evaluation of denoising techniques of lung computed tomography images: an experimental investigation |
Legal Events
| Date | Code | Title | Description |
|---|---|---|---|
| PUAI | Public reference made under article 153(3) epc to a published international application that has entered the european phase |
Free format text: ORIGINAL CODE: 0009012 |
|
| AK | Designated contracting states |
Kind code of ref document: A2 Designated state(s): AT BE CH CY DE DK ES FI FR GB GR IE IT LI LU MC NL PT SE TR |
|
| AX | Request for extension of the european patent |
Free format text: AL;LT;LV;MK;RO;SI |
|
| PUAL | Search report despatched |
Free format text: ORIGINAL CODE: 0009013 |
|
| AK | Designated contracting states |
Kind code of ref document: A3 Designated state(s): AT BE CH CY DE DK ES FI FR GB GR IE IT LI LU MC NL PT SE TR |
|
| AX | Request for extension of the european patent |
Extension state: AL LT LV MK RO SI |
|
| 17P | Request for examination filed |
Effective date: 20040726 |
|
| AKX | Designation fees paid |
Designated state(s): DE FR GB |
|
| 17Q | First examination report despatched |
Effective date: 20041105 |
|
| RAP1 | Party data changed (applicant data changed or rights of an application transferred) |
Owner name: CARESTREAM HEALTH, INC. |
|
| STAA | Information on the status of an ep patent application or granted ep patent |
Free format text: STATUS: THE APPLICATION IS DEEMED TO BE WITHDRAWN |
|
| 18D | Application deemed to be withdrawn |
Effective date: 20091001 |