EP1205742B1 - Automated classification of cellular structures - Google Patents
Automated classification of cellular structures Download PDFInfo
- Publication number
- EP1205742B1 EP1205742B1 EP20010123216 EP01123216A EP1205742B1 EP 1205742 B1 EP1205742 B1 EP 1205742B1 EP 20010123216 EP20010123216 EP 20010123216 EP 01123216 A EP01123216 A EP 01123216A EP 1205742 B1 EP1205742 B1 EP 1205742B1
- Authority
- EP
- European Patent Office
- Prior art keywords
- structures
- image
- subcellular structures
- neural network
- classes
- Prior art date
- Legal status (The legal status is an assumption and is not a legal conclusion. Google has not performed a legal analysis and makes no representation as to the accuracy of the status listed.)
- Expired - Lifetime
Links
Classifications
-
- G—PHYSICS
- G06—COMPUTING OR CALCULATING; COUNTING
- G06T—IMAGE DATA PROCESSING OR GENERATION, IN GENERAL
- G06T7/00—Image analysis
- G06T7/0002—Inspection of images, e.g. flaw detection
- G06T7/0012—Biomedical image inspection
Definitions
- the present invention relates to the detection and classification of subcellular structures by a machine learning approach.
- this invention relates to the recognition of fluorescently labeled proteins forming specific patterns in cells by classifiers which were trained by a supervised neural network learning approach.
- GFP green fluorescence protein
- GFP expression can be used to monitor gene expression and protein localization in living organisms (Chalfie et al., 1994).
- the coding GFP fusion vectors are then transfected en masse into eukaryotic or prokaryotic cells and expression is analyzed in living cells at various time points after transfection and the localizations are recorded (Ding et al., 2000; Rolls et al., 1999). Screening thousands of GFP-fusion protein libraries is a useful approach for identifying and visualizing components of subcellular structures and their associated dynamics.
- neural networks implies, it was originally aimed more towards modeling networks of real neurons in the brain.
- a simple model of a neuron as a binary threshold unit was proposed already in the forties (McCulloch and Pitts, 1943). Specifically, the model neurons computes a weighted sum of its inputs from other units, and the outputs are a one or zero according to whether this sum is above or below a certain threshold. Focusing on the problem of how to find the appropriate weights for the particular computational task perceptrons were designed in which the units were organized into layers with feed-forward connections between two subsequent layers.
- the present invention classifies cellular structures with the steps of providing data of different subcellular structures and automatically generating classifiers for classifying the different subcellular structures.
- the invention comprises methods and respective systems to detect and identify different subcellular structures by combination of image analysis and a neural network machine learning approach. As a feasibility study, this system was applied for recognition of protein structures in cell compartments or organelles by a neural network trained classifier using back propagation algorithms.
- the invention comprises the feeding of neural networks with fields of different cases, derived from the compressed information of digital images of subcellular structures to gain classifiers with highest accuracies for the detection of different protein structure classes.
- the data from the different subcellular structures is preferably fed into a machine learning system, more preferably a neural network learning system.
- At least one back propagation algorithm is used for generating the classifiers in the neural network learning system.
- a digital image is created with labeled subcellular structures and then analyzed for providing the data of different subcellular structures.
- the information obtained from the analysis is compressed for providing the data of different subcellular structures.
- the subcellular structures to be classified are preferably proteins which are more preferably fluorescently labeled.
- cell nuclei are stained with HISTONE 2B-CFP and corresponding proteins are fused with GFP.
- the nuclear envelope or rim is further preferably identified by a classification algorithm.
- the image is smoothened, thresholds are applied for suppressing background and regions of homogenous image regions are identified.
- New results obtained according to the present invention showed that a special neural network subtype, namely "Radial Base Neural Networks", reached far better results (68.8% instead 54.4% accuracies for the classification of all 12 classes) in much faster training times (5 minutes instead of 3 hours).
- image intensities are preferably fed to the neural network after lossy image.
- compression called reducing "gaussian pyramid
- image features into the classification training ("characteristics" of an image).
- the present invention is based on GFP and derivate mutants enables the visualization process "in vivo", while the prior art shows localization in fixed cells “in vitro”, see claim 12. This implies also a new application with observation over time (time series).
- nuclei HISTONE 2B-CFP preferably an easy automatic identification of the nuclei HISTONE 2B-CFP is used which generates a homogenous staining of the DNA, while in the prior art Hoechst 33258 is used which explains the respective manual identification of nuclei.
- Rotation is therefore introduced into the model through simple image rotation (preferably 3 times 90°), while the prior art uses rotational invariant features constituting a costly complex transform "Zernike transform").
- the present invention has faster classification properties compared to the experiments according to the prior art.
- the invention is particularly advantageous to high throughput systems after intensive training settings.
- An application to in vivo techniques is one step ahead to currently requested setups in proteomics.
- the automatic identification of the nuclei as the center of the subcellular structure is advantageous for a fully automated image classification. New results show much faster training as well.
- a ready-made setup with a ZEISS confocal laser scanning microscope model 510 equipped with a motorized z-stage was used. 20 two dimensional images (512x512, RGB-TIFF images, 8 bit per channel) of 12 different classes were used. Each class represents a specific cell compartment or organelle. The cell nuclei were stained with HISTONE 2B-CFP (Ellenberg, 1998), while the corresponding proteins were fused with green fluorescence protein (GFP). The images were captured in this stage manually at 100x magnification in the above mentioned microscope. The first aim of this project was to identify the nuclear envelope or nuclear rim by robust classification algorithm.
- the digital images were read in and a binomial Gauss filter was used to smoothen the HISTONE 2B-CFP image.
- the Gauss pyramids were calculated with a symmetric 5x5 filter kernel on the first level and a 3x3 mask on the second level. The same 3x3 filter mask was also used for the Laplace pyramids to recalculate the original size of the image by interpolation.
- the Laplace pyramids are derived from the Gauss pyramids by subtracting the smoothed from the unsmoothed image on each level.
- the following steps were written as a C++ code and implemented as a direct link library (dll) in a program environment.
- Definable thresholds were applied to the blue (HISTONE 2B-CFP) and the green (GFP) channel to suppress background.
- a region growing algorithm was applied to identify regions of homogenous image information.
- minimum and maximum object area limits defined the object area range of the HISTONE 2B-CFP stained nuclei.
- the green fluorescence mean values were compared with the background around all found objects. GFP positive cell could be easily recognized by this method.
- the library returns coordinates of the GFP positive cell objects to the program.
- cytoplasm As expected from the visual observation the critical classes are: cytoplasm, endoplasmic reticulum, focal adhesions, Golgi apparatus, microtubules, and plasmamembrane which could not be clearly discriminated in the 12-classes category, while chromatin, cytoplasm/nucleus, nuclear rim, nucleoli, peroxisomes were recognized.
- One critical feature of these structures is the rotation variation and translation. To overcome this problem for the moment and the small number of training cases all images were rotated three times by 90° and stored as new images. By this approach the number of training cases were increased to 904 images, and the test images to 96 images. For an order-independent learning of the neural network the images were shuffled randomly.
- Table 4 904 images as training set, the accuracies for the different categories for different hidden layer setting are shown. 904 train 250-50-classes neurons 200-15-neurons 12-classes 69.0 % (run A) not done 7-classes 74.5 % (run B) not done 6-classes 79.9 % (run C) 77.5 % (run E) 2-classes 95.6 %* (run D) not done *accuracy limit 95%
- Table 5 Averaged accuracies and single accuracies for each class are shown for each run from Table 4 using the 96 test image set.
Landscapes
- Engineering & Computer Science (AREA)
- Quality & Reliability (AREA)
- General Health & Medical Sciences (AREA)
- Medical Informatics (AREA)
- Nuclear Medicine, Radiotherapy & Molecular Imaging (AREA)
- Radiology & Medical Imaging (AREA)
- Health & Medical Sciences (AREA)
- Computer Vision & Pattern Recognition (AREA)
- Physics & Mathematics (AREA)
- General Physics & Mathematics (AREA)
- Theoretical Computer Science (AREA)
- Investigating, Analyzing Materials By Fluorescence Or Luminescence (AREA)
- Investigating Or Analysing Biological Materials (AREA)
- Image Analysis (AREA)
Description
- The present invention relates to the detection and classification of subcellular structures by a machine learning approach. In particular, this invention relates to the recognition of fluorescently labeled proteins forming specific patterns in cells by classifiers which were trained by a supervised neural network learning approach.
- Cell biology is the study of biological processes in cells and their mechanism. At the core of this science the behavior of proteins plays a major role in biochemical pathways of the cell. New protein labeling techniques have facilitated the localization of proteins in cells. At the end of the genome discovery era, the functional analysis of gene coded proteins becomes more and more important. Therefore the localization, mobility, and dynamics of proteins in the cell are of great interest.
- Over the past few years, the techniques to prepare mRNA from different cell types were commonly used to obtain cDNA for expression profiling studies. New high-capacity cloning and expression strategy allow the systematic acquisition and screening of functional data of novel cDNA. Therefore, the appropriated cloning vector containing the encoded protein are ligated with green fluorescence protein (GFP) (Cutler et al., 2000). Aequorea victoria green fluorescent protein (GFP) produces a fluorescent product when expressed in prokaryotic or eukaryotic cells (Prasher et al., 1992). Because exogenous substrates and cofactors are not required for this fluorescence, GFP expression can be used to monitor gene expression and protein localization in living organisms (Chalfie et al., 1994). The coding GFP fusion vectors are then transfected en masse into eukaryotic or prokaryotic cells and expression is analyzed in living cells at various time points after transfection and the localizations are recorded (Ding et al., 2000; Rolls et al., 1999). Screening thousands of GFP-fusion protein libraries is a useful approach for identifying and visualizing components of subcellular structures and their associated dynamics.
- If any strategy for large scale functional analysis of ORF (open reading frames) and encoded proteins is to be initiated, it is evident that the methods need to have the potential to be automated. Therefore, one of the major issues which must be resolved beside the biological and methodical needs is the availability and application of robust pattern recognition algorithms to overcome tedious and error-prone manual screening by technical personnel. In the last three years high-throughput scanning microscopes have been developed to automate the visual screening of tissues, DNA, and protein structures (Davis et al., 1998; Hanzel et al., 1999; Joo et al., 1999; Ward and Carey, 1999). Also from the side of microscope system providers great efforts are made to improve such automatic scanning devices. It would be very useful to provide trained classifiers in such scanning device which could automatically recognize and classify the different subcellular structures in high-throughput scanning microscopes.
- Today's research in neural computation is largely motivated by the possibility of making artificial computing networks. The term "neural networks" implies, it was originally aimed more towards modeling networks of real neurons in the brain. A simple model of a neuron as a binary threshold unit was proposed already in the forties (McCulloch and Pitts, 1943). Specifically, the model neurons computes a weighted sum of its inputs from other units, and the outputs are a one or zero according to whether this sum is above or below a certain threshold. Focusing on the problem of how to find the appropriate weights for the particular computational task perceptrons were designed in which the units were organized into layers with feed-forward connections between two subsequent layers. For the simplest class of perceptrons without any intermediate layer it was possible to prove the convergence of learning algorithms, a way to change the weights iteratively so that a desired computation was performed (Rosenblatt, 1962). An algorithm known as back propagation has been developed for adjusting the weights connecting units in successive layers of multi-layer perceptrons (Werbos, 1974). Back propagation neural network classification is applied in many different fields in life technology and is already used in various task of image analysis, i.e. chromosome classification (Cho, 2000), flow cytrometry (Frankel et al., 1996), histology (Hanzel et al., 1999), ECG pattern (Marabini and Carazo, 1994), immunoelectrophoretic pattern (Sondergaard et al., 1992), or rRNA sequences (Wu and Shivakumar, 1994).
- It is the object underlying the present invention to provide an improved automated classification of cellular structures.
- This object is achieved with the subject-matter as recited in independent claims 1, 12, 13 and 14. In particular, the present invention classifies cellular structures with the steps of providing data of different subcellular structures and automatically generating classifiers for classifying the different subcellular structures.
- The invention comprises methods and respective systems to detect and identify different subcellular structures by combination of image analysis and a neural network machine learning approach. As a feasibility study, this system was applied for recognition of protein structures in cell compartments or organelles by a neural network trained classifier using back propagation algorithms. The invention comprises the feeding of neural networks with fields of different cases, derived from the compressed information of digital images of subcellular structures to gain classifiers with highest accuracies for the detection of different protein structure classes.
- "Classes" are defined in reference to subcellular compartments or structures such as chromatin, cytoplasm/nucleus, cytoplasm, endoplasmic reticulum, focal adhesions, Golgi apparatus, microtubules, mitochondria, nuclear rim, nucleoli, peroxisomes, plasmamembrane.
- "Accuracies" are defined in reference to percentage of correctly classified cases by the neural network classifier;
- "Classifier" in reference to software related information, which can be used in combination with appropriated software programs to classify digital images to classes;
- "Digital images" in reference to any digitally captured image in one, two, three or more dimensions;
- "Fields" in reference to the numerical or symbolic values of the multi-dimensional image;
- "Compressed information" in reference to the essential image information generated by digital image preprocessing techniques; and
- "Cases" in reference to one digital image assigned to one of the classes.
- For the generation of classifiers the data from the different subcellular structures is preferably fed into a machine learning system, more preferably a neural network learning system.
- In another preferred embodiment of the present invention at least one back propagation algorithm is used for generating the classifiers in the neural network learning system.
- Even more preferably subcellular structures are first labeled and then analyzed for providing the data of different subcellular structures.
- According to a further preferred embodiment a digital image is created with labeled subcellular structures and then analyzed for providing the data of different subcellular structures.
- More preferably, the information obtained from the analysis is compressed for providing the data of different subcellular structures.
- The subcellular structures to be classified are preferably proteins which are more preferably fluorescently labeled.
- More preferably, cell nuclei are stained with HISTONE 2B-CFP and corresponding proteins are fused with GFP.
- After the labeling step and the creation of an image step the nuclear envelope or rim is further preferably identified by a classification algorithm.
- More preferably, the image is smoothened, thresholds are applied for suppressing background and regions of homogenous image regions are identified.
- New results obtained according to the present invention showed that a special neural network subtype, namely "Radial Base Neural Networks", reached far better results (68.8% instead 54.4% accuracies for the classification of all 12 classes) in much faster training times (5 minutes instead of 3 hours).
- According to the present invention, image intensities are preferably fed to the neural network after lossy image. In contrast to the prior art, compression (called reducing "gaussian pyramid) which is still an "image" is done, while the prior art teaches to feed calculated image features into the classification training ("characteristics" of an image).
- Due to the fact that image features are used in the prior art normalization procedures are needed and feature selection is appropriate which leads to longer preprocessing times, not necessary according to the present invention.
- The present invention is based on GFP and derivate mutants enables the visualization process "in vivo", while the prior art shows localization in fixed cells "in vitro", see claim 12. This implies also a new application with observation over time (time series).
- According to the present invention preferably an easy automatic identification of the nuclei HISTONE 2B-CFP is used which generates a homogenous staining of the DNA, while in the prior art Hoechst 33258 is used which explains the respective manual identification of nuclei.
- Some of the subcellular structures are rotational variant. Rotation is therefore introduced into the model through simple image rotation (preferably 3 times 90°), while the prior art uses rotational invariant features constituting a costly complex transform "Zernike transform").
- In conclusion the present invention has faster classification properties compared to the experiments according to the prior art. Thus, the invention is particularly advantageous to high throughput systems after intensive training settings. An application to in vivo techniques is one step ahead to currently requested setups in proteomics. The automatic identification of the nuclei as the center of the subcellular structure is advantageous for a fully automated image classification. New results show much faster training as well.
- For the first evaluation a ready-made setup with a ZEISS confocal laser scanning microscope model 510 equipped with a motorized z-stage was used. 20 two dimensional images (512x512, RGB-TIFF images, 8 bit per channel) of 12 different classes were used. Each class represents a specific cell compartment or organelle. The cell nuclei were stained with HISTONE 2B-CFP (Ellenberg, 1998), while the corresponding proteins were fused with green fluorescence protein (GFP). The images were captured in this stage manually at 100x magnification in the above mentioned microscope. The first aim of this project was to identify the nuclear envelope or nuclear rim by robust classification algorithm.
- The digital images were read in and a binomial Gauss filter was used to smoothen the HISTONE 2B-CFP image. The Gauss pyramids were calculated with a symmetric 5x5 filter kernel on the first level and a 3x3 mask on the second level. The same 3x3 filter mask was also used for the Laplace pyramids to recalculate the original size of the image by interpolation. The Laplace pyramids are derived from the Gauss pyramids by subtracting the smoothed from the unsmoothed image on each level.
- The following steps were written as a C++ code and implemented as a direct link library (dll) in a program environment. Definable thresholds were applied to the blue (HISTONE 2B-CFP) and the green (GFP) channel to suppress background. On smoothed and threshold blue images a region growing algorithm was applied to identify regions of homogenous image information. After region growing, minimum and maximum object area limits defined the object area range of the HISTONE 2B-CFP stained nuclei. Then, the green fluorescence mean values were compared with the background around all found objects. GFP positive cell could be easily recognized by this method. The library returns coordinates of the GFP positive cell objects to the program. It turned out that the minimum size of one object for images captured in 100x magnification is around 150x150 pixels, which can of course vary for different cell lines. The program has been used to write out these object images. Before these images were used for further applications, all images were preferably controlled by eye and some images were deleted (around 10% per class).
- The same combination of environment and library was used to convert the images to text files. Another dll code reduced the 150x150 pixel images in size by a 5x5 gaussian filtering to one fifth. This compression of image information step reduced the number of attributes used for subsequent classification. The resulting 900 (150/5x150/5 pixel) gray values were written to a text file with tab delimiters and new lines for each image information. An ID number for each case was prefixed. According to the type of the cell compartment different class numbers were attached (see Table 1).
- In a first trial 226 images with an averaged number of 18 images per class were transferred to the classical neural network (back propagation) of the data mining tool. Two images of each class were set aside as a test set to check the accuracy of the generated classifier after training. From the beginning of the experiment some classes were combined. This rejoining was based on visual similarities in the subcellular structures. Some of this fused classes reflects also biological generalizations, but were not intended.
Table 1 The first column indicates the different biological terms for the structures in the second column. In the last four columns the four different categories with combined classes (except the 12-classes category which reflects the original number of protein classes) are indicated. Cell structure Sample Image 12-classes belong to class 7-classes belong to class 6-classes belong to class 2-classes belong to class Chromatin 
1 1 1 1 Gytoplasm/nucleu 
2 2 2 1 Cytoplasm 
3 3 2 1 Endoplasmic reticulum (ER) 
4 3 2 1 Focal adhesions 
5 4 3 1 Golgi apparatus 
6 4 3 1 Microtubules 
7 5 4 1 Mitochondria 
8 4 3 1 Nuclear rim 
9 9 9 9 Nucleoli 
10 6 5 1 Peroxisome 
11 4 3 1 Plasmamembrane 
12 2 2 1 - The most important setting was done in the "Train Net" model node generating the classifier. This executes a back propagation neural network training. The first trials were made with the default setting in this model node (one hidden layer with 200 neurons). In the next run the accuracy could be increased significantly using two hidden layer with 200 and 15 neurons for the 12-classes category. Furthermore a third layer was introduced equal to the number of classes in the corresponding category (i.e. 250-50-12 neurons in the hidden layer for the 12-classes category). In the following, the accuracy tolerance rates are given (see Table 2 and Table 3).
Table 2 226 images as training set, the accuracies for the different categories for different hidden layer setting are shown. 226 train 200-15 neurons 250-50-classes neurons 12-classes 45.7 % (run A) 56.3 % (run E) 7-classes 68.2 % (run B) not done 6-classes 81.6 % (run C) not done 2-classes 94.0 %* (run D) not done *accuracy limit 95%, instead default 90% to achieve 100 % accuracy in the test Table 3 Average accuracies and single accuracies for each class are shown for each run from Table 2 using the 24 test image set. 24 test run A run E run B run C run D Chromatin (1) 100 % 100 % 100 % 100 % 100 % (1) Cytoplasm/nucleus (2) 100 % 100% 100% (2) 75 % (2) 100 % 1) Cytoplasm (3) 0 % 100 % 25 % (3) 75 % (2) 100 % (1) ER (4) 0 % 0 % 25 % (3) 75 % (2) 100 % (1) Focal adhesions (5) 100 % 0 % 62.5 % (4) 62.5 % (3) 100 % (1) Golgi apparatus (6) 0 % 0 % 62.5 % (4) 62.5 % (3) 100 % (1) Microtubli (7) 0 % 0 % 50 % 0 % 100 % (1) Mitochondria (8) 0 % 0 % 62.5 % (4) 62.5 % (3) 100 % (1) Nuclear Rim (9) 100 % 100 % 100 % 100 % 100 % Nucleoli (10) 100 % 100 % 100 % 100 % 100 % (1) Peroxisome (11) 0 % 50 % 62.5 % (4) 62.5 % (3) 100 % (1) Plasmamembrane (12) 0% 0 % 100 % (2) 75 % (2) 100 % (1) averaged 41.7 % 41.7 % 70.8 % 70.8 % 100 % - The accuracy results were surprisingly high for such a small number of training images. Nevertheless it is recommended to have at least 2300 training cases when 900 fields are calculated. By optimistic estimations, we should have:
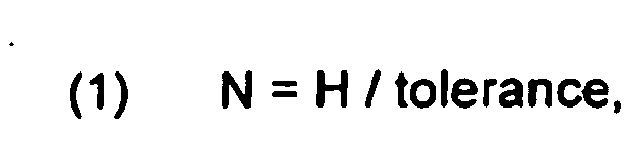

tolerance = 0.2 (i.e. 0.86 will be interpreted as 1 and 0.78 as 0)

- As expected from the visual observation the critical classes are: cytoplasm, endoplasmic reticulum, focal adhesions, Golgi apparatus, microtubules, and plasmamembrane which could not be clearly discriminated in the 12-classes category, while chromatin, cytoplasm/nucleus, nuclear rim, nucleoli, peroxisomes were recognized. One critical feature of these structures is the rotation variation and translation. To overcome this problem for the moment and the small number of training cases all images were rotated three times by 90° and stored as new images. By this approach the number of training cases were increased to 904 images, and the test images to 96 images. For an order-independent learning of the neural network the images were shuffled randomly. With the fourfold amount of training set (904 images) higher accuracies were achieved (see Table 4, Table 5 and Table 6).
Table 4 904 images as training set, the accuracies for the different categories for different hidden layer setting are shown. 904 train 250-50-classes neurons 200-15-neurons 12-classes 69.0 % (run A) not done 7-classes 74.5 % (run B) not done 6-classes 79.9 % (run C) 77.5 % (run E) 2-classes 95.6 %* (run D) not done *accuracy limit 95% Table 5 Averaged accuracies and single accuracies for each class are shown for each run from Table 4 using the 96 test image set. 96 test run A run B run C run E run D Chromatin (1) 100 % 100 % 100 % 100 % 100 % (1) Cytoplasm/nucleus 100 % 100 % (2) 71.9 % (2) 78.1% (2) 100 % (1) (2) Cytoplasm (3) 25 % 43,5 % (3) 71.9 % (2) 78.1 % (2) 100 % (1) ER(4) 0 % 43,5 % (3) 71.9 % (2) 78.1 % (2) 100 % (1) Focal adhesion sites (5) 0 % 75 % (4) 71.9 % (3) 50 % (3) 100 % (1) Golgi apparatus (6) 0 % 75 % (4) 71.9% (2) 50 % (3) 100 % (1) Microtubli (7) 87.5 % 12.5 % 25 % 0 % 100 % (1) Mitochondria (8) 0 % 75 % (4) 71.9 % (3) 50 % (3) 100 % (1) Nuclear Rim (9) 100 % 100 % 100 % 100 % 100 % Nucleoli (10) 100 % 100 % 100 % 100 % 100 % (1) Peroxisomes (11) 62.5 % 75 % (4) 71.9 % (3) 50 % (3) 100 % (1) Plasmamembrane (12) 100 % 100 % (2) 71.9 % (2) 78.1 % (2) 100 % (1) averaged 54.3 % 75 % 75 % 67.5 % 100 % Table 6 Shows the detailed accuracies for each class with the number of correct and wrong classified cases performed the run C (6-classes category) Correct : 72 (75.00%) Wrong : 24 (25.00%) Total : 96 Coincidence Matrix 1 2 3 4 5 9 1 8 0 0 0 0 0 2 0 23 3 6 0 0 3 0 7 23 2 0 0 4 0 1 5 2 0 0 5 0 0 0 0 8 0 9 0 0 0 0 0 8 Performance Evaluation 1 : 2.4849 2 : 0.80012 3 : 0.80012 4 : 0.87547 5 : 2.4849 9 : 2.4849 class : 1 Correct : 8 (100.00%) Wrong : 0 (0.00%) Total : 8 Class : 2 Correct : 23 (71.88%) Wrong : 9 (28.13%) Total : 32 Class : 3 Correct : 23 (71.88%) Wrong : 9 (28.13%) Total : 32 Class : 4 Correct : 2 (25.00%) Wrong : 6 (75.00%) Total : 8 Class : 5 Correct : 8 (100.00%) Wrong : 0 (0.00%) Total : 8 Class : 9 Correct : 8 (100.00%) Wrong : 0 (0.00%) Total : 8 -
- Boland, M.V., M.K. Markey, and R.F.Murphy. 1998. Automated Recognition of Patterns Characteristic of Subcellular Structures in Fluorescence Microscopy Images. Cytometry 33:366-375
- Chaifie, M., Y. Tu, G. Euskirchen, W.W. Ward, and D.C. Prasher. 1994. Green fluorescent protein as a marker for gene expression. Science. 263:802-5.
- Cho, J.M. 2000. Chromosome classification using backpropagation neural networks. IEEE Eng Med Biol Mag. 19:28-33.
- Cutler, S.R., D.W. Ehrhardt, J.S. Griffitts, and C.R. Somerville. 2000. Random GFP::cDNA fusions enable visualization of subcellular structures in cells of Arabidopsis at a high frequency. Proc Natl Acad Sci U S A. 97:3718-23.
- Davis, A.R., K. Meyers, and J.M. Wilson. 1998. High throughput method for creating and screening recombinant adenoviruses. Gene Ther. 5:1148-52.
- Ding, D.Q., Y. Tomita, A. Yamamoto, Y. Chikashige, T. Haraguchi, and Y. Hiraoka. 2000. Large-scale screening of intracellular protein localization in living fission yeast cells by the use of a GFP-fusion genomic DNA library. Genes Cells. 5:169-90.
- Ellenberg, J., Lippincott-Schwartz, J., and Presley, J. F.,. 1998. Two-color green fluorescent protein time-lapse imaging. Biotechniques. 25:838-42, 844-6.
- Frankel, D.S., S.L. Frankel, B.J. Binder, and R.F. Vogt. 1996. Application of neural networks to flow cytometry data analysis and real- time cell classification. Cytometry. 23:290-302.
- Hanzel, D.K., J.Q. Trojanowski, R.F. Johnston, and J.F. Loring. 1999. High-throughput quantitative histological analysis of Alzheimer's disease pathology using a confocal digital microscanner. Nat Biotechnol. 17:53-7.
- Joo, H., A. Arisawa, Z. Lin, and F.H. Arnold. 1999. A high-throughput digital imaging screen for the discovery and directed evolution of oxygenases. Chem Biol. 6:699-706.
- Marabini, R., and J.M. Carazo. 1994. Pattern recognition and classification of images of biological macromolecules using artificial neural networks. Biophys J. 66:1804-14.
- Markey M.K., M.V. Boland, and R.F. Murphy. 1999. Toward Objective Selection of Representative Microscope Images. Biophysical Journal. 76: 2230-2237.
- McCulloch, W.S., and W. Pitts. 1943. A Logical Calculus of Ideas Immanent in Nervous Acitivity. Bulletin of Mathematical Biophysics. 5:115-33.
- Murphy R.F., M.V. Boland, and M. Velliste. 2000. Towards a Systematics for Protein Subcellular Location: Quantitative Description of Protein Localization Patterns and Automated Analysis of Fluorescence Microscop Images. ISMB Conference
- Prasher, D.C., V.K. Eckenrode, W.W. Ward, F.G. Prendergast, and M.J. Cormier. 1992. Primary structure of the Aequorea victoria green-fluorescent protein. Gene. 111:229-33.
- Rolls, M.M., P.A. Stein, S.S. Taylor, E. Ha, F. McKeon, and T.A. Rapoport. 1999. A visual screen of a GFP-fusion library identifies a new type of nuclear envelope membrane protein. J Cell Biol. 146:29-44.
- Rosenblatt, F. 1962. Principles of Neuodynamics. Spartan, New York.
- Sondergaard, I., B.N. Krath, and M. Hagerup. 1992. Classification of crossed immunoelectrophoretic patterns using digital image processing and artificial neural networks. Electrophoresis. 13:411-5.
- Ward, G.E., and K.L. Carey. 1999. 96-Well plates providing high optical resolution for high-throughput, immunofluorescence-based screening of monoclonal antibodies against Toxoplasma gondii. J Immunol Methods. 230:11-8.
- Werbos, P. 1974. Beyond Regression: New Tools for Prediction and Analysis in the Behavioral Sciences. Harvard University.
- Wu, C., and S. Shivakumar. 1994. Back-propagation and counter-propagation neural networks for phylogenetic classification of ribosomal RNA sequences. Nucleic Acids Res. 22:4291-9.
Claims (14)
- Method for classifying cellular structures with the following steps:(a) providing data of different subcellular structures by creating and analyzing a digital image with labeled subcellular structures, wherein the information obtained from the analysis is compressed,(b) automatically generating classifiers for classifying the different subcellular structures, by feeding the data from the different subcellular structures into a machine learning system.
- Method according to claim 1, wherein further data of different subcellular structures is classified according to the classifiers generated in step (b).
- Method according to claim 1 or 2, wherein the machine learning system is a neural network.
- Method according to claim 3, wherein the neural network is a radial base neural network.
- Method according to claim 3 or 4, wherein for generating the classifiers in the neural network a back propagation algorithm is used.
- Method according to at least one of the preceding claims, wherein the subcellular structures to be classified are proteins.
- Method according to claim 6, wherein the proteins are fluorescently labeled.
- Method according to claim 6 or 7, cell nuclei are stained with HISTONE 2B-CFP and corresponding proteins are fused with GFP.
- Method according to at least one of the preceding claims, wherein after creation and analysing said digital image with labelled sub cellules structures the nuclear envelope or rim is identified by a classification algorithm.
- Method according to at least one of the preceding claims, wherein said image is smoothened, thresholds are applied for suppressing background and regions of homogenous image regions are identified.
- Method according to at least one of the preceding claims, wherein a rotation is introduced into the model through simple image rotation.
- Computer program comprising program code means adapted to perform each of the method steps of at least one of the preceding claims when said program is run on a computer.
- Computer readable means embodying a computer program comprising code means that when executed by a data processing system perform each of the method steps of at least one of claims 1-11.
- Computer system comprising means adapted to perform each of the method steps of at least one of claims 1-11.
Priority Applications (1)
| Application Number | Priority Date | Filing Date | Title |
|---|---|---|---|
| EP20010123216 EP1205742B1 (en) | 2000-09-29 | 2001-10-01 | Automated classification of cellular structures |
Applications Claiming Priority (3)
| Application Number | Priority Date | Filing Date | Title |
|---|---|---|---|
| EP00121489 | 2000-09-29 | ||
| EP00121489 | 2000-09-29 | ||
| EP20010123216 EP1205742B1 (en) | 2000-09-29 | 2001-10-01 | Automated classification of cellular structures |
Publications (3)
| Publication Number | Publication Date |
|---|---|
| EP1205742A2 EP1205742A2 (en) | 2002-05-15 |
| EP1205742A3 EP1205742A3 (en) | 2002-09-18 |
| EP1205742B1 true EP1205742B1 (en) | 2006-08-09 |
Family
ID=26071461
Family Applications (1)
| Application Number | Title | Priority Date | Filing Date |
|---|---|---|---|
| EP20010123216 Expired - Lifetime EP1205742B1 (en) | 2000-09-29 | 2001-10-01 | Automated classification of cellular structures |
Country Status (1)
| Country | Link |
|---|---|
| EP (1) | EP1205742B1 (en) |
Cited By (1)
| Publication number | Priority date | Publication date | Assignee | Title |
|---|---|---|---|---|
| CN108389198A (en) * | 2018-02-27 | 2018-08-10 | 深思考人工智能机器人科技(北京)有限公司 | The recognition methods of atypia exception gland cell in a kind of Cervical smear |
Families Citing this family (3)
| Publication number | Priority date | Publication date | Assignee | Title |
|---|---|---|---|---|
| DE102005021034B4 (en) * | 2005-05-06 | 2012-09-13 | Fraunhofer-Gesellschaft zur Förderung der angewandten Forschung e.V. | Method for culturing a cell culture in an automated cell culture system and automated cell culture system |
| CN111242922A (en) * | 2020-01-13 | 2020-06-05 | 上海极链网络科技有限公司 | Protein image classification method, device, equipment and medium |
| CN113008860B (en) * | 2021-04-25 | 2023-04-18 | 广东工业大学 | Blood fat classification method, system, storage medium and computer equipment |
Family Cites Families (1)
| Publication number | Priority date | Publication date | Assignee | Title |
|---|---|---|---|---|
| US5692107A (en) * | 1994-03-15 | 1997-11-25 | Lockheed Missiles & Space Company, Inc. | Method for generating predictive models in a computer system |
-
2001
- 2001-10-01 EP EP20010123216 patent/EP1205742B1/en not_active Expired - Lifetime
Cited By (1)
| Publication number | Priority date | Publication date | Assignee | Title |
|---|---|---|---|---|
| CN108389198A (en) * | 2018-02-27 | 2018-08-10 | 深思考人工智能机器人科技(北京)有限公司 | The recognition methods of atypia exception gland cell in a kind of Cervical smear |
Also Published As
| Publication number | Publication date |
|---|---|
| EP1205742A3 (en) | 2002-09-18 |
| EP1205742A2 (en) | 2002-05-15 |
Similar Documents
| Publication | Publication Date | Title |
|---|---|---|
| US7949181B2 (en) | Segmentation of tissue images using color and texture | |
| CN109492706B (en) | Chromosome classification prediction device based on recurrent neural network | |
| Djemame et al. | Solving reverse emergence with quantum PSO application to image processing: S. Djemame et al. | |
| CN114749342A (en) | Method, device and medium for identifying coating defects of lithium battery pole piece | |
| US20240395059A1 (en) | System and method for generating a morphological atlas of an embryo | |
| US20210366594A1 (en) | Method and system for refining label information | |
| CN113744195A (en) | Deep learning-based automatic detection method for hRPE cell microtubules | |
| CN115984631A (en) | A virtual staining method for unlabeled cell transmitted light microscopic images based on deep learning automatic optimization | |
| EP1922695A1 (en) | Method of, and apparatus and computer software for, performing image processing | |
| Elsalamony | Detection of anaemia disease in human red blood cells using cell signature, neural networks and SVM | |
| Okabe | Recent advances in computational methods for measurement of dendritic spines imaged by light microscopy | |
| CN120932233A (en) | Method and system for recognizing blood cell image based on multiscale ViT model | |
| CN116597895B (en) | A protein subcellular localization method based on graph convolutional neural network | |
| Jose et al. | End-to-end classification of cell-cycle stages with center-cell focus tracker using recurrent neural networks | |
| DE102022131444A1 (en) | Method for identifying analytes in an image sequence | |
| EP1205742A2 (en) | Automated classification of cellular structures | |
| EP4379676B1 (en) | Detection system, detection apparatus, learning apparatus, detection method, learning method and program | |
| Kakadiaris et al. | Landmark-driven, atlas-based segmentation of mouse brain tissue images containing gene expression data | |
| DE60122090T2 (en) | Automatic classification of cell structures | |
| Masurkar et al. | Human protein subcellular localization using convolutional neural network as feature extractor | |
| Lemmens et al. | Advanced microscopy techniques for quantitative analysis in neuromorphology and neuropathology research: current status and requirements for the future | |
| Tscherepanow et al. | An incremental approach to automated protein localisation | |
| Huque | Shape Analysis and Measurement for the HeLa cell classification of cultured cells in high throughput screening | |
| Lv et al. | Automated nanoparticle count via modified blendmask instance segmentation on sem images | |
| Goytom et al. | Nanoscale microscopy images colorization using neural networks |
Legal Events
| Date | Code | Title | Description |
|---|---|---|---|
| PUAI | Public reference made under article 153(3) epc to a published international application that has entered the european phase |
Free format text: ORIGINAL CODE: 0009012 |
|
| AK | Designated contracting states |
Kind code of ref document: A2 Designated state(s): AT BE CH CY DE DK ES FI FR GB GR IE IT LI LU MC NL PT SE TR |
|
| AX | Request for extension of the european patent |
Free format text: AL;LT;LV;MK;RO;SI |
|
| PUAL | Search report despatched |
Free format text: ORIGINAL CODE: 0009013 |
|
| AK | Designated contracting states |
Kind code of ref document: A3 Designated state(s): AT BE CH CY DE DK ES FI FR GB GR IE IT LI LU MC NL PT SE TR |
|
| AX | Request for extension of the european patent |
Free format text: AL;LT;LV;MK;RO;SI |
|
| 17P | Request for examination filed |
Effective date: 20021028 |
|
| 17Q | First examination report despatched |
Effective date: 20030120 |
|
| AKX | Designation fees paid |
Designated state(s): AT BE CH CY DE DK ES FI FR GB GR IE IT LI LU MC NL PT SE TR |
|
| GRAP | Despatch of communication of intention to grant a patent |
Free format text: ORIGINAL CODE: EPIDOSNIGR1 |
|
| GRAC | Information related to communication of intention to grant a patent modified |
Free format text: ORIGINAL CODE: EPIDOSCIGR1 |
|
| GRAS | Grant fee paid |
Free format text: ORIGINAL CODE: EPIDOSNIGR3 |
|
| GRAA | (expected) grant |
Free format text: ORIGINAL CODE: 0009210 |
|
| AK | Designated contracting states |
Kind code of ref document: B1 Designated state(s): AT BE CH CY DE DK ES FI FR GB GR IE IT LI LU MC NL PT SE TR |
|
| PG25 | Lapsed in a contracting state [announced via postgrant information from national office to epo] |
Ref country code: IT Free format text: LAPSE BECAUSE OF FAILURE TO SUBMIT A TRANSLATION OF THE DESCRIPTION OR TO PAY THE FEE WITHIN THE PRESCRIBED TIME-LIMIT;WARNING: LAPSES OF ITALIAN PATENTS WITH EFFECTIVE DATE BEFORE 2007 MAY HAVE OCCURRED AT ANY TIME BEFORE 2007. THE CORRECT EFFECTIVE DATE MAY BE DIFFERENT FROM THE ONE RECORDED. Effective date: 20060809 Ref country code: FI Free format text: LAPSE BECAUSE OF FAILURE TO SUBMIT A TRANSLATION OF THE DESCRIPTION OR TO PAY THE FEE WITHIN THE PRESCRIBED TIME-LIMIT Effective date: 20060809 Ref country code: AT Free format text: LAPSE BECAUSE OF FAILURE TO SUBMIT A TRANSLATION OF THE DESCRIPTION OR TO PAY THE FEE WITHIN THE PRESCRIBED TIME-LIMIT Effective date: 20060809 Ref country code: CH Free format text: LAPSE BECAUSE OF FAILURE TO SUBMIT A TRANSLATION OF THE DESCRIPTION OR TO PAY THE FEE WITHIN THE PRESCRIBED TIME-LIMIT Effective date: 20060809 Ref country code: BE Free format text: LAPSE BECAUSE OF FAILURE TO SUBMIT A TRANSLATION OF THE DESCRIPTION OR TO PAY THE FEE WITHIN THE PRESCRIBED TIME-LIMIT Effective date: 20060809 Ref country code: NL Free format text: LAPSE BECAUSE OF FAILURE TO SUBMIT A TRANSLATION OF THE DESCRIPTION OR TO PAY THE FEE WITHIN THE PRESCRIBED TIME-LIMIT Effective date: 20060809 Ref country code: LI Free format text: LAPSE BECAUSE OF FAILURE TO SUBMIT A TRANSLATION OF THE DESCRIPTION OR TO PAY THE FEE WITHIN THE PRESCRIBED TIME-LIMIT Effective date: 20060809 |
|
| REG | Reference to a national code |
Ref country code: GB Ref legal event code: FG4D |
|
| REG | Reference to a national code |
Ref country code: CH Ref legal event code: EP |
|
| REG | Reference to a national code |
Ref country code: IE Ref legal event code: FG4D |
|
| REF | Corresponds to: |
Ref document number: 60122090 Country of ref document: DE Date of ref document: 20060921 Kind code of ref document: P |
|
| PG25 | Lapsed in a contracting state [announced via postgrant information from national office to epo] |
Ref country code: IE Free format text: LAPSE BECAUSE OF NON-PAYMENT OF DUE FEES Effective date: 20061002 |
|
| PG25 | Lapsed in a contracting state [announced via postgrant information from national office to epo] |
Ref country code: MC Free format text: LAPSE BECAUSE OF NON-PAYMENT OF DUE FEES Effective date: 20061031 |
|
| PG25 | Lapsed in a contracting state [announced via postgrant information from national office to epo] |
Ref country code: SE Free format text: LAPSE BECAUSE OF FAILURE TO SUBMIT A TRANSLATION OF THE DESCRIPTION OR TO PAY THE FEE WITHIN THE PRESCRIBED TIME-LIMIT Effective date: 20061109 Ref country code: DK Free format text: LAPSE BECAUSE OF FAILURE TO SUBMIT A TRANSLATION OF THE DESCRIPTION OR TO PAY THE FEE WITHIN THE PRESCRIBED TIME-LIMIT Effective date: 20061109 |
|
| PG25 | Lapsed in a contracting state [announced via postgrant information from national office to epo] |
Ref country code: ES Free format text: LAPSE BECAUSE OF FAILURE TO SUBMIT A TRANSLATION OF THE DESCRIPTION OR TO PAY THE FEE WITHIN THE PRESCRIBED TIME-LIMIT Effective date: 20061120 |
|
| PG25 | Lapsed in a contracting state [announced via postgrant information from national office to epo] |
Ref country code: PT Free format text: LAPSE BECAUSE OF FAILURE TO SUBMIT A TRANSLATION OF THE DESCRIPTION OR TO PAY THE FEE WITHIN THE PRESCRIBED TIME-LIMIT Effective date: 20070109 |
|
| NLV1 | Nl: lapsed or annulled due to failure to fulfill the requirements of art. 29p and 29m of the patents act | ||
| REG | Reference to a national code |
Ref country code: CH Ref legal event code: PL |
|
| ET | Fr: translation filed | ||
| PLBE | No opposition filed within time limit |
Free format text: ORIGINAL CODE: 0009261 |
|
| STAA | Information on the status of an ep patent application or granted ep patent |
Free format text: STATUS: NO OPPOSITION FILED WITHIN TIME LIMIT |
|
| 26N | No opposition filed |
Effective date: 20070510 |
|
| PG25 | Lapsed in a contracting state [announced via postgrant information from national office to epo] |
Ref country code: GR Free format text: LAPSE BECAUSE OF FAILURE TO SUBMIT A TRANSLATION OF THE DESCRIPTION OR TO PAY THE FEE WITHIN THE PRESCRIBED TIME-LIMIT Effective date: 20061110 |
|
| PG25 | Lapsed in a contracting state [announced via postgrant information from national office to epo] |
Ref country code: TR Free format text: LAPSE BECAUSE OF FAILURE TO SUBMIT A TRANSLATION OF THE DESCRIPTION OR TO PAY THE FEE WITHIN THE PRESCRIBED TIME-LIMIT Effective date: 20060809 Ref country code: LU Free format text: LAPSE BECAUSE OF NON-PAYMENT OF DUE FEES Effective date: 20061001 |
|
| PG25 | Lapsed in a contracting state [announced via postgrant information from national office to epo] |
Ref country code: CY Free format text: LAPSE BECAUSE OF FAILURE TO SUBMIT A TRANSLATION OF THE DESCRIPTION OR TO PAY THE FEE WITHIN THE PRESCRIBED TIME-LIMIT Effective date: 20060809 |
|
| PGFP | Annual fee paid to national office [announced via postgrant information from national office to epo] |
Ref country code: DE Payment date: 20081128 Year of fee payment: 8 |
|
| PGFP | Annual fee paid to national office [announced via postgrant information from national office to epo] |
Ref country code: FR Payment date: 20081024 Year of fee payment: 8 |
|
| PGFP | Annual fee paid to national office [announced via postgrant information from national office to epo] |
Ref country code: GB Payment date: 20081028 Year of fee payment: 8 |
|
| REG | Reference to a national code |
Ref country code: FR Ref legal event code: ST Effective date: 20100630 |
|
| PG25 | Lapsed in a contracting state [announced via postgrant information from national office to epo] |
Ref country code: FR Free format text: LAPSE BECAUSE OF NON-PAYMENT OF DUE FEES Effective date: 20091102 Ref country code: DE Free format text: LAPSE BECAUSE OF NON-PAYMENT OF DUE FEES Effective date: 20100501 |
|
| PG25 | Lapsed in a contracting state [announced via postgrant information from national office to epo] |
Ref country code: GB Free format text: LAPSE BECAUSE OF NON-PAYMENT OF DUE FEES Effective date: 20091001 |