EP1205143A2 - Method and apparatus for displaying physiological patient data - Google Patents
Method and apparatus for displaying physiological patient data Download PDFInfo
- Publication number
- EP1205143A2 EP1205143A2 EP01309548A EP01309548A EP1205143A2 EP 1205143 A2 EP1205143 A2 EP 1205143A2 EP 01309548 A EP01309548 A EP 01309548A EP 01309548 A EP01309548 A EP 01309548A EP 1205143 A2 EP1205143 A2 EP 1205143A2
- Authority
- EP
- European Patent Office
- Prior art keywords
- data
- physiological
- waveform
- patient data
- displaying
- Prior art date
- Legal status (The legal status is an assumption and is not a legal conclusion. Google has not performed a legal analysis and makes no representation as to the accuracy of the status listed.)
- Ceased
Links
Images


Classifications
-
- A—HUMAN NECESSITIES
- A61—MEDICAL OR VETERINARY SCIENCE; HYGIENE
- A61B—DIAGNOSIS; SURGERY; IDENTIFICATION
- A61B5/00—Measuring for diagnostic purposes; Identification of persons
- A61B5/24—Detecting, measuring or recording bioelectric or biomagnetic signals of the body or parts thereof
- A61B5/316—Modalities, i.e. specific diagnostic methods
- A61B5/318—Heart-related electrical modalities, e.g. electrocardiography [ECG]
- A61B5/339—Displays specially adapted therefor
Definitions
- the invention relates to a method and apparatus for displaying physiological patient data from a cyclic physiological waveform, and particularly, to a method and apparatus for displaying physiological patient data from a cyclic physiological waveform in a colorized three-dimensional representation.
- Medical patient monitors are typically employed by physicians and other health care providers to monitor the physiological data of patients in operating rooms, intensive care units and emergency rooms, and for conducting long-term trend monitoring such as Holter monitoring or stress testing.
- An array of sensors are typically connected to the patient to acquire the various physiological data. These data are then displayed on the screen of a monitor either in graphical or numerical form. These data may also be recorded or displayed on analog or digital strip chart recorders, spreadsheets and plotting programs.
- the invention provides a method of displaying physiological and/or pathological patient data from a cyclic physiological or pathological waveform.
- physiological data or “physiological patient data” shall be broadly defined as including pathological data, or any other type of patient information that is capable of being displayed using the invention.
- the method includes acquiring the physiological patient data, storing the physiological patient data in a waveform array, and displaying the physiological patient data on a display with a color component that is capable of plotting a three dimensional representation of the data.
- the display represents a three dimensional graph by stacking two dimensional waveforms offset of each other to denote perspective or depth.
- This method of displaying allows the operator to view a two dimensional image that represents a three dimensional image.
- the "X coordinate” shall denote the respective position of each data point with respect to time
- the "Y coordinate” shall denote the amplitude of each data point
- the "Z coordinate” shall denote the respective temporal alignment, or offset position of each successive waveform.
- the step of displaying the physiological patient data includes parsing the waveform array into a series of successive waveforms such that each successive waveform is plotted in a temporal alignment to allow easy detection of long term trends in physiological data, parsing each successive waveform into a series of successive data points such that each data point is plotted at a representative X coordinate, Y coordinate, and Z coordinate, and assigning a color (which may be a shade of gray in the case of a black and white monitor or a variation in intensity in the case of a monochrome monitor) according to the amplitude of the data point.
- the waveform array may be physiological data that represents individual physiological cycles such as heart beats, or the waveform array may be data that has been aggregated in some fashion such as averaging or filtering, or reduction to a median complex.
- the invention also provides an apparatus for acquiring and displaying physiological patient data.
- the apparatus includes a sensor or a transducer for acquiring physiological patient data from a patient, a processor for receiving the physiological patient data, storing the physiological data in a waveform array, and for generating a waveform display on a display.
- the processor parses the waveform array into a series of successive waveforms, and assigns each successive waveform a respective Z coordinate.
- the processor also divides each waveform into a series of successive data points and assigns each data point a respective X coordinate.
- the processor assigns a color (which may be a shade of gray in the case of a black and white monitor, or a variation in intensity in the case of a monochrome monitor) according to the Y coordinate of the data point and plots the data point on the display monitor so that the pixel at the respective coordinate is energized using that color.
- a color which may be a shade of gray in the case of a black and white monitor, or a variation in intensity in the case of a monochrome monitor
- Fig. 1 illustrates the patient monitoring system 10 of the invention.
- the patient monitoring system 10 acquires and displays physiological patient data from a cyclic physiological waveform. While the monitoring system 10 can be used in connection with any kind of clinical environment, in the preferred embodiment, the monitoring system 10 is for conducting long-term trend monitoring such as in Holter monitoring or stress testing.
- Monitoring system 10 is coupled to the patient 14 by an array of sensors or transducers which may include, for example, electrodes 18 mounted on the patient's chest for determining electrocardiogram and heart rate, an oximetry sensor 22 mounted on the patient's finger for measuring hemoglobin oxygen saturation, a catheter 26 for measuring hemoglobin oxygen saturation in the vena cava in the central venus pressure, an arterial canula 30 for measuring arterial systolic and diastolic pressures, flow meter 34 and a pressure sensor 38 in the endotrachial tube 42 for measuring trachial gas flow, and airway pressure, respectively, and sensors 46 in the patient's mask 50 for measuring the volume percentage of oxygen and CO 2 in the patient's mouth.
- sensors or transducers may include, for example, electrodes 18 mounted on the patient's chest for determining electrocardiogram and heart rate, an oximetry sensor 22 mounted on the patient's finger for measuring hemoglobin oxygen saturation, a catheter 26 for measuring hemoglobin oxygen saturation in the vena cava in the central venus
- the signals derived from the sensors are converted from analog form to digital form by the analog to digital converter 54 and are then provided to a processor 58 that prepares the data for display on display monitor 62.
- the monitor is a conventional computer-style display monitor having a generally rectangular cathode ray tube or CRT (not shown).
- the CRT includes a plurality of pixels. As is known in the art, each pixel is capable of being energized electronically so that the pixel emits light visible to the user of the monitoring system.
- the display monitor 12 is capable of displaying full color pixels, i.e., the display monitor is an RGB color monitor capable of displaying 256 colors or more. In other embodiments however, a black and white display capable of showing black, white and a plurality of gray shades (preferably no less than 64) in between is acceptable.
- color as used in this application is used to indicate either true color or shades of gray as described above unless the context indicates otherwise. Also, while any physiological patient data may be displayed in the format of the preferred embodiment, the invention will be discussed in the context of displaying long-term electrocardiogram ("ECG”) data.
- ECG electrocardiogram
- the ECG data is subjected to (input 2) a software program that averages or "incrementally” averages the data to produce a series of median waveform complexes.
- These median waveform complexes are often separated and visually stacked on a display to provide an easily viewable representation of a significant amount of ECG data.
- FIG. 2 illustrates a flowchart of a method embodying the invention.
- the waveforms (or in the case of the preferred embodiment, the median waveform complexes) are stored in a waveform array, are processed by the software routine stored in the processor 58, and are displayed on the display monitor 62 in a quasi-three-dimensional color display.
- the display includes x, y, and z axes where the x-axis coordinate represents the data point of a given median waveform complex, the y-axis coordinate represents the amplitude of the data point, and the z-axis coordinate represents the median waveform complex.
- the software increments the x coordinate value by one in order to read the next data point and then reads the amplitude of that data point 400.
- the software sets the variable (END POINT) to be the incremented xyz coordinate 500.
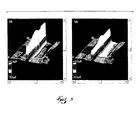
- the processor then draws two triangles between the data points and colors the triangles based on the amplitude color-code 600. While any color code can be used, including gray scale and variations in intensity, the color code of the preferred embodiment is illustrated in Figs. 3(a) and 3(b) in the lower left hand comer of these figures. As shown in Figs. 3(a) and 3(b), the color-code establishes a different color for amplitude values ranging between negative 0.5 millivolts and positive 0.5 millivolts.
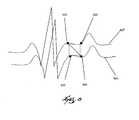
- the software program draws the triangles by establishing a quadrilateral around the START POINT and END POINT variables, 610 and 620, respectively, of the present median beat 625, and the START POINT and END POINT variables 630 and 640, respectively, of the previous median beat 645 with the same X-coordinate value as the START POINT and END POINT variables 610 and 620 (see Fig. 8).
- the software dissects the quadrilateral by establishing a line between the START POINT variable 610 and the END POINT variable 640.
- the color is then set for the display based on the amplitude value of the START POINT variable 610 using the amplitude color-code.
- the software then changes the START POINT variable to END POINT variable 700, and determines whether the data point is the last data point of the present median beat or median complex 800. If not, the software program returns to set the START POINT variable 300 and repeats process steps 300 through 800 until the last data point of the median beat is analyzed. At that point, the software program increments the z coordinate to read the next median beat 900. The software program then determines alternatively whether the median beat is the last median beat of the stress test or whether the data point being analyzed is the last data point of the data set 1000. If not, the software program repeats the process starting at act 200. If so, the software process ends.
- the color scheme of the monitoring system 10 is fully configurable. That is, the user can select any color to represent a given amplitude.
- the monitoring system 10 is programmed to provide the user with a set of manufacturer defined color schemes.
- the successive waveforms are plotted in a stacked colorized representation to provide a perspective or representative three dimensional view of the physiological patient data over an extended period of time.
- This presentation highlights subtle trends that may exist in the data, but are difficult to observe with ordinary display presentations.
- the representative three dimensional view of the data can be rotated by the processor so that it can be viewed on the display by the user from different perspectives.
- the use of color to enhance this display allows easy detection by the clinician of significant aspects of the data, for example, the yellow and orange portions of the data displayed in Fig. 3 indicate a significant S-T depression in the ECG data.
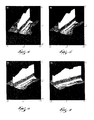
- Figs. 4 - 7 illustrate how the representative three dimensional view of the data can be rotated by the processor so that it can be viewed on the display by the user from different perspectives.
- the processor rotates the representative three dimensional image by rotating the X, Y, and Z axes.
- the operator is able to more easily characterize different segments of the median waveforms. For example, when using median ECG waveforms, the operator may be able to more easily characterize the difference in amplitudes of the median waveforms using a view similar to Fig. 7.
- the operator may rotate the image a full 360 degrees in order to view each side of the image.
Landscapes
- Health & Medical Sciences (AREA)
- Life Sciences & Earth Sciences (AREA)
- Molecular Biology (AREA)
- Surgery (AREA)
- Biophysics (AREA)
- Pathology (AREA)
- Engineering & Computer Science (AREA)
- Biomedical Technology (AREA)
- Heart & Thoracic Surgery (AREA)
- Medical Informatics (AREA)
- Cardiology (AREA)
- Physics & Mathematics (AREA)
- Animal Behavior & Ethology (AREA)
- General Health & Medical Sciences (AREA)
- Public Health (AREA)
- Veterinary Medicine (AREA)
- Measuring And Recording Apparatus For Diagnosis (AREA)
- Measurement And Recording Of Electrical Phenomena And Electrical Characteristics Of The Living Body (AREA)
- Apparatus For Radiation Diagnosis (AREA)
- Magnetic Resonance Imaging Apparatus (AREA)
Abstract
Description
- The invention relates to a method and apparatus for displaying physiological patient data from a cyclic physiological waveform, and particularly, to a method and apparatus for displaying physiological patient data from a cyclic physiological waveform in a colorized three-dimensional representation.
- Medical patient monitors are typically employed by physicians and other health care providers to monitor the physiological data of patients in operating rooms, intensive care units and emergency rooms, and for conducting long-term trend monitoring such as Holter monitoring or stress testing.
- An array of sensors (also commonly called transducers) are typically connected to the patient to acquire the various physiological data. These data are then displayed on the screen of a monitor either in graphical or numerical form. These data may also be recorded or displayed on analog or digital strip chart recorders, spreadsheets and plotting programs.
- In prior patient monitoring systems, and particularly in Holter and stress testing systems, it was found to be advantageous to take a series of successive periods of physiological patient data and cascade the periods in a quasi-three-dimensional display format to render visually obvious the abnormalities attendant to certain physiological conditions. However, this kind of data presentation can become cluttered if too many waveform samples are displayed at any one time. Moreover, some users of the equipment find such a display presentation visually unappealing, notwithstanding the clinical importance of the display technique.
- Accordingly, the invention provides a method of displaying physiological and/or pathological patient data from a cyclic physiological or pathological waveform. Hereinafter, the terms "physiological data" or "physiological patient data" shall be broadly defined as including pathological data, or any other type of patient information that is capable of being displayed using the invention. The method includes acquiring the physiological patient data, storing the physiological patient data in a waveform array, and displaying the physiological patient data on a display with a color component that is capable of plotting a three dimensional representation of the data. Although it is not possible to display a three dimensional graph on a two dimensional display, the display represents a three dimensional graph by stacking two dimensional waveforms offset of each other to denote perspective or depth. This method of displaying allows the operator to view a two dimensional image that represents a three dimensional image. Hereinafter, the "X coordinate" shall denote the respective position of each data point with respect to time, the "Y coordinate" shall denote the amplitude of each data point, and the "Z coordinate" shall denote the respective temporal alignment, or offset position of each successive waveform. In one form of the invention, the step of displaying the physiological patient data includes parsing the waveform array into a series of successive waveforms such that each successive waveform is plotted in a temporal alignment to allow easy detection of long term trends in physiological data, parsing each successive waveform into a series of successive data points such that each data point is plotted at a representative X coordinate, Y coordinate, and Z coordinate, and assigning a color (which may be a shade of gray in the case of a black and white monitor or a variation in intensity in the case of a monochrome monitor) according to the amplitude of the data point. The waveform array may be physiological data that represents individual physiological cycles such as heart beats, or the waveform array may be data that has been aggregated in some fashion such as averaging or filtering, or reduction to a median complex.
- The invention also provides an apparatus for acquiring and displaying physiological patient data. The apparatus includes a sensor or a transducer for acquiring physiological patient data from a patient, a processor for receiving the physiological patient data, storing the physiological data in a waveform array, and for generating a waveform display on a display. The processor parses the waveform array into a series of successive waveforms, and assigns each successive waveform a respective Z coordinate. The processor also divides each waveform into a series of successive data points and assigns each data point a respective X coordinate. Next, the processor assigns a color (which may be a shade of gray in the case of a black and white monitor, or a variation in intensity in the case of a monochrome monitor) according to the Y coordinate of the data point and plots the data point on the display monitor so that the pixel at the respective coordinate is energized using that color.
- It is an advantage of the invention to provide a method and apparatus of displaying amplitude differences of physiological patient data using a gray scale or color display three-dimensional representation.
- An embodiment of the invention will now be described, by way of example, with reference to the accompanying drawings, in which:
- Fig. 1 is a block diagram illustrating a patient monitoring system according to the invention.
- Fig. 2 is a flow chart illustrating the method of the invention.
- Figs. 3(a) and 3(b) are two color illustrations showing three dimensional representations of physiological patient data from a cyclic physiological waveform according to the invention.
- Figs. 4-7 are examples of rotated or animation views of the three dimensional representations according to the invention.
- Fig. 8 is a schematic representation of the method of coloring the display as shown in Figs. 3(a) and 3(b).
-
- Before one embodiment of the invention is explained in full detail, it is to be understood that the invention is not limited in its application to the details of construction and the arrangement of components set forth in the following description or illustrated in the following drawings. The invention is capable of other embodiments and of being practiced or of being carried out in various ways. Also, it is to be understood that the phraseology and terminology used herein is for the purpose of description and should not be regarded as limiting. The use of "including" and "comprising" and variations thereof herein is meant to encompass the items listed thereafter and equivalents thereof as well as additional items.
- Fig. 1 illustrates the
patient monitoring system 10 of the invention. Thepatient monitoring system 10 acquires and displays physiological patient data from a cyclic physiological waveform. While themonitoring system 10 can be used in connection with any kind of clinical environment, in the preferred embodiment, themonitoring system 10 is for conducting long-term trend monitoring such as in Holter monitoring or stress testing.Monitoring system 10 is coupled to thepatient 14 by an array of sensors or transducers which may include, for example, electrodes 18 mounted on the patient's chest for determining electrocardiogram and heart rate, anoximetry sensor 22 mounted on the patient's finger for measuring hemoglobin oxygen saturation, acatheter 26 for measuring hemoglobin oxygen saturation in the vena cava in the central venus pressure, anarterial canula 30 for measuring arterial systolic and diastolic pressures,flow meter 34 and apressure sensor 38 in the endotrachial tube 42 for measuring trachial gas flow, and airway pressure, respectively, andsensors 46 in the patient'smask 50 for measuring the volume percentage of oxygen and CO2 in the patient's mouth. Hereinafter, the terms "sensor" and "transducer" will be used synonymously, and each term will be defined as including the subject matter of the other term. - The signals derived from the sensors are converted from analog form to digital form by the analog to
digital converter 54 and are then provided to a processor 58 that prepares the data for display ondisplay monitor 62. The monitor is a conventional computer-style display monitor having a generally rectangular cathode ray tube or CRT (not shown). The CRT includes a plurality of pixels. As is known in the art, each pixel is capable of being energized electronically so that the pixel emits light visible to the user of the monitoring system. - In the preferred form of the invention, the display monitor 12 is capable of displaying full color pixels, i.e., the display monitor is an RGB color monitor capable of displaying 256 colors or more. In other embodiments however, a black and white display capable of showing black, white and a plurality of gray shades (preferably no less than 64) in between is acceptable. The term "color" as used in this application is used to indicate either true color or shades of gray as described above unless the context indicates otherwise. Also, while any physiological patient data may be displayed in the format of the preferred embodiment, the invention will be discussed in the context of displaying long-term electrocardiogram ("ECG") data. As is commonly known in the art, the ECG data is subjected to (input 2) a software program that averages or "incrementally" averages the data to produce a series of median waveform complexes. These median waveform complexes are often separated and visually stacked on a display to provide an easily viewable representation of a significant amount of ECG data.
- Figure 2 illustrates a flowchart of a method embodying the invention. The waveforms (or in the case of the preferred embodiment, the median waveform complexes) are stored in a waveform array, are processed by the software routine stored in the processor 58, and are displayed on the
display monitor 62 in a quasi-three-dimensional color display. The display includes x, y, and z axes where the x-axis coordinate represents the data point of a given median waveform complex, the y-axis coordinate represents the amplitude of the data point, and the z-axis coordinate represents the median waveform complex. - The processor sets the current waveform count to the first waveform in the waveform array, i.e., the processor initializes the z coordinate 100 (Z = 0). The processor then initializes the x coordinate counter (X = 0) and reads the amplitude of the first data sample 200. The processor then sets a variable (START POINT) to be the present data point (which at the beginning of the process is X = 0; Y = present amplitude value; and Z = 0) 300. The software then increments the x coordinate value by one in order to read the next data point and then reads the amplitude of that data point 400. Next the software sets the variable (END POINT) to be the incremented xyz coordinate 500. The processor then draws two triangles between the data points and colors the triangles based on the amplitude color-code 600. While any color code can be used, including gray scale and variations in intensity, the color code of the preferred embodiment is illustrated in Figs. 3(a) and 3(b) in the lower left hand comer of these figures. As shown in Figs. 3(a) and 3(b), the color-code establishes a different color for amplitude values ranging between negative 0.5 millivolts and positive 0.5 millivolts. The software program draws the triangles by establishing a quadrilateral around the START POINT and END POINT variables, 610 and 620, respectively, of the present
median beat 625, and the START POINT andEND POINT variables median beat 645 with the same X-coordinate value as the START POINT andEND POINT variables 610 and 620 (see Fig. 8). Next, the software dissects the quadrilateral by establishing a line between theSTART POINT variable 610 and the ENDPOINT variable 640. The color is then set for the display based on the amplitude value of theSTART POINT variable 610 using the amplitude color-code. The software then changes the START POINT variable to END POINT variable 700, and determines whether the data point is the last data point of the present median beat or median complex 800. If not, the software program returns to set the START POINT variable 300 and repeats process steps 300 through 800 until the last data point of the median beat is analyzed. At that point, the software program increments the z coordinate to read the next median beat 900. The software program then determines alternatively whether the median beat is the last median beat of the stress test or whether the data point being analyzed is the last data point of the data set 1000. If not, the software program repeats the process starting at act 200. If so, the software process ends. - In the preferred form of the invention, the color scheme of the
monitoring system 10 is fully configurable. That is, the user can select any color to represent a given amplitude. Alternatively, themonitoring system 10 is programmed to provide the user with a set of manufacturer defined color schemes. In the preferred form of the invention, there is graphical and numerical information generated on the display to indicate the corresponding voltage level of displacement for each color used. - As shown in Fig. 3, the successive waveforms are plotted in a stacked colorized representation to provide a perspective or representative three dimensional view of the physiological patient data over an extended period of time. This presentation highlights subtle trends that may exist in the data, but are difficult to observe with ordinary display presentations. In a preferred form of the invention, the representative three dimensional view of the data can be rotated by the processor so that it can be viewed on the display by the user from different perspectives. The use of color to enhance this display allows easy detection by the clinician of significant aspects of the data, for example, the yellow and orange portions of the data displayed in Fig. 3 indicate a significant S-T depression in the ECG data.
- Figs. 4 - 7 illustrate how the representative three dimensional view of the data can be rotated by the processor so that it can be viewed on the display by the user from different perspectives. Essentially, the processor rotates the representative three dimensional image by rotating the X, Y, and Z axes. As the image rotates, the operator is able to more easily characterize different segments of the median waveforms. For example, when using median ECG waveforms, the operator may be able to more easily characterize the difference in amplitudes of the median waveforms using a view similar to Fig. 7. The operator may rotate the image a full 360 degrees in order to view each side of the image.
- For completeness, various aspects of the invention are set out in the following number clauses:
- 1. A method of displaying physiological patient data from a cyclic physiological
waveform, the patient data including a plurality of data points, each data point
representing the amplitude of the physiological patient data, the method comprising
the acts of:
- acquiring the physiological patient data; and
- displaying the physiological patient data in a three dimensional representation (100, 200, 300, 400, 500, 600, 700, 800, 900, 1000).
- 2. A method as set forth in
clause 1, wherein the physiological data is electrocardiogram data. - 3. A method as set forth in
clause 1, wherein the physiological data is blood pressure data. - 4. A method as set forth in
clause 1, wherein the physiological data is cardiac output data. - 5. A method as set forth in
clause 1, wherein the physiological data is pulse oximetry data. - 6. A method as set forth in
clause 1, and further comprising the acts of storing the physiological patient data in a memory array. - 7. A method as set forth in clause 6, wherein the memory array is a waveform array.
- 8. A method as set forth in
clause 1, and further comprising the acts of parsing the physiological patient data into a series of waveforms. - 9. A method as set forth in clause 8, wherein the series of waveforms are median waveforms.
- 10. A method as set forth in clause 8, wherein the act of displaying includes the act of plotting the parsed waveforms in a temporal alignment (900) to allow detection of long term trends in physiological data.
- 11. A method as set forth in
clause 1, wherein the act of displaying further includes the act of assigning a representative X coordinate, Y coordinate, and Z coordinate, to each data point and plotting each data point (100, 200, 300, 400, 500, 700, 800, 900, 1000) on the display (62) to produce a three dimensional representation. - 12. A method as set forth in
clause 1, further including the act of parsing the data points into a series of median waveforms and wherein the act of displaying further includes the act of plotting the waveforms in a temporal alignment (900). - 13. A method as set forth in
clause 1, wherein the act of displaying further includes the act of color-coding the amplitude values of the data points in the relevant range (600). - 14. A method as set forth in clause 13, wherein the relevant range is +0.5mV to 0.5mV.
- 15. A method of displaying physiological patient data from a cyclic physiological
waveform, the method comprising:
- acquiring the physiological patient data;
- storing the physiological patient data in a memory array; and
- displaying the physiological patient data in a three dimensional representation (100, 200, 300, 400, 500, 600, 700, 800, 900, 1000), the act of displaying including parsing the physiological patient data into a series of waveforms such that each successive waveform is plotted in a temporal alignment (900) to allow detection of long term trends in physiological data, the act of parsing each waveform into a series of successive data points such that each data point has a coordinate that is plotted on the display (62) to produce a three dimensional representation, each successive data point having a discrete amplitude, and assigning a color according to the amplitude of the data point if the amplitude is within the relevant range (600).
- 16. A method as set forth in clause 15, wherein said physiological patient data is electrocardiogram data.
- 17. A method as set forth in clause 15, wherein the physiological data is blood pressure data.
- 18. A method as set forth in clause 15, wherein the physiological data is cardiac output data.
- 19. A method as set forth in clause 15, wherein the physiological data is pulse oximetry data.
- 20. A method as set forth in clause 15, wherein the memory array is a waveform array.
- 21. A method as set forth in clause 15, wherein the series of waveforms are median waveforms.
- 22. A method as set forth in clause 15, wherein the relevant range is +0.5mV to - 0.5mV.
- 23. An apparatus (10) for displaying physiological patient data from a cyclic
physiological waveform, the data including a plurality of data points having an
amplitude representing the value of the physiological parameter, the apparatus (10)
comprising:
- a display (62); and
- a processor (58) for producing a three dimensional representation of the physiological patient data.
- 24. An apparatus (10) as set forth in
clause 23, and further comprising a patient monitor device as the source of physiological patient data. - 25. An apparatus (10) as set forth in clause 24, wherein the patient monitor device includes a transducer (18, 22, 26, 30, 34, 38, 42, 46, 50) for acquiring the physiological patient data from a patient.
- 26. An apparatus (10) as set forth in clause 24, wherein the patient monitoring device is a Holter monitor.
- 27. An apparatus (10) as set forth in clause 24, wherein the patient monitoring device is a stress-testing monitor.
- 28. An apparatus (10) as set forth in
clause 23, and further comprising a memory device connected to the processor. - 29. An apparatus (10) as set forth in clause 28, wherein the physiological patient data is stored as a memory array.
- 30. An apparatus (10) as set forth in clause 29, wherein the memory array is a waveform array.
- 31. An apparatus (10) as set forth in
clause 23, wherein the display (62) is a black and white display capable of displaying/generating shades of gray in between black and white. - 32. An apparatus (10) as set forth in
clause 23, wherein the display (62) is a red-blue-green color display. - 33. An apparatus (10) as set forth in
clause 23, wherein the display (62) has a plurality of pixels for displaying the respective coordinates. - 34. An apparatus (10) as set forth in
clause 23, wherein the processor further comprises software for animation and walk through of three-dimensional representations. - 35. An apparatus (10) as set forth in
clause 23, wherein the processor further comprises software for receive physiological data. - 36. An apparatus (10) as set forth in
clause 23, wherein the processor further comprises software to parse the physiological data. - 37. An apparatus (10) as set forth in clause 36, where in the physiological data is parsed into a series of waveforms.
- 38. An apparatus (10) as set forth in clause 37, wherein the series of waveforms are median waveforms.
- 39. An apparatus (10) as set forth in
clause 23, wherein the processor (58) further comprises software to generate a waveform display on the display (62). - 40. An apparatus (10) as set forth in clause 39, wherein the waveform display places the data points at respective pixels on the display (62).
- 41. A software program for generating a display of physiological data from a
cyclic physiological waveform, the software program comprising:
- (a) a program module for acquiring the physiological patient data;
- (b) a program module for storing the physiological patient data in a memory array;
- (c) a program module for displaying a three dimensional representation (100, 200, 300, 400, 500, 600, 700, 800, 900, 1000);
- (d) a program module for setting the current waveform to the first waveform in the waveform array (100);
- (e) a program module for providing a Z coordinate counter and initializing the Z coordinate counter to zero (100);
- (f) a program module for providing a X coordinate counter and initializing the X coordinate counter to zero (200);
- (g) a program module for providing a Y coordinate counter and initializing the Y coordinate counter to zero (300);
- (h) a program module for providing a determining the pixel color based on the Y coordinate of the data point (600);
- (i) a program module for plotting the current data point of the current waveform at the current coordinate in the color determined in (h) (600);
- (j) a program module for incrementing the X coordinate counter and repeating (h) and (i) until all data points in the current waveform are plotted (400); and
- (k) a program module for incrementing the Z coordinate counter and repeating (h)-(j) until all waveforms in the waveform array are plotted (900).
- 42. An apparatus (10) for displaying physiological patient data from a cyclic
physiological waveform, the data including a plurality of data points having an
amplitude representing the value of the physiological parameter, said apparatus
comprising:
- a display (62);
- a means for producing a three dimensional representation of the physiological patient data.
- 43. An apparatus (10) as set forth in clause 42, and further comprising a patient monitor device as a source of physiological patient data.
- 44. An apparatus (10) as set forth in clause 43, wherein the patient monitor device includes a transducer (18, 22, 26, 30, 34, 38, 42, 46, 50) for acquiring the physiological patient data from a patient.
- 45. An apparatus (10) as set forth in clause 43, wherein the patient monitor device is a Holter monitor.
- 46. An apparatus (10) as set forth in clause 43, wherein the patient monitor device is a stress-testing monitor.
- 47. An apparatus (10) as set forth in clause 42, wherein the means for producing a three dimensional representation includes storing the physiological data.
- 48. An apparatus (10) as set forth in clause 47, wherein the physiological patient data is stored in a memory array.
- 49. An apparatus (10) as set forth in clause 48, wherein the memory array is a waveform array.
- 50. An apparatus (10) as set forth in clause 42, wherein the display (62) is a black and white display capable of displaying/generating shades of gray in between black and white.
- 51. An apparatus (10) as set forth in clause 42 wherein the display (62) is a red-blue-green color display.
- 52. An apparatus (10) as set forth in clause 42, wherein the display (62) has a plurality of pixels for displaying the respective coordinates.
- 53. An apparatus (10) as set forth in clause 42, wherein the means for producing a three dimensional representation includes animating the three dimensional representation for analysis of the three dimensional representation.
- 54. An apparatus (10) as set forth in clause 42, wherein the means for producing a three dimensional representation includes receiving physiological data.
- 55. An apparatus (10) as set forth in clause 42, wherein the means for producing a three dimensional representation includes parsing the physiological data.
- 56. An apparatus (10) as set forth in clause 55, where in the physiological data is parsed into a series of waveforms.
- 57. An apparatus (10) as set forth in clause 56, wherein the series of waveforms are median waveforms.
- 58. An apparatus (10) as set forth in clause 42, wherein the means for producing a three dimensional representation includes generating a waveform display (100, 200, 300, 400, 500, 600, 700, 800, 900, 1000) on the display (62).
- 59. An apparatus (10) as set forth in clause 58, wherein the waveform display places the data points at respective pixels on the display (62).
-
Claims (10)
- A method of displaying physiological patient data from a cyclic physiological waveform, the patient data including a plurality of data points, each data point representing the amplitude of the physiological patient data, the method comprising the acts of:acquiring the physiological patient data; anddisplaying the physiological patient data in a three dimensional representation (100, 200, 300, 400, 500, 600, 700, 800, 900, 1000).
- A method as set forth in claim 1, further including the act of parsing the data points into a series of median waveforms and wherein the act of displaying further includes the act of plotting the waveforms in a temporal alignment (900).
- A method of displaying physiological patient data from a cyclic physiological waveform, the method comprising:acquiring the physiological patient data;storing the physiological patient data in a memory array; anddisplaying the physiological patient data in a three dimensional representation (100, 200, 300, 400, 500, 600, 700, 800, 900, 1000), the act of displaying including parsing the physiological patient data into a series of waveforms such that each successive waveform is plotted in a temporal alignment (900) to allow detection of long term trends in physiological data, the act of parsing each waveform into a series of successive data points such that each data point has a coordinate that is plotted on the display (62) to produce a three dimensional representation, each successive data point having a discrete amplitude, and assigning a color according to the amplitude of the data point if the amplitude is within the relevant range (600).
- A method as set forth in claim 3, wherein the memory array is a waveform array.
- An apparatus (10) for displaying physiological patient data from a cyclic physiological waveform, the data including a plurality of data points having an amplitude representing the value of the physiological parameter, the apparatus (10) comprising:a display (62); anda processor (58) for producing a three dimensional representation of the physiological patient data.
- An apparatus (10) as set forth in claim 5, and further comprising a patient monitor device which includes a transducer (18, 22, 26, 30, 34, 38, 42, 46, 50) for acquiring the physiological patient data from a patient.
- An apparatus (10) as set forth in claim 5, wherein the physiological patient data is stored as a waveform array in a memory device.
- An apparatus (10) as set forth in claim 5, wherein the processor further comprises software to parse the physiological data into a series of median waveforms.
- A software program for generating a display of physiological data from a cyclic physiological waveform, the software program comprising:(a) a program module for acquiring the physiological patient data;(b) a program module for storing the physiological patient data in a memory array;(c) a program module for displaying a three dimensional representation (100, 200, 300, 400, 500, 600, 700, 800, 900, 1000);(d) a program module for setting the current waveform to the first waveform in the waveform array (100);(e) a program module for providing a Z coordinate counter and initializing the Z coordinate counter to zero (100);(f) a program module for providing a X coordinate counter and initializing the X coordinate counter to zero (200);(g) a program module for providing a Y coordinate counter and initializing the Y coordinate counter to zero (300);(h) a program module for providing a determining the pixel color based on the Y coordinate of the data point (600);(i) a program module for plotting the current data point of the current waveform at the current coordinate in the color determined in (h) (600);(j) a program module for incrementing the X coordinate counter and repeating (h) and (I) until all data points in the current waveform are plotted (400); and(k) a program module for incrementing the Z coordinate counter and repeating (h)-(j) until all waveforms in the waveform array are plotted (900).
- An apparatus (10) for displaying physiological patient data from a cyclic physiological waveform, the data including a plurality of data points having an amplitude representing the value of the physiological parameter, said apparatus comprising:a display (62);a means for producing a three dimensional representation of the physiological patient data.
Applications Claiming Priority (2)
| Application Number | Priority Date | Filing Date | Title |
|---|---|---|---|
| US711691 | 2000-11-13 | ||
| US09/711,691 US6967652B1 (en) | 2000-11-13 | 2000-11-13 | Method and apparatus for displaying physiological patient data |
Publications (2)
| Publication Number | Publication Date |
|---|---|
| EP1205143A2 true EP1205143A2 (en) | 2002-05-15 |
| EP1205143A3 EP1205143A3 (en) | 2003-08-06 |
Family
ID=24859118
Family Applications (1)
| Application Number | Title | Priority Date | Filing Date |
|---|---|---|---|
| EP01309548A Ceased EP1205143A3 (en) | 2000-11-13 | 2001-11-13 | Method and apparatus for displaying physiological patient data |
Country Status (2)
| Country | Link |
|---|---|
| US (1) | US6967652B1 (en) |
| EP (1) | EP1205143A3 (en) |
Cited By (3)
| Publication number | Priority date | Publication date | Assignee | Title |
|---|---|---|---|---|
| US8089349B2 (en) | 2005-07-18 | 2012-01-03 | Diego Giuseppe Tognola | Signal process and system |
| US20220223276A1 (en) * | 2012-04-16 | 2022-07-14 | Airstrip Ip Holdings, Llc | Systems and methods for and displaying patient data |
| US12026811B2 (en) | 2012-04-16 | 2024-07-02 | Airstrip Ip Holdings, Llc | Systems and methods for displaying patient data |
Families Citing this family (16)
| Publication number | Priority date | Publication date | Assignee | Title |
|---|---|---|---|---|
| US7187966B2 (en) * | 2004-04-15 | 2007-03-06 | Ge Medical Systems Information Technologies, Inc. | Method and apparatus for displaying alternans data |
| US7555327B2 (en) | 2005-09-30 | 2009-06-30 | Nellcor Puritan Bennett Llc | Folding medical sensor and technique for using the same |
| US7483731B2 (en) | 2005-09-30 | 2009-01-27 | Nellcor Puritan Bennett Llc | Medical sensor and technique for using the same |
| US7881762B2 (en) | 2005-09-30 | 2011-02-01 | Nellcor Puritan Bennett Llc | Clip-style medical sensor and technique for using the same |
| US20070244721A1 (en) * | 2005-10-31 | 2007-10-18 | Sackner-Bernstein Jonathan D | Systems and methods for improved assessment and reporting of the efficacy and safety of drug, biologic, botanical, vitamin, medical food and medical device treatments |
| US8073518B2 (en) * | 2006-05-02 | 2011-12-06 | Nellcor Puritan Bennett Llc | Clip-style medical sensor and technique for using the same |
| US8145288B2 (en) | 2006-08-22 | 2012-03-27 | Nellcor Puritan Bennett Llc | Medical sensor for reducing signal artifacts and technique for using the same |
| US8754889B2 (en) * | 2009-03-18 | 2014-06-17 | National Instruments Corporation | Cursor synchronization in a plurality of graphs |
| US8515510B2 (en) * | 2009-03-31 | 2013-08-20 | Covidien Lp | Electroadhesive medical devices |
| US20110021936A1 (en) * | 2009-07-24 | 2011-01-27 | Shen Luo | Medical data display with 3-D and 2-D color mapping |
| USD649972S1 (en) | 2009-07-24 | 2011-12-06 | Cardiac Science Corporation | Display screen with user interface for medical data |
| JP2019511334A (en) | 2016-04-12 | 2019-04-25 | アイセンティア インク | Adhesive extenders for medical electrodes and their use with wearable monitoring devices |
| US11521740B2 (en) * | 2018-06-06 | 2022-12-06 | International Business Machines Corporation | Natural language processing of a motion alphabet for unsupervised clinical scoring |
| US10891766B1 (en) | 2019-09-04 | 2021-01-12 | Google Llc | Artistic representation of digital data |
| US11464460B2 (en) * | 2019-10-21 | 2022-10-11 | Pratyush Pavan Devarasetty | Systems, devices, and methods for detecting physical distress in infant tracheostomy patients |
| KR102886210B1 (en) * | 2022-07-13 | 2025-11-14 | 주식회사 메디컬에이아이 | Method, program and apparatus for providing visualization contents based on electrocardiogram interpreting |
Family Cites Families (18)
| Publication number | Priority date | Publication date | Assignee | Title |
|---|---|---|---|---|
| US3585988A (en) * | 1968-11-20 | 1971-06-22 | Minnesota Mining & Mfg | Arrhythmia recording and control system and method of operation |
| US3638066A (en) | 1970-08-21 | 1972-01-25 | Thomas O Paine | Contourograph system for monitoring electrocardiograms |
| US4175264A (en) * | 1975-03-06 | 1979-11-20 | Peter Schiff | Electronic synchronizer-monitor system for controlling the timing of mechanical assistance and pacing of the heart |
| FR2414235A1 (en) | 1978-01-10 | 1979-08-03 | Aerazur Const Electro | NORMALLY REPETITIVE SIGNAL TRAIN OSCILLOSCOPE COUNTING PROCESS |
| US5121470A (en) * | 1990-02-01 | 1992-06-09 | Intellimetrics Instrument Corporation | Automated interactive record system |
| US5109862A (en) | 1990-03-19 | 1992-05-05 | Del Mar Avionics | Method and apparatus for spectral analysis of electrocardiographic signals |
| US5348020A (en) | 1990-12-14 | 1994-09-20 | Hutson William H | Method and system for near real-time analysis and display of electrocardiographic signals |
| US5956013A (en) | 1992-02-28 | 1999-09-21 | Hewlett-Packard Company | Method and apparatus for synchronizing a continuous ECG waveform display with a display of superimposed heartbeats |
| US5361776A (en) * | 1993-08-06 | 1994-11-08 | Telectronics Pacing Systems, Inc. | Time domain reflectometer impedance sensor method of use and implantable cardiac stimulator using same |
| US5622178A (en) | 1994-05-04 | 1997-04-22 | Spacelabs Medical, Inc. | System and method for dynamically displaying cardiac interval data using scatter-plots |
| SE508285C2 (en) | 1994-06-07 | 1998-09-21 | Biosys Ab | Method and apparatus for assessing wakefulness and drowsiness at various stages between wakefulness and sleep in a way that is not monitored non-interfering |
| US6001060A (en) | 1996-06-04 | 1999-12-14 | Regents Of The University Of California | Video data representation of physiological data |
| WO1998002090A1 (en) * | 1996-07-17 | 1998-01-22 | Cambridge Heart, Inc. | Generation of localized cardiac measures |
| US5830150A (en) | 1996-09-18 | 1998-11-03 | Marquette Electronics, Inc. | Method and apparatus for displaying data |
| US5827195A (en) | 1997-05-09 | 1998-10-27 | Cambridge Heart, Inc. | Electrocardiogram noise reduction using multi-dimensional filtering |
| US5967994A (en) | 1998-03-26 | 1999-10-19 | Hewlett-Packard Company | Method and system for characterizing the quality of signals indicative of heart function |
| US6409659B1 (en) * | 1998-11-04 | 2002-06-25 | Ge Medical Systems Information Technologies, Inc. | Method and apparatus for displaying physiological patient data |
| US6558325B1 (en) * | 2000-07-13 | 2003-05-06 | Acuson Corporation | Medical diagnostic ultrasonic imaging method and system for displaying multi-phase, multi-frame images |
-
2000
- 2000-11-13 US US09/711,691 patent/US6967652B1/en not_active Expired - Fee Related
-
2001
- 2001-11-13 EP EP01309548A patent/EP1205143A3/en not_active Ceased
Non-Patent Citations (1)
| Title |
|---|
| "Matlab Function Reference (Volume 2: Graphics), Version 5 (Matlab 5.2)", January 1998, THE MATHWORKS, ONLINE * |
Cited By (6)
| Publication number | Priority date | Publication date | Assignee | Title |
|---|---|---|---|---|
| US8089349B2 (en) | 2005-07-18 | 2012-01-03 | Diego Giuseppe Tognola | Signal process and system |
| US20220223276A1 (en) * | 2012-04-16 | 2022-07-14 | Airstrip Ip Holdings, Llc | Systems and methods for and displaying patient data |
| US12026811B2 (en) | 2012-04-16 | 2024-07-02 | Airstrip Ip Holdings, Llc | Systems and methods for displaying patient data |
| US12033754B2 (en) * | 2012-04-16 | 2024-07-09 | Airstrip Ip Holdings, Llc | Systems and methods for and displaying patient data |
| US20240321446A1 (en) * | 2012-04-16 | 2024-09-26 | Airstrip Ip Holdings, Llc | Systems and methods for and displaying patient data |
| US12482562B2 (en) | 2012-04-16 | 2025-11-25 | Airstrip Ip Holdings, Llc | Systems and methods for and displaying patient data |
Also Published As
| Publication number | Publication date |
|---|---|
| US6967652B1 (en) | 2005-11-22 |
| EP1205143A3 (en) | 2003-08-06 |
Similar Documents
| Publication | Publication Date | Title |
|---|---|---|
| US6967652B1 (en) | Method and apparatus for displaying physiological patient data | |
| US6409659B1 (en) | Method and apparatus for displaying physiological patient data | |
| JP6339677B2 (en) | Method and display for long-term physiological signal quality indication | |
| US6694178B1 (en) | Method and device for representing and monitoring functional parameters of a physiological system | |
| US20110021936A1 (en) | Medical data display with 3-D and 2-D color mapping | |
| CN102038495B (en) | Biological parameter displaying apparatus | |
| JP4141133B2 (en) | Apparatus and method for displaying periodic data | |
| JP3887798B2 (en) | Biological information display method and biological information display device | |
| JP2003513693A (en) | Method and apparatus for myocardial analysis and monitoring | |
| GB2479055A (en) | Graphical display of medical information | |
| EP3821807A1 (en) | Method of medical monitoring | |
| JPH02226073A (en) | Method and apparatus for correlation of displays of information contained in two information signals | |
| US20120302905A1 (en) | Method, apparatus and computer program product for monitoring physiological signals | |
| US10950018B2 (en) | Interpolation of dynamic three-dimensional maps | |
| US6273855B1 (en) | Method and device for compressed optical representation of medical data | |
| WO2020133429A1 (en) | Monitoring method, monitor and computer storage medium | |
| US7187966B2 (en) | Method and apparatus for displaying alternans data | |
| US7698234B2 (en) | Cardiac perfusion analysis | |
| CN105520723A (en) | Vital sign measuring device, vital sign display method and program | |
| EP0932138B1 (en) | Method of correcting for phase error induced by a down sampling routine | |
| CN113662555A (en) | Drawing method, analysis method, drawing device, mobile terminal and storage medium | |
| CN117690575A (en) | Remote diagnosis and treatment timely interaction method and system based on augmented reality | |
| US7125381B2 (en) | Method of correcting for phase error induced by a down sampling routine | |
| Hennigs et al. | Towards a digital twin based monitoring tool for ventilated patients | |
| JP2834057B2 (en) | ECG analyzer |
Legal Events
| Date | Code | Title | Description |
|---|---|---|---|
| PUAI | Public reference made under article 153(3) epc to a published international application that has entered the european phase |
Free format text: ORIGINAL CODE: 0009012 |
|
| AK | Designated contracting states |
Kind code of ref document: A2 Designated state(s): AT BE CH CY DE DK ES FI FR GB GR IE IT LI LU MC NL PT SE TR |
|
| AX | Request for extension of the european patent |
Free format text: AL;LT;LV;MK;RO;SI |
|
| PUAL | Search report despatched |
Free format text: ORIGINAL CODE: 0009013 |
|
| AK | Designated contracting states |
Designated state(s): AT BE CH CY DE DK ES FI FR GB GR IE IT LI LU MC NL PT SE TR |
|
| AX | Request for extension of the european patent |
Extension state: AL LT LV MK RO SI |
|
| RIC1 | Information provided on ipc code assigned before grant |
Ipc: 7G 06F 17/00 B Ipc: 7A 61B 5/044 A |
|
| 17P | Request for examination filed |
Effective date: 20040206 |
|
| AKX | Designation fees paid |
Designated state(s): DE FR GB |
|
| 17Q | First examination report despatched |
Effective date: 20040727 |
|
| 17Q | First examination report despatched |
Effective date: 20040727 |
|
| STAA | Information on the status of an ep patent application or granted ep patent |
Free format text: STATUS: THE APPLICATION HAS BEEN REFUSED |
|
| 18R | Application refused |
Effective date: 20080516 |