EP1203242B1 - Nmr apparatus and methods for measuring volumes of hydrocarbon gas and oil - Google Patents
Nmr apparatus and methods for measuring volumes of hydrocarbon gas and oil Download PDFInfo
- Publication number
- EP1203242B1 EP1203242B1 EP00955514A EP00955514A EP1203242B1 EP 1203242 B1 EP1203242 B1 EP 1203242B1 EP 00955514 A EP00955514 A EP 00955514A EP 00955514 A EP00955514 A EP 00955514A EP 1203242 B1 EP1203242 B1 EP 1203242B1
- Authority
- EP
- European Patent Office
- Prior art keywords
- hydrocarbon
- echo
- nmr
- time
- difference
- Prior art date
- Legal status (The legal status is an assumption and is not a legal conclusion. Google has not performed a legal analysis and makes no representation as to the accuracy of the status listed.)
- Expired - Lifetime
Links
- 238000000034 method Methods 0.000 title claims abstract description 82
- 229930195733 hydrocarbon Natural products 0.000 title claims description 103
- 150000002430 hydrocarbons Chemical class 0.000 title claims description 102
- 239000004215 Carbon black (E152) Substances 0.000 title claims description 90
- XLYOFNOQVPJJNP-UHFFFAOYSA-N water Substances O XLYOFNOQVPJJNP-UHFFFAOYSA-N 0.000 claims description 77
- 239000012530 fluid Substances 0.000 claims description 56
- 238000005259 measurement Methods 0.000 claims description 38
- 230000015572 biosynthetic process Effects 0.000 claims description 33
- 238000011084 recovery Methods 0.000 claims description 20
- 238000009826 distribution Methods 0.000 claims description 15
- 238000000685 Carr-Purcell-Meiboom-Gill pulse sequence Methods 0.000 claims description 13
- 238000012545 processing Methods 0.000 claims description 13
- 239000001257 hydrogen Substances 0.000 claims description 10
- 229910052739 hydrogen Inorganic materials 0.000 claims description 10
- UFHFLCQGNIYNRP-UHFFFAOYSA-N Hydrogen Chemical compound [H][H] UFHFLCQGNIYNRP-UHFFFAOYSA-N 0.000 claims description 9
- 238000001208 nuclear magnetic resonance pulse sequence Methods 0.000 claims description 6
- 239000002245 particle Substances 0.000 claims description 4
- 230000004044 response Effects 0.000 claims description 2
- 101100439027 Schizosaccharomyces pombe (strain 972 / ATCC 24843) cdc2 gene Proteins 0.000 abstract 1
- 238000005481 NMR spectroscopy Methods 0.000 description 47
- 239000012071 phase Substances 0.000 description 39
- 238000002474 experimental method Methods 0.000 description 31
- 239000007789 gas Substances 0.000 description 30
- 239000003921 oil Substances 0.000 description 30
- 238000005755 formation reaction Methods 0.000 description 29
- 238000012937 correction Methods 0.000 description 24
- 239000000203 mixture Substances 0.000 description 22
- 230000004913 activation Effects 0.000 description 17
- 238000001994 activation Methods 0.000 description 17
- 239000000523 sample Substances 0.000 description 15
- 239000012267 brine Substances 0.000 description 13
- HPALAKNZSZLMCH-UHFFFAOYSA-M sodium;chloride;hydrate Chemical compound O.[Na+].[Cl-] HPALAKNZSZLMCH-UHFFFAOYSA-M 0.000 description 13
- 238000002592 echocardiography Methods 0.000 description 11
- SNRUBQQJIBEYMU-UHFFFAOYSA-N dodecane Chemical compound CCCCCCCCCCCC SNRUBQQJIBEYMU-UHFFFAOYSA-N 0.000 description 10
- 238000004422 calculation algorithm Methods 0.000 description 9
- 238000009792 diffusion process Methods 0.000 description 9
- 239000007788 liquid Substances 0.000 description 9
- 239000011148 porous material Substances 0.000 description 8
- WCUXLLCKKVVCTQ-UHFFFAOYSA-M Potassium chloride Chemical compound [Cl-].[K+] WCUXLLCKKVVCTQ-UHFFFAOYSA-M 0.000 description 7
- 230000000875 corresponding effect Effects 0.000 description 7
- 239000013505 freshwater Substances 0.000 description 7
- 230000010287 polarization Effects 0.000 description 7
- 238000001228 spectrum Methods 0.000 description 7
- 230000008901 benefit Effects 0.000 description 6
- 239000004927 clay Substances 0.000 description 6
- 230000009977 dual effect Effects 0.000 description 6
- 238000002075 inversion recovery Methods 0.000 description 6
- 238000003672 processing method Methods 0.000 description 6
- 239000000706 filtrate Substances 0.000 description 5
- 230000005415 magnetization Effects 0.000 description 5
- 238000001514 detection method Methods 0.000 description 4
- 230000000694 effects Effects 0.000 description 4
- 230000007246 mechanism Effects 0.000 description 4
- VNWKTOKETHGBQD-UHFFFAOYSA-N methane Chemical compound C VNWKTOKETHGBQD-UHFFFAOYSA-N 0.000 description 4
- 238000012360 testing method Methods 0.000 description 4
- 238000010586 diagram Methods 0.000 description 3
- 230000006870 function Effects 0.000 description 3
- 230000006872 improvement Effects 0.000 description 3
- 238000012986 modification Methods 0.000 description 3
- 230000004048 modification Effects 0.000 description 3
- 238000000329 molecular dynamics simulation Methods 0.000 description 3
- 238000005457 optimization Methods 0.000 description 3
- 230000035699 permeability Effects 0.000 description 3
- 235000011164 potassium chloride Nutrition 0.000 description 3
- 239000001103 potassium chloride Substances 0.000 description 3
- 230000036962 time dependent Effects 0.000 description 3
- 238000013459 approach Methods 0.000 description 2
- 238000004364 calculation method Methods 0.000 description 2
- 230000001276 controlling effect Effects 0.000 description 2
- 238000005314 correlation function Methods 0.000 description 2
- 230000001186 cumulative effect Effects 0.000 description 2
- 238000013480 data collection Methods 0.000 description 2
- 238000013500 data storage Methods 0.000 description 2
- 230000001419 dependent effect Effects 0.000 description 2
- 238000013461 design Methods 0.000 description 2
- 239000011521 glass Substances 0.000 description 2
- 230000003993 interaction Effects 0.000 description 2
- 239000000463 material Substances 0.000 description 2
- 239000011159 matrix material Substances 0.000 description 2
- 239000003345 natural gas Substances 0.000 description 2
- 230000008569 process Effects 0.000 description 2
- 239000011435 rock Substances 0.000 description 2
- 239000007787 solid Substances 0.000 description 2
- 230000003068 static effect Effects 0.000 description 2
- 238000012565 NMR experiment Methods 0.000 description 1
- 238000004458 analytical method Methods 0.000 description 1
- 239000002131 composite material Substances 0.000 description 1
- 230000002596 correlated effect Effects 0.000 description 1
- 230000003247 decreasing effect Effects 0.000 description 1
- 230000001934 delay Effects 0.000 description 1
- 238000009795 derivation Methods 0.000 description 1
- 238000005516 engineering process Methods 0.000 description 1
- 239000000295 fuel oil Substances 0.000 description 1
- 230000009878 intermolecular interaction Effects 0.000 description 1
- 238000005304 joining Methods 0.000 description 1
- 239000007791 liquid phase Substances 0.000 description 1
- 238000002595 magnetic resonance imaging Methods 0.000 description 1
- 239000003208 petroleum Substances 0.000 description 1
- 230000010363 phase shift Effects 0.000 description 1
- 239000000047 product Substances 0.000 description 1
- 238000011002 quantification Methods 0.000 description 1
- 238000004445 quantitative analysis Methods 0.000 description 1
- 238000005070 sampling Methods 0.000 description 1
- 239000004576 sand Substances 0.000 description 1
- 229920006395 saturated elastomer Polymers 0.000 description 1
- 238000000926 separation method Methods 0.000 description 1
- 239000000243 solution Substances 0.000 description 1
- 238000003860 storage Methods 0.000 description 1
Images




Classifications
-
- G—PHYSICS
- G01—MEASURING; TESTING
- G01V—GEOPHYSICS; GRAVITATIONAL MEASUREMENTS; DETECTING MASSES OR OBJECTS; TAGS
- G01V3/00—Electric or magnetic prospecting or detecting; Measuring magnetic field characteristics of the earth, e.g. declination, deviation
- G01V3/18—Electric or magnetic prospecting or detecting; Measuring magnetic field characteristics of the earth, e.g. declination, deviation specially adapted for well-logging
- G01V3/32—Electric or magnetic prospecting or detecting; Measuring magnetic field characteristics of the earth, e.g. declination, deviation specially adapted for well-logging operating with electron or nuclear magnetic resonance
-
- G—PHYSICS
- G01—MEASURING; TESTING
- G01N—INVESTIGATING OR ANALYSING MATERIALS BY DETERMINING THEIR CHEMICAL OR PHYSICAL PROPERTIES
- G01N24/00—Investigating or analyzing materials by the use of nuclear magnetic resonance, electron paramagnetic resonance or other spin effects
- G01N24/08—Investigating or analyzing materials by the use of nuclear magnetic resonance, electron paramagnetic resonance or other spin effects by using nuclear magnetic resonance
- G01N24/081—Making measurements of geologic samples, e.g. measurements of moisture, pH, porosity, permeability, tortuosity or viscosity
-
- Y—GENERAL TAGGING OF NEW TECHNOLOGICAL DEVELOPMENTS; GENERAL TAGGING OF CROSS-SECTIONAL TECHNOLOGIES SPANNING OVER SEVERAL SECTIONS OF THE IPC; TECHNICAL SUBJECTS COVERED BY FORMER USPC CROSS-REFERENCE ART COLLECTIONS [XRACs] AND DIGESTS
- Y02—TECHNOLOGIES OR APPLICATIONS FOR MITIGATION OR ADAPTATION AGAINST CLIMATE CHANGE
- Y02A—TECHNOLOGIES FOR ADAPTATION TO CLIMATE CHANGE
- Y02A90/00—Technologies having an indirect contribution to adaptation to climate change
- Y02A90/30—Assessment of water resources
Definitions
- the present invention relates to borehole measurements and more particularly to a system and method for detecting the presence and estimating the quantity of gaseous and liquid hydrocarbons using nuclear magnetic resonance.
- NMR nuclear magnetic resonance
- Various methods exist for performing measurements of petrophysical parameters in a geologic formation Nuclear magnetic resonance (NMR) logging, which is the focus of this invention, is among the best methods that have been developed for a rapid determination of such parameters, which include formation porosity, composition of the formation fluid, the quantity of movable fluid and permeability, among others.
- NMR measurements are environmentally safe and are essentially unaffected by matrix mineralogy, because NMR signals from the matrix decay too quickly to be detected by the current generation NMR logging tools.
- NMR logs provide information only on formation fluids.
- NMR tools are capable of directly measuring rock porosity filled with the fluids.
- NMR tools such as NUMAR Corporation's MRIL ® tool to distinguish among different fluid types, in particular, clay-bound water, capillary-bound water, movable water, gas, light oil, medium oil, and heavy oil by applying different sets of user-adjusted measurement parameters.
- MRIL is a mark of NUMAR Corporation, a Halliburton company. This ability to detect the presence and estimate the volumes of different types of fluids is becoming one of the main concerns in the examination of the petrophysical properties of a geologic formation.
- NMR logging can be used for fluid signal separation and estimating fluid volumes, it is helpful to briefly examine the type of parameters that can be measured using NMR techniques. It is well known that when an assembly of magnetic moments, such as those of hydrogen nuclei, are exposed in a NMR measurement to a static magnetic field they tend to align along the direction of the magnetic field, resulting in bulk magnetization. The rate at which equilibrium is established in such bulk magnetization upon provision of a static magnetic field is characterized by the parameter T 1 , known as the spin-lattice relaxation time.
- T 2 spin-spin relaxation time
- T 2 also known as transverse relaxation time
- Both relaxation times provide information about the formation porosity, the composition and quantity of the formation fluid, and others.
- diffusion refers to the motion of atoms in a gaseous or liquid state due to their thermal energy. Self-diffusion is inversely related to the viscosity of the fluid, which is a parameter of considerable importance in borehole surveys.
- diffusion In a uniform magnetic field, diffusion has little effect on the decay rate of the measured NMR echoes.
- diffusion In a gradient magnetic field, however, diffusion causes atoms to move from their original positions to new ones, which moves also cause these atoms to acquire different phase shifts compared to atoms that did not move. This effect contributes to a faster rate of relaxation in a gradient magnetic field.
- NMR measurements of these and other parameters of the geologic formation can be done using, for example, the centralized MRIL ® tool made by NUMAR Corporation, a Halliburton company, and the sidewall CMR tool made by Schlumberger.
- the MRIL ® tool is described, for example, in U.S. Pat. 4,710,713 to Taicher et al. and in various other publications including: " Spin Echo Magnetic Resonance Logging: Porosity and Free Fluid Index Determination," by Miller, Paltiel, Gillen, Granot and Bouton, SPE 20561, 65th Annual Technical Conference of the SPE, New Orleans, LA, Sept.
- T 1 , T 2 and diffusion depend on the molecular dynamics of the formation fluids being tested and on the types of fluids present.
- molecular dynamics is a function of both molecular size and inter-molecular interactions, which are different for each fluid. Water, gas and different types of oil each have different T 1 , T 2 and diffusivity values.
- molecular dynamics in a heterogeneous media such as a porous solid that contains liquid in its pores, differs significantly from the dynamics of the bulk liquid, and generally depends on the mechanism of interaction between the liquid and the pores of the solid media. It will thus be appreciated that a correct interpretation of the measured signals can provide valuable information relating to the types of fluids involved, the structure of the formation and other well-logging parameters of interest.
- a Carr-Purcell-Meiboom-Gill (CPMG) pulse sequence with a short inter-echo spacing (T e ) and a long wait-time (T w ) can be applied for porosity determination and identification of capillary-bound and free water volumes.
- Total porosity logging methods are available to improve the quality of data used for determining pore volumes occupied by clay-bound and/or capillary-bound water. (See, for example, Prammer, M.G., et al.: "Measurements of Clay-Bound Water and Total Porosity by Magnetic Resonance Logging," paper SPE 36522 presented at the 1996 SPE Annual Technical Conference and Exhibition, Denver, Oct. 6-9 ).
- hydrocarbons such as formation oil and/or gas or filtrate from oil-based mud, coexist with brine
- porosity determination and fluid typing identification and quantification
- T w For gas and light oil under typical formation conditions of temperature and pressure (100 - 300°F and 2,000 - 10,000 psi), T l values of a few seconds occur at low-frequency (1- to 2-MHz) NMR. Wait times T w of at least 10 seconds will capture nearly all the total proton magnetization arising from the individual T l recovery rates encountered in petroleum logging. Such long wait times, combined with acceptable depth sampling, restrict the logging speed and reduce wellsite efficiency.
- Dual-wait-time and dual-frequency methods have been applied to determine gas volumes in both clean and shaley sand formations. It is known that the success of the application depends primarily on two factors. First, adequate signal-to-noise levels in an echo train difference has to be maintained so that the gas-filled porosity and its transverse relaxation time T 2 can be accurately characterized. Second, methods must be available to reliably estimate the longitudinal relaxation time T 1 of the hydrocarbon phase needed to apply a necessary amplitude correction to the apparent hydrocarbon-filled porosity. It is clear that data acquisition and processing methods that address these two factors with success are highly desirable.
- T 1 in quantitative fluid typing. Obtaining enough saturation-recovery data points to derive an accurate and precise T 1 distribution of a fluid at acceptable logging speeds and vertical resolution is difficult or nearly impossible. Consequently, most quantitative analyses rely on T 1 values computed from correlation functions or by the application of assumptions to measured values.
- formation parameters such as temperature, pressure, and fluid viscosity, may not be accurately known.
- attention must be directed to the ranges for which the correlation functions are valid.
- Prior art methods of deriving T 1 involve either dual T w 's with one inter echo spacing T e or dual T w 's with multiple T e 's.
- T 1 computations play an important role in distinguishing one fluid from another.
- gas and light oil have large T 1 values, and thus can be separated from brine, which typically has lower values for T 1 .
- fluid viscosity and self-diffusion coefficient D that can be obtained from a known T 1 value can be used to separate gas from other fluids.
- large values for both T 1 and D reliably indicate the presence of gas or light oil in a formation.
- Fluid viscosity can also be used in grouping liquids.
- Various additional contrast mechanisms are known in the art and are described, for example, in the above-referenced WO/0026696 A1 .
- T 1 relaxation times are not influenced by interactions between magnetic gradients and molecular diffusion, fluid viscosities obtained from measured T 1 's are believed to be superior to other methods whenever a gradient-field logging tool is used or an internal magnetic gradient from the formation is present.
- Another disclosure in this field is GB 2 330 658 .
- a new triple-wait-time, multi-frequency acquisition method is disclosed and successfully tested.
- the method takes advantage of the multi-frequency operation of modern NMR logging tools to improve the signal-to-noise ratio of the received signals at high logging speeds.
- the acquisition method enables accurate estimation of volumes for hydrocarbon and/or free water in addition to traditional clay-bound and capillary-bound water volumes.
- the new acquisition method uses optimized wait times to obtain better signal-to-noise ratios in echo train differential signals at faster logging speeds and acceptable vertical resolution. In turn, these signals can be used to determine formation fluid volumes, as well as estimates of hydrocarbon T 1 .
- Experiments performed on a mixture of dodecane (C 12 H 26 ) and doped water, C 12 H 26 and brine in a sandstone core, and fresh water produced fluid volumes with absolute errors of less than 1.5% for echo train differences with a signal-to-noise ratio larger than 4:1.
- the present invention provides a data processing method that enables the accurate determination of both T 2 and T 1 parameters of hydrocarbons based on the use of at least two difference NMR signals obtained at different wait times.
- the data acquisition and processing method of the present invention enable the determination of gas- and light-oil-filled porosity over a broad range of reservoir conditions.
- the present invention provides a decision mechanism to help in the selection of optimum acquisition parameters for logging applications.
- the method further comprises the step of computing the total porosity of the formation ⁇ t from the total apparent porosity ⁇ ta and apparent volume corrections computed based on the provided data representation associated with the longitudinal time constant(s) T 1 of the fluid phases.
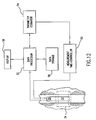
- Fig. 12 is a block diagram of a generic system used in accordance with the present invention, and shows individual block components for controlling data collection, for processing the collected data and displaying the measurement results.
- the system has a portion 32 (generally comprising a magnet array and antenna(s)) which is arranged to be lowered into a borehole.
- the tool's electronic section 30 comprises a probe controller and pulse echo detection electronics.
- the output signal from the detection electronics is processed by data processor 52 to analyze the relaxation characteristics of the material being investigated in the sensitive volume, generally designated as 34.
- the output of the data processor 52 is provided to the parameter estimator 54.
- data processor 52 selects the desired data acquisition technique and the corresponding set of measurement parameters.
- measurement cycle controller 55 provides an appropriate control signal to the probe.
- data from the log measurement is stored in data storage 56.
- raw data received by the tool can be pre-processed downhole by the electronic section 30.
- Data processor 52 is connected to display 58, which is capable of providing a graphical display of one or more measurement parameters, possibly superimposed on display data from data storage 56.
- the tool is capable of "hopping" from one operating frequency to another, the effect of which is to shift the radial position of the resonant volume of the tool.
- the frequency shift is selected in such manner that two or more non-overlapping resonant volumes are formed; each new resonant volume associated with a different frequency being filled with fully relaxed protons. Hopping between two or more (i.e., K) frequencies thus allows reducing the time between experiments approximately by a factor of K, without compromising complete T 1 measurements or adopting imprecise empirical T 1 /T 2 relationships; the logging speed for the tool can accordingly be increased approximately K times.
- the components of the system of the present invention shown in Fig. 12 can be implemented in hardware or software, or any combination thereof suitable for practical purposes.
- the data processing algorithms used in accordance with the invention are programmed into software which is stored in a computer storage medium for execution on a computer, such as data processor 52.
- NMR measurements in accordance with the present invention are done using Numar Corporation's (a Halliburton Company) MRIL ® tools having multi-frequency capability, such as the MRIL ® -Prime tool. Details of the structure, the operation and the use of logging tools, as illustrated in Fig. 12 , are also discussed, for example, in U.S.
- the multi-frequency capability of the operating tool is used to provide a new data acquisition method, which is particularly suitable for the detection of gas and other hydrocarbons on the basis of NMR measurements with different wait times T w .
- a novel interleaved pulse sequence is proposed using triple-wait-time activation.
- band 4 is a single frequency band that operates at a nominal frequency of 760 kHz for the MRIL tool. It can be shown that in this embodiment the radial distance between the inner- and outer-most sensitive volumes is less than 2.54 cm (one inch).
- measurements at frequency band 4 consist of a small number of high-quality echoes.
- Data groups E are used to improve the precision in measuring rapid T 2 decay components usually associated with clay-bound water and/or capillary-bound water.
- the design of the activation sequence illustrated in a preferred embodiment in Fig. 1 also improves the logging speed of the tool. It is known in the art that under the influence of tool motion, RF, magnetic field values, and sensitive volume can not be constant at a particular location in a formation. See, for example, Edwards, C.M.: “Effects of Tool Design and Logging Speed on T2 NMR Log Data,” paper RR presented at the 38th Annual SPWLA Logging Symposium, Houston, June 15-18, 1997 . As a consequence, apparent T 2 values decrease with increasing logging speed.
- the addition of more frequencies (measurement volumes) in accordance with the present invention causes a larger volume of formation to be sampled per unit length of tool motion, so that a greater signal-to-noise ratio (SNR) is attained.
- SNR signal-to-noise ratio
- the maximum logging speed is about 274 m/hr (900 ft/hr), which gives a vertical resolution of approximately 914 mm (3 ft) and minimizes the influence of logging speed on T 2 determination.
- two or more measurements associated with different frequencies can be combined (i.e., averaged) to result in a single data stream corresponding to either a short, or a long recovery time.
- Additional modifications in the parameters of the pulse sequences can be applied, as known in the art. For example, it is known that the contrast between liquid and gas signals can be enhanced by using a slightly larger pulse-echo spacing for the CPMG train associated with the shorter recovery interval. Modifications of this type are straightforward extensions of the activation sequence illustrated in Fig. 1 .
- the activation sequence illustrated in a preferred embodiment in Fig. 1 is believed to have at least two significant advantages over the prior art, including dual-T w , dual-frequency methods for determining volumes of gas or light oil.
- dual-T w dual-frequency methods for determining volumes of gas or light oil.
- the addition of more frequencies (measurement volumes) causes a larger volume of formation to be sampled per unit length of tool motion so that a greater signal-to-noise ratio (SNR) is attained in the echo train differential signals used to determine apparent hydrocarbon volumes.
- SNR signal-to-noise ratio
- the acquisition sequence has the important advantage that interlaced measurements having three wait times enable the computation of T 1 values for the hydrocarbon phases in the formation, as shown below.
- step 10 data acquired with the new activation sequence discussed above is processed as shown in Fig. 2 .
- raw echoes are received according to a triple-wait-time activation sequence, such as shown in Fig. 1 .
- step 20 in a preferred embodiment the method applies certain corrections to the raw data generally designed to improve the signal-to-noise ratio of the received signal.
- step 20 the raw data undergoes a phase correction and/or a running average correction. Both corrections are known in the art and thus will not be considered in detail.
- phase correction for the ' CPMG echo train, if r(n) is the magnitude for the nth echo in a CPMG echo train, and a(n) is its angle (in radians) the phase correction for the ' CPMG echo train is given by the following pseudo-code:
- the above processing sequence separates signal with noise in one channel and noise only in the secondary channel (i.e., the imaginary part following the correction), and has the additional benefit of reducing the original complex number representation to working with real numbers.
- a running average correction (using 8 or 16 echos) can also be applied as known in the art in step 20 to further improve the signal-to-noise ratio.
- step 20 the processing algorithm is separated into two branches. Generally, hydrocarbon volumes and T 1 estimates are determined in the right branch. In the left branch, the long T w and frequency 4 echo data are inverted to obtain T 2 distributions that are combined to obtain an apparent total porosity, capillary- and clay-bound water volumes, and other parameters of interest.
- the method generally comprises four steps. First, the T 2 's of the hydrocarbons are determined. In the second step, the determined T 2 's are used to extract hydrocarbon signal amplitudes from two echo difference trains. In accordance with the present invention these amplitudes are used to compute T 1 values for the hydrocarbons, as shown below. Corrections for hydrogen index and polarization (T 1 ) are applied to the signal amplitudes in the last step to compute the hydrocarbon volumes. In the left processing branch, apparent total pore (or fluid) volume ⁇ ta is derived from the T WL and frequency 4 T 2 distributions.
- step 30 of the method is formed the difference Edif1 between echo signals with a long wait time T WL and the first short wait time T WS1 .
- two or more measurements (data groups) associated with different frequencies can be combined (i.e., averaged) to result in a single data stream.
- forming the difference Edif1 corresponds to forming differences between echo signals in the C and D data groups.
- the difference signal carries information essentially about the hydrocarbon phase which has a single T 1 and T 2 values, because the water contribution is canceled out.
- step 40 is computed the T 2 spectrum of the Edif1 difference signal.
- step 50 of the method are determined T 2 values for the corresponding hydrocarbon components from the T 2 spectrum of the difference signal.
- this involves locating the peaks of the T 2 spectrum and assigning the values for the peak(s) as the T 2 values of the respective hydrogen components. It will be appreciated that relatively long T 2 peak values generally correspond to oil components, while relatively short T 2 values generally correspond to gas components.
- step 60 the difference signals Edif1 and Edif2 are used to compute two apparent hydrocarbon volumes. In a preferred embodiment, this is done by using matched filters to fit exponential terms to each echo difference train.
- step 80 is formed the Edif2 difference signal between the T WL and T WS2 signals. With reference to Fig.1 this corresponds to forming the difference between the A and B data groups. It will be appreciated that T WS2 is longer than T WS1 .
- the T 1 's from the triple-wait-time experiments are found by solving Eqn. (2) or Eqn. (3) when A(T WS1 ,T WL ,T 1,p1 ) and A(T WS2 ,T WL ,T 1,p1 ) are replaced with the Edif1 and Edif2 signal amplitudes, respectively, for each experiment.
- the most probable value for T 1mp in a hydrocarbon zone of formation is then used in step 110 to compute corrected hydrocarbon volumes ⁇ h .
- step 120 is determined the total apparent porosity ⁇ ta , using T WL and frequency 4 T 2 distributions.
- the determination is done by combining a long T w (i.e., data group A and/or C) and frequency 4 echo data (data group E).
- the combination is done by separately computing the T 2 spectra of the two echo signals and generating a composite signal where below certain limit, i.e., 4 ms, data group E is used, while above that merge point the T WL distribution is applied.
- the total porosity ⁇ t is computed from the total apparent porosity ⁇ ta , and corrections for HI and polarization of water and hydrocarbons based on the apparent fluid volumes and T 1 s computed in the right processing branch.
- corrected total porosity is obtained using the corrections in Eqn. (4).
- oil and gas corrections can be computed in a specific embodiment by ⁇ h * exp(- T WL / T 1 mp ).
- correction for under-polarized water can be computed as a fluid phase in the right branch of the algorithm.
- Alternative corrections for water can be applied as known in the art.
- step 140 is determined the total water volume as the difference between the total porosity and the total hydrocarbon volume. From the quantities determined thus far, in the final step 150 of the algorithm are computed various parameters of interest, as shown in a specific embodiment in Fig. 2 .
- the data processing method illustrated in Fig. 2 is a preferred embodiment designed to operate with the data acquisition sequence in Fig. 1 .
- Alternative embodiments are possible and will be apparent to persons of skill in the art.
- the individual steps discussed above can be implemented using alternative signal models and/or approaches.
- the specific use of equations (1) - (4) is not required in accordance with the present invention. For example, once the water contribution is canceled out, in the right branch of the algorithm one may consider different signal models, with increased number of parameters for increased accuracy.
- Case 1 A two-phase mixture, consisting of water and light oil (possibly oil filtrate) or water and gas.
- Edif1 and Edif2 are used to compute two apparent hydrocarbon volumes by using matched filters to fit exponential terms to each echo difference train.
- the parameter T 1 of the hydrocarbon phase can be determined readily.
- Case 1 A three-phase mixture of water, light oil (or oil filtrate), and gas.
- T 1 's for the hydrocarbon phases are given by applying Eqn. (2) separately for oil (phase p1) and gas (phase p2).
- T 1 values for the hydrocarbons can be computed directly from the known quantities.
- T 1 values a key element of the method for determining hydrocarbon T 1 values is the selection of the wait times.
- all T W values should be long enough to polarize the water signal fully, so that echo difference signals (i.e., Edif1, Edif2, ...) contain only hydrocarbon signals that have discrete T 1 and T 2 values for each phase.
- echo difference signals i.e., Edif1, Edif2, .
- the left side of Eqns. (2) and (3) must be from 1.4 to 5 for T 1 to be accurately determined.
- the delay times must be chosen to keep the overall activation set cycle time as short as possible to maximize logging speed.
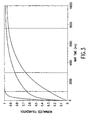
- the middle curve represents an equal mixture of the water and hydrocarbon phases.
- accurate values for hydrocarbon T 1 and volume can be obtained with the triple-wait-time method when wait times of 1, 3, and 8 seconds (indicated by the vertical lines) are used.
- T 1 For good hydrocarbon T 1 determinations, F should be 1.4 or larger.
- T W T WS1
- T WS2 8-second
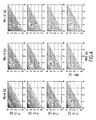
- these crossplots can be used in selecting the best wait-time combination for a given set of logging conditions. For example, based on the above criteria and the information in Figs. 3 and 4 , the three T W values for a typical Gulf of Mexico well can be selected as 1, 3, and 8 seconds. It should be apparent that for different conditions different T W can be selected using the crossplots shown in Fig. 4 , or the mathematical relationship expressed in Eqn. (5). The derivation of these tools is believed to be a significant contribution of the present invention.
- T 1 parameter corresponding to slow T 2 decay components in echo difference signals usually associated with light hydrocarbons, such as light oil, oil filtrate, and gas or free brine in large pores.
- a MARAN-1 laboratory spectrometer operating at a 1-MHz resonant frequency was used to obtain measurements on the bulk C 12 H 26 /doped water and sandstone core samples.
- a MRIL-Prime logging tool was used to perform experiments in a water-filled tank. The following describes the procedures and results obtained from each experiment.
- a 3.5-in. (inside diameter) glass sample holder was used to measure bulk fluids in the MARAN spectrometer. To determine the true volumes of the samples in arbitrary units, CPMG pulse sequences were used to make 10 measurements on separate samples of doped water and C 12 H 26 . The mean volume of the doped water sample was determined to be 136 ⁇ 0.7 arbitrary units. Similarly, the mean volume for the C 12 H 26 sample was found to be 108 ⁇ 0.9 arbitrary units. Inversion recovery measurements, consisting of 51 inversion recovery times, were performed separately on the samples. The data from these experiments were used to find bulk-fluid T 1 values of 395 ⁇ 1.8 and 995 ⁇ 4.7 ms, respectively, for the doped water and C 12 H 26 samples.
- T w s for determining T 1 and volume of hydrocarbon in a mixture of dodecane and doped water
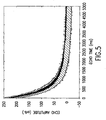
- Fig. 5 shows the triple-wait-time echo trains acquired for the 1-, 2-, and 8-second combination.
- the MAP algorithm was used to perform 21-bin T 2 inversions of the, 8-second wait-time echo trains. Overlay of triple-wait-time echo trains obtained in the laboratory from 30 CPMG experiments performed on a 1.26:1 mixture of doped water and C 12 H 26 .
- the top set of curves is the 8-second T w .
- the middle set is the 2-second T w .
- the bottom set of curves was acquired with a 1-second T w .
- the reader is directed to U.S. Pat. No. 5,517,115 ; and Prammer, M.G.: "NMR Pore Size Distributions and Permeability at the Well Site," paper SPE 28368 presented at the 1994 SPE Annual Technical Conference and Exhibition, New Orleans, Sept. 25-28 .
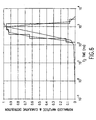
- Fig. 6 shows a uni-modal distribution of T 2 values.
- This T 2 distribution was selected at random from one of the 8-s T W CPMG experiments performed on the doped-water/C 12 H 26 mixture using this invention.
- a MAP inversion with 21 T 2 bins (indicated by the stair-step curve) was performed.
- the bin amplitudes, shown as the line joining T 2 times at the bin centers, have been normalized to the maximum bin amplitude.
- the dotted curve indicates the normalized cumulative amplitude as a function of T 2 time.
- the two liquid phases are not resolved in the T 2 spectrum at the signal-to-noise conditions for the single experiment shown.
- a similar situation occurs in many logging applications, which can make fluid typing difficult with only one kind of NMR acquisition.
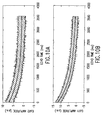
- Fig. 7 shows overlays of difference echo trains for the 30 CPMG triple-wait-time sequences performed on a doped-water/C 12 H 26 mixture.
- the top panel shows the Edif2 (8-second minus 2-second) differences and the bottom panel shows the Edif1 (8-second - 1-second).
- each panel includes the corresponding matched-filter fitted curves that provided the apparent C 12 H 26 volume for each experiment.
- Edif1 Assuming the doped water signals are eliminated in the Edif1 (8-second minus 1-second echo difference) echo train, Edif1 was used to determine the most probable hydrocarbon T 2 value - T 2mp. The value was found by performing T 2 inversions on each Edif1 echo train and computing the average of the largest T 2 modes observed in the 30 distributions.
- the apparent T 1 's from the triple-wait-time experiments were found by solving Eq. 1 when A(T WS1 ,T WL ,T 1,p1 ) and A(T WS2 ,T WL ,T 1,p1 ) were replaced with the Edif1 and Edif2 C 12 H 26 signal amplitudes, respectively, for each experiment.
- the most probable T 1 (average of the 30 experiments), T lmp , was then used to compute corrected hydrocarbon volumes (C 12 H 26 ) ⁇ h by applying Eqn.
- ⁇ h A o , Edif ⁇ 1 HI h ⁇ e - T WS ⁇ 1 T 1 ⁇ mp - e - T WL T 1 ⁇ mp , where HI h is the hydrogen index of the hydrocarbon, which is equal to 1 for C 12 H 26.
- the average T 1 and its standard deviation along with the average corrected volume and its standard deviation are given in Table 1 above.
- the absolute error for T 1 is 0.4%
- the absolute error for the volume of C 12 H 26 is 1.2%.
- Sandstone core filled with water and dodecane
- a three-step process was used to prepare 3.5- (diameter) by 4.5-in, sandstone core having 22.06% porosity for laboratory NMR experiments with water and C 12 H 26 pore fluids.
- the core was cleaned and saturated with a 4% potassium chloride (KCl) brine solution under 1 atmosphere of pressure. Then the sample was desaturated to a capillary pressure of 50 psi, and the brine volume in the core was decreased from 151.9 to 32.4 cm 3 . Under atmospheric conditions, 119.5 cm 3 of C 12 H 26 were added to the sample, and the core was placed in a closed glass sample holder before making NMR measurements.
- KCl potassium chloride
- the triple-wait-time echo trains acquired with the 0.4-, 1-, and 6-second combination are displayed in Fig. 8 .
- the figure shows overlay of triple-wait-time echo trains obtained in the laboratory from 28 CPMG experiments performed on a 22-p.u. sandstone core filled with a 4% KCl brine and C 12 H 26 .
- the top set of curves is the 6-second T w .
- the middle set is the 1-second T w .
- the bottom set of curves was acquired with a 0.4-second T w .
- Fig. 9 shows the results of a 21-bin inversion performed on one of the 6-second T w echo trains.
- the figure illustrates a T 2 distribution, selected at random, from one of the 6-s T w measurements performed on the brine- and C 12 H 26 -filled sandstone core.
- the sharp, high-amplitude peak in the 1,000-ms bin comes from the C 12 H 26 .
- the two lower amplitude peaks to the left are from the residual brine.
- the cumulative amplitude ratio (dotted curve) indicates that the volume ratio of C 12 H 26 to water is approximately 4:1, close to the materials balance ratio of 3.7:1.
- Fig. 10 shows overlays of difference echo trains for the 28 CPMG triple-wait-time sequences performed on the brine- and C 12 H 26 -filled sandstone core sample.
- the top panel shows the Edif2 (6-second minus 1-second) differences.
- the bottom panel shows the Edif1 (6-second minus 0.4-second). Matched-filter fitted curves are also shown for each experiment that provided the apparent C 12 H 26 volume.
- Edif1 and Edif2 were each fit to the exponential relationship in Eq. (1) to obtain the apparent C 12 H 26 signal amplitudes that were used in Eq. (3) to compute an apparent T 1 for each CPMG triple-wait-time sequence.
- Eq. (4) was then used to compute corrected C 12 H 26 volumes for comparison with the true value.
- the absolute error for T 1 is 5.5%
- the absolute error for the volume of C 12 H 26 is 1.4%.
- the Edif1 signal-to-noise ratio is defined for the examples in this paper as the first echo difference amplitude divided by the standard deviation of the mean of the last 100 echo difference amplitudes.
- Edif1 signal-to-noise ratio was approximately 5:1 in this series of experiments, compared with the 7:1 ratio obtained during the bulk fluid mixture experiments discussed previously. The larger errors obtained in this case are attributed to the poorer signal-to-noise quality of the measurements.
- the triple-wait-time method was also tested by the use of an MRIL-Prime tool in a freshwater-filled tank in which the water has a volume of 100 porosity units (p.u.) and a T 1 of approximately 2.5 seconds.
- Fig. 1 The activation set shown in Fig. 1 was used to acquire 48 sets of CPMG pulse sequences in the water tank for each wait time combination. In all but frequency 4, the collected echo trains consisted of 400 1.2-ms echoes. Table 3 lists the T 1 and volume results from each test, which show that the optimum combination of wait times for this setup is 1, 3, and 10 seconds.
- T w s for determining T 1 and volume of free fresh water in a water tank
- T 1 of fresh water (ms) ⁇ 2500 e 2180 2010 2059 2018 Standard dev. of T 1 (ms) 176.2 394.2 170.0 216.2 Volume of C 12 H 26 (arb.) 100 100.4 99.6 102 102 Standard dev. of the volume (arb.) 2.43 4.35 2.81 3.13 e
- the true T 1 and the volume of the water were obtained in a water tank used to calibrate MAIL-Prime tools.
- the water T 1 value obtained with the triple-wait-time method had a relatively large absolute error of 15%. It is believed that the acquisition time of 0.48 seconds (400 echoes x 1.2 ms/echo), which is short compared with the T 2 of bulk water and the 4:1 Edif1 signal-to-noise ratio, contributed substantially to this error.
- the activation set outlined in Fig. 1 has an important advantage over dual-frequency, dual-T w activations.
- Fig. 11 shows how the multifrequency triple-wait-time acquisition method, developed for the MRIL-Prime tool, improves the signal-to-noise ratio of Edif1 echo differences compared with those obtained with a dual-T w , dual frequency method.
- the examples shown were obtained in a freshwater-filled calibration tank.
- the MRIL-Prime Edif1 difference echo trains are displayed in the top panel.
- the dual-T w dual frequency Edif1 appears in the bottom panel.
- the multifrequency triple-wait-time method gives an echo difference signal-to-noise ratio that is 1.4 times better.
- the increase in Edif1 signal-to-noise ratio, shown in Fig. 11 is important because it influences the accuracy of T 2 's, T 1 's, and volumes of hydrocarbons (or free brine) derived from multi-wait-time measurements.
- the inventors have found that the proposed data acquisition and processing method result in substantial improvements over prior art methods.
- the new acquisition method brings a 1.4-time improvement to echo difference signal-to-noise ratios compared with previous implementations of dual-T w logging with dual-frequency tools.
- the triple-wait-time technique has been applied successfully to two-phase or three-phase mixtures of water and hydrocarbons - light oil (or oil filtrate) and gas.
- the time-dependent NMR T 2 signal for a three-phase mixture of oil, gas, and water in a water-wet formation can be expressed as a weighted sum of exponential terms
- a t T W HI g ⁇ 1 - e - T W T 1 ⁇ g ⁇ i ⁇ P g T 2 i e - t T 2 i + HI o ⁇ 1 - e - T W T 1 ⁇ o ⁇ i ⁇ P o T 2 i e - t T 2 i + ⁇ i ⁇ P w T 2 i 1 - e - T W T 1 ⁇ w i ⁇ e - t T 2 i
- P g (T 2 ), P o (T 2 ), P w (T 2 ) are the T 2 incremental porosity spectra of gas, oil and water, respectively.
- T 1 and T 2 are assumed to be linked through a constant ratio. See, e.g., Kleinberg, R.L., et al.: "Nuclear Magnetic Resonance of Rocks: T1 vs T2," paper SPE 26470 presented at the 1993 SPE Annual Technical Conference and Exhibition, Houston, Oct. 3-6 . Therefore, the index of T 1w is correlated with T 2 .
- a t T WL HI g ⁇ 1 - e - T WL T 1 ⁇ g ⁇ ⁇ g ⁇ e - t T 2 ⁇ g + HI o ⁇ 1 - e - T
- the hydrocarbon signal amplitudes in the Edif1 and Edif2 difference echo trains models can be obtained by applying matched-filter exponential fitting. Once the amplitudes have been determined for the two echo difference trains, the hydrocarbon T 1 's can be calculated by taking their ratio.
- a h T WS ⁇ 1 T WL T 1 ⁇ h A h T WS ⁇ 2 T WL T 1 ⁇ h e - T WS ⁇ 1 T 1 ⁇ h - e - T WL T 1 ⁇ h e - T WS ⁇ 2 T 1 ⁇ h - e - T WL T 1 ⁇ h
Landscapes
- Physics & Mathematics (AREA)
- Life Sciences & Earth Sciences (AREA)
- High Energy & Nuclear Physics (AREA)
- General Physics & Mathematics (AREA)
- Engineering & Computer Science (AREA)
- Environmental & Geological Engineering (AREA)
- Geology (AREA)
- General Life Sciences & Earth Sciences (AREA)
- Geochemistry & Mineralogy (AREA)
- Geophysics (AREA)
- Remote Sensing (AREA)
- Health & Medical Sciences (AREA)
- Chemical & Material Sciences (AREA)
- Analytical Chemistry (AREA)
- Biochemistry (AREA)
- General Health & Medical Sciences (AREA)
- Immunology (AREA)
- Pathology (AREA)
- Geophysics And Detection Of Objects (AREA)
- Sampling And Sample Adjustment (AREA)
Abstract
Description
- The present invention relates to borehole measurements and more particularly to a system and method for detecting the presence and estimating the quantity of gaseous and liquid hydrocarbons using nuclear magnetic resonance.
- Various methods exist for performing measurements of petrophysical parameters in a geologic formation. Nuclear magnetic resonance (NMR) logging, which is the focus of this invention, is among the best methods that have been developed for a rapid determination of such parameters, which include formation porosity, composition of the formation fluid, the quantity of movable fluid and permeability, among others. NMR measurements are environmentally safe and are essentially unaffected by matrix mineralogy, because NMR signals from the matrix decay too quickly to be detected by the current generation NMR logging tools. Thus, unlike conventional neutron, density, sonic, and resistivity logs, NMR logs provide information only on formation fluids. Importantly, however, NMR tools are capable of directly measuring rock porosity filled with the fluids. Even more important is the unique capability of NMR tools, such as NUMAR Corporation's MRIL® tool to distinguish among different fluid types, in particular, clay-bound water, capillary-bound water, movable water, gas, light oil, medium oil, and heavy oil by applying different sets of user-adjusted measurement parameters. (MRIL is a mark of NUMAR Corporation, a Halliburton company). This ability to detect the presence and estimate the volumes of different types of fluids is becoming one of the main concerns in the examination of the petrophysical properties of a geologic formation.
- To better appreciate how NMR logging can be used for fluid signal separation and estimating fluid volumes, it is helpful to briefly examine the type of parameters that can be measured using NMR techniques. It is well known that when an assembly of magnetic moments, such as those of hydrogen nuclei, are exposed in a NMR measurement to a static magnetic field they tend to align along the direction of the magnetic field, resulting in bulk magnetization. The rate at which equilibrium is established in such bulk magnetization upon provision of a static magnetic field is characterized by the parameter T1, known as the spin-lattice relaxation time. Another related and frequently used NMR logging parameter is the spin-spin relaxation time T2 (also known as transverse relaxation time), which relaxation is the loss of transverse magnetization due to non-homogeneities varying in time in the local magnetic field over the sensing volume of the logging tool. Both relaxation times provide information about the formation porosity, the composition and quantity of the formation fluid, and others.
- Another measurement parameter obtained in NMR logging is the diffusion of fluids in the formation. Generally, diffusion refers to the motion of atoms in a gaseous or liquid state due to their thermal energy. Self-diffusion is inversely related to the viscosity of the fluid, which is a parameter of considerable importance in borehole surveys. In a uniform magnetic field, diffusion has little effect on the decay rate of the measured NMR echoes. In a gradient magnetic field, however, diffusion causes atoms to move from their original positions to new ones, which moves also cause these atoms to acquire different phase shifts compared to atoms that did not move. This effect contributes to a faster rate of relaxation in a gradient magnetic field.
- NMR measurements of these and other parameters of the geologic formation can be done using, for example, the centralized MRIL® tool made by NUMAR Corporation, a Halliburton company, and the sidewall CMR tool made by Schlumberger. The MRIL® tool is described, for example, in
U.S. Pat. 4,710,713 to Taicher et al. and in various other publications including: "Spin Echo Magnetic Resonance Logging: Porosity and Free Fluid Index Determination," by Miller, Paltiel, Gillen, Granot and Bouton, SPE 20561, 65th Annual Technical Conference of the SPE, New Orleans, LA, Sept. 23-26, 1990; "Improved Log Quality With a Dual-Frequency Pulsed NMR Tool," by Chandler, Drack, Miller and Prammer, SPE 28365, 69th Annual Technical Conference of the SPE, New Orleans, LA, Sept. 25-28, 1994. Certain details of the structure and the use of the MRIL® tool, as well as the interpretation of various measurement parameters are also discussed inU.S. patents 4,717,876 ;4,717,877 ;4,717,878 ;5,212,447 ;5,280,243 ;5,309,098 ;5,412,320 ;5,517,115 ,5,557,200 ;5,696,448 and5,936,405 , all of which are commonly owned by the assignee of the present invention. The Schlumberger CMR tool is described, for example, inU.S. Pats. 5,055,787 and 5,055,788 to Kleinberg et al. and further in "Novel NMR Apparatus for Investigating an External Sample," by Kleinberg, Sezginer and Griffin, J. Magn. Reson. 97, 466-485, 1992. - It has been observed that the mechanisms determining the measured values of T1, T2 and diffusion depend on the molecular dynamics of the formation fluids being tested and on the types of fluids present. Thus, in bulk volume liquids, which typically are found in large pores of the formation, molecular dynamics is a function of both molecular size and inter-molecular interactions, which are different for each fluid. Water, gas and different types of oil each have different T1, T2 and diffusivity values. On the other hand, molecular dynamics in a heterogeneous media, such as a porous solid that contains liquid in its pores, differs significantly from the dynamics of the bulk liquid, and generally depends on the mechanism of interaction between the liquid and the pores of the solid media. It will thus be appreciated that a correct interpretation of the measured signals can provide valuable information relating to the types of fluids involved, the structure of the formation and other well-logging parameters of interest.
- If the only fluid in the formation is brine, a Carr-Purcell-Meiboom-Gill (CPMG) pulse sequence with a short inter-echo spacing (Te) and a long wait-time (Tw) can be applied for porosity determination and identification of capillary-bound and free water volumes. Total porosity logging methods are available to improve the quality of data used for determining pore volumes occupied by clay-bound and/or capillary-bound water. (See, for example, Prammer, M.G., et al.: "Measurements of Clay-Bound Water and Total Porosity by Magnetic Resonance Logging," paper SPE 36522 presented at the 1996 SPE Annual Technical Conference and Exhibition, Denver, Oct. 6-9). However, if hydrocarbons, such as formation oil and/or gas or filtrate from oil-based mud, coexist with brine, porosity determination and fluid typing (identification and quantification) with NMR becomes more difficult.
- Additional difficulties arise from the fact that NMR measurements impose limitations on the logging speed. For example, it is known in the art that for porosity determination all stimulated fluid protons should be sampled at full polarization. Therefore, a long wait time Tw is required to completely detect the magnetization from protons in slow Tl processes. For gas and light oil under typical formation conditions of temperature and pressure (100 - 300°F and 2,000 - 10,000 psi), Tl values of a few seconds occur at low-frequency (1- to 2-MHz) NMR. Wait times Tw of at least 10 seconds will capture nearly all the total proton magnetization arising from the individual Tl recovery rates encountered in petroleum logging. Such long wait times, combined with acceptable depth sampling, restrict the logging speed and reduce wellsite efficiency. One approach addressing this problem is the application of prepolarization and multislice (multifrequency) acquisitions implemented in the Magnetic Resonance Imaging Logging™ MRIL-Prime tool. See Prammer, M.G., et al.: "Theory and Operation of a New Multi-Volume NMR Logging System," paper DD presented at the 40th Annual SPWLA Logging Symposium, Oslo, Norway, May 30 - June 3, 1999. Still, it is believed that the capabilities of the MRIL tool have not yet been fully utilized.
- Turning to the problem of fluid typing by NMR, it is known that it relies on contrasts of characteristic parameters of the fluids, such as T1, T2, and diffusivity. Two or more CPMG data sets, which may not be completely polarized, are usually acquired to exploit parameter contrasts among the expected fluids. Using NMR logging to determine reservoir porosity occupied by gas or light oil currently requires data simultaneously acquired from at least two CPMG sequences having different wait-times. Examples of this method are disclosed in
U.S. Patent 5,936,405 to the assignee of the present application. - Dual-wait-time and dual-frequency methods have been applied to determine gas volumes in both clean and shaley sand formations. It is known that the success of the application depends primarily on two factors. First, adequate signal-to-noise levels in an echo train difference has to be maintained so that the gas-filled porosity and its transverse relaxation time T2 can be accurately characterized. Second, methods must be available to reliably estimate the longitudinal relaxation time T1 of the hydrocarbon phase needed to apply a necessary amplitude correction to the apparent hydrocarbon-filled porosity. It is clear that data acquisition and processing methods that address these two factors with success are highly desirable.
- NMR technology has been successfully applied to distinguish fluids, and significant progress has been made in determining porosity in mixed-fluid situations. The reader is directed for details to
WO/0026696 A1 published may 11, 2000 - Several researchers have acknowledged the importance of T1 in quantitative fluid typing. Obtaining enough saturation-recovery data points to derive an accurate and precise T1 distribution of a fluid at acceptable logging speeds and vertical resolution is difficult or nearly impossible. Consequently, most quantitative analyses rely on T1 values computed from correlation functions or by the application of assumptions to measured values. One disadvantage of such methods is that formation parameters, such as temperature, pressure, and fluid viscosity, may not be accurately known. In addition, attention must be directed to the ranges for which the correlation functions are valid. Prior art methods of deriving T1 involve either dual Tw's with one inter echo spacing Te or dual Tw's with multiple Te's. See Akkurt, R., Prammer, M.G., and Moore, M.A.: "Selection of Optimal Acquisition Parameters for MRIL Logs," The Log Analyst (Nov.-Dec. 1996) 43; and Chen, S., et al.: "Estimation of Hydrocarbon Viscosity with Multiple TE Dual Wait-Time MRIL Logs," paper SPE, 49009 presented at the 1998 SPE Annual Technical Conference and Exhibition, New Orleans, Sept. 27-30. Both methods referenced above assume that oil (or unpolarized brine) T2 signals are totally separated from brine T2 signals, which assumption is sometimes incorrect. Methods for obtaining gas T1 values from NMR logs have not been previously developed.
- In addition to being an important parameter for correcting apparent volumes of fluids for under-polarization, T1 computations play an important role in distinguishing one fluid from another. For example, it is well known that gas and light oil have large T1 values, and thus can be separated from brine, which typically has lower values for T1. Furthermore, fluid viscosity and self-diffusion coefficient D that can be obtained from a known T1 value can be used to separate gas from other fluids. Thus, large values for both T1 and D reliably indicate the presence of gas or light oil in a formation. Fluid viscosity can also be used in grouping liquids. Various additional contrast mechanisms are known in the art and are described, for example, in the above-referenced
WO/0026696 A1 GB 2 330 658 - The document describes a method for conducting NMR logging measurements, the method comprising receiving NMR echo signals from a population of particles in a geologic formation in response to at least two CPMG pulse sequences having short recovery times and at least one CPMG sequence having a long recovery time; and processing the received NMR echo signals to provide a data representation associated with a longitudinal relaxation time T1 of the population of particles.
- In view of the shortcomings of the prior art briefly outlined above, it is apparent that there is a need for a method and system that can take full advantage of the flexibility provided by current-generation NMR tools to enable the accurate calculation of T1 and T2 parameters for different fluids over the range of geologically meaningful values. This calculation in turn will enable reliable detection of the presence of gaseous and liquid hydrocarbons and estimation of their quantities.
- Accordingly, it is an object of the present invention to provide a method and apparatus using nuclear magnetic resonance (NMR) techniques that obviate problems associated with the prior art.
- In particular, a new triple-wait-time, multi-frequency acquisition method is disclosed and successfully tested. The method takes advantage of the multi-frequency operation of modern NMR logging tools to improve the signal-to-noise ratio of the received signals at high logging speeds. Further, the acquisition method enables accurate estimation of volumes for hydrocarbon and/or free water in addition to traditional clay-bound and capillary-bound water volumes.
- The new acquisition method uses optimized wait times to obtain better signal-to-noise ratios in echo train differential signals at faster logging speeds and acceptable vertical resolution. In turn, these signals can be used to determine formation fluid volumes, as well as estimates of hydrocarbon T1. Experiments performed on a mixture of dodecane (C12H26) and doped water, C12H26 and brine in a sandstone core, and fresh water produced fluid volumes with absolute errors of less than 1.5% for echo train differences with a signal-to-noise ratio larger than 4:1.
- In another aspect, the present invention provides a data processing method that enables the accurate determination of both T2 and T1 parameters of hydrocarbons based on the use of at least two difference NMR signals obtained at different wait times. The data acquisition and processing method of the present invention enable the determination of gas- and light-oil-filled porosity over a broad range of reservoir conditions. In another aspect, the present invention provides a decision mechanism to help in the selection of optimum acquisition parameters for logging applications.
- In particular, in accordance with the present invention is provided a (NMR) data acquisition method in accordance with
claim 1. - In a preferred embodiment, the method further comprises the step of computing the total porosity of the formation φt from the total apparent porosity φ ta and apparent volume corrections computed based on the provided data representation associated with the longitudinal time constant(s) T1 of the fluid phases.
- The present invention will be understood and appreciated more fully from the following detailed description taken in conjunction with the drawings in which:
-
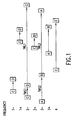
FIG. 1 is an illustration of the triple-wait time activation sequence used in a preferred embodiment of the present invention; -
FIG. 2 is a flow diagram illustrating the data processing method used in a preferred embodiment of the present invention; -
FIG. 3 is an illustration of hypothetical saturation recovery curves for water, hydrocarbon phase and a mixture of water and the hydrocarbon phase used in a specific embodiment of the present invention; -
FIG. 4 are waiting time TWS2 - TWS1 cross-plots that can be used in accordance with the present invention for the selection of optimum logging acquisition parameters; -
FIG. 5 is an overlay of triple-wait-time echo trains obtained from CPMG experiments performed in experiments performed on a 1.26:1 mixture of doped water and C12H26 for different Tw; -
FIG. 6 is a T2 distribution, selected at random, from one of the 8-s Tw CPMG experiments performed on a doped-water/C12H26 mixture; -
FIG. 7 shows overlays of difference echo trains for 30 CPMG triple-wait-time sequences performed on a doped-water/C12H26 mixture using the method of the present invention; -
FIG. 8 is overlay of triple-wait-time echo trains obtained in accordance with the present invention in a laboratory setting from 28 CPMG experiments performed on a 22-p.u. sandstone core filled with a 4% KCl brine and C12H26; -
FIG. 9 is a T2 distribution from a 6-s Tw measurement performed on the brine- and C12H26-filled sandstone core in accordance with the present invention; -
FIG. 10 shows overlays of difference echo trains for 28 CPMG triple-wait-time sequences performed on the brine- and C12H26-filled sandstone core sample, along with matched-filter curves; -
FIG. 11 illustrates an improvement in signal-to-noise ratio of Edif1 echo differences using the multifrequency triple-wait-time acquisition method of the present invention, compared with those obtained with a dual-Tw, dual frequency method. -
FIG. 12 is a block diagram of the apparatus in accordance with a preferred embodiment, which shows individual block components for controlling data collection, processing the collected data and displaying the measurement results. - In accordance with the present invention, NMR measurements are made using tools capable of performing separate, quasi-simultaneous measurements in different sensitive volumes by switching the operating frequency of the tool.
Fig. 12 is a block diagram of a generic system used in accordance with the present invention, and shows individual block components for controlling data collection, for processing the collected data and displaying the measurement results. As shown inFig. 12 , the system has a portion 32 (generally comprising a magnet array and antenna(s)) which is arranged to be lowered into a borehole. The tool'selectronic section 30 comprises a probe controller and pulse echo detection electronics. The output signal from the detection electronics is processed bydata processor 52 to analyze the relaxation characteristics of the material being investigated in the sensitive volume, generally designated as 34. The output of thedata processor 52 is provided to theparameter estimator 54. Generally,data processor 52 selects the desired data acquisition technique and the corresponding set of measurement parameters. - Dependent on the selected data acquisition technique,
measurement cycle controller 55 provides an appropriate control signal to the probe. In a specific embodiment, data from the log measurement is stored indata storage 56. In a preferred embodiment, raw data received by the tool can be pre-processed downhole by theelectronic section 30.Data processor 52 is connected to display 58, which is capable of providing a graphical display of one or more measurement parameters, possibly superimposed on display data fromdata storage 56. - For the purposes of this invention it is important that the tool is capable of "hopping" from one operating frequency to another, the effect of which is to shift the radial position of the resonant volume of the tool. The frequency shift is selected in such manner that two or more non-overlapping resonant volumes are formed; each new resonant volume associated with a different frequency being filled with fully relaxed protons. Hopping between two or more (i.e., K) frequencies thus allows reducing the time between experiments approximately by a factor of K, without compromising complete T1 measurements or adopting imprecise empirical T1/T2 relationships; the logging speed for the tool can accordingly be increased approximately K times.
- The components of the system of the present invention shown in
Fig. 12 can be implemented in hardware or software, or any combination thereof suitable for practical purposes. Preferably, the data processing algorithms used in accordance with the invention are programmed into software which is stored in a computer storage medium for execution on a computer, such asdata processor 52. In a preferred embodiment, NMR measurements in accordance with the present invention are done using Numar Corporation's (a Halliburton Company) MRIL® tools having multi-frequency capability, such as the MRIL® -Prime tool. Details of the structure, the operation and the use of logging tools, as illustrated inFig. 12 , are also discussed, for example, inU.S. patents 4,717,876 ;4,717,877 ;4,717,878 ;5,212,447 ;5,280,243 ;5,309,098 ;5,412,320 ;5,517,115 ;5,557,200 ;5,696,448 and5,936,405 to the assignee of the present application. - In accordance with a preferred embodiment of the present invention, the multi-frequency capability of the operating tool is used to provide a new data acquisition method, which is particularly suitable for the detection of gas and other hydrocarbons on the basis of NMR measurements with different wait times Tw. To this end, with reference to
Fig. 1 , a novel interleaved pulse sequence is proposed using triple-wait-time activation. -
Fig. 1 generally illustrates a method for measuring volumes occupied by hydrocarbons, and in particular shows a triple-wait-time activation sequence of the preferred embodiment. As shown, the activation sequence used in a preferred embodiment of the present invention uses seven resonant frequencies, which are grouped into four frequency bands designated 1, 2, 3, and 4. The specific frequencies used in these four bands depend on the characteristics of the tool and the desirable sensitive volume. In a specific embodiment using Numar Corporation's MRIL tool, the nominal center frequencies forbands Fig. 1 are 620 kHz, 650 kHz, 680 KHz and 760 kHz, respectively. As shown, in a preferred embodiment of the method there are two frequencies each corresponding tofrequency bands Fig. 1 by plus and minus signs appended to the band number, are +6 and -6 kHz relative to the band center frequency in a specific embodiment. In the embodiment illustrated inFig. 1 ,band 4 is a single frequency band that operates at a nominal frequency of 760 kHz for the MRIL tool. It can be shown that in this embodiment the radial distance between the inner- and outer-most sensitive volumes is less than 2.54 cm (one inch). - For ease of notation, data groups acquired using identical wait times Tw have identical labels, and are designated A, B, C, D and E. As shown in
Fig.1 in general there are four wait times involved in the measurements performed at the 1-, 1+, 2-, 2+, 3-, and 3+ frequencies - two relatively short wait times designated TWS1, and TWS2, and two relatively long wait times, TWL1 and TWL2. However, at normal logging speeds measurement volumes with these frequencies are completely replenished with protons that have been fully polarized during the TWL1 and TWL2 delays. For example, this may be due to the length of the wait time interval and/or the use of pre-polarizing magnets. Thus, for practical purposes the activation sequence of the present invention effectively involves only one long wait time TWL, which is used for data processing purposes. In a preferred embodiment this wait time TWL is selected as the longest delay time TWL1 shown inFig. 1 . - In accordance with the present invention, and with further reference to
Fig. 2 , four frequencies (1-, 1 +, 2-, and 2+) in the activation sequence shown inFig. 1 provide improved signal-to-noise ratio in echo train differences compared with prior art data acquisitions made with dual-frequency tools. As explained below, measurements performed at these frequencies (data groups C and D) are generally used to obtain T2 estimates and apparent hydrocarbon volumes. On the other hand, NMR signals obtained from the combination of the 1-, 1+, 2-, 2+, 3-, and 3+ frequencies (data groups A, B, C and D) are used in accordance with the present invention to determine hydrocarbon T1 values. In turn, these values are used to make polarization corrections to apparent hydrocarbon volumes derived from the 1-, 1+, 2-, and 2+ frequency measurements. - In a preferred embodiment, measurements at frequency band 4 (data groups E in
Fig. 1 ) consist of a small number of high-quality echoes. Data groups E are used to improve the precision in measuring rapid T2 decay components usually associated with clay-bound water and/or capillary-bound water. - In accordance with the present invention, the design of the activation sequence illustrated in a preferred embodiment in
Fig. 1 also improves the logging speed of the tool. It is known in the art that under the influence of tool motion, RF, magnetic field values, and sensitive volume can not be constant at a particular location in a formation. See, for example, Edwards, C.M.: "Effects of Tool Design and Logging Speed on T2 NMR Log Data," paper RR presented at the 38th Annual SPWLA Logging Symposium, Houston, June 15-18, 1997. As a consequence, apparent T2 values decrease with increasing logging speed. It is clear that the addition of more frequencies (measurement volumes) in accordance with the present invention causes a larger volume of formation to be sampled per unit length of tool motion, so that a greater signal-to-noise ratio (SNR) is attained. In the alternative, for a given SNR one can obtain higher logging speed. It has been determined that for the acquisition sequence illustrated inFig. 1 , using the MRIL tool of the preferred embodiment, the maximum logging speed is about 274 m/hr (900 ft/hr), which gives a vertical resolution of approximately 914 mm (3 ft) and minimizes the influence of logging speed on T2 determination. - It will be appreciated by those of skill in the art that in alternative embodiments of this invention a different, for example larger, number of frequency bands and/or frequencies per band can be used in the activation sequence. It should be apparent that in such alternative embodiments one can increase the SNR of the received signals by combining more data groups per data point. For example, with reference to
Fig. 1 , instead of two data groups C for the first data point (one at frequency band 1- and one at frequency band 2-) one can use a higher number. In an alternative embodiment, a single data group can be used per data point. As illustrated inFig. 1 , data for the three different recovery times need not necessarily be obtained from only three different frequencies. For example, two or more measurements associated with different frequencies can be combined (i.e., averaged) to result in a single data stream corresponding to either a short, or a long recovery time. Additional modifications in the parameters of the pulse sequences can be applied, as known in the art. For example, it is known that the contrast between liquid and gas signals can be enhanced by using a slightly larger pulse-echo spacing for the CPMG train associated with the shorter recovery interval. Modifications of this type are straightforward extensions of the activation sequence illustrated inFig. 1 . - The activation sequence illustrated in a preferred embodiment in
Fig. 1 is believed to have at least two significant advantages over the prior art, including dual-Tw, dual-frequency methods for determining volumes of gas or light oil. First, the addition of more frequencies (measurement volumes) causes a larger volume of formation to be sampled per unit length of tool motion so that a greater signal-to-noise ratio (SNR) is attained in the echo train differential signals used to determine apparent hydrocarbon volumes. Second, the acquisition sequence has the important advantage that interlaced measurements having three wait times enable the computation of T1 values for the hydrocarbon phases in the formation, as shown below. - In accordance with a preferred embodiment of the present invention, data acquired with the new activation sequence discussed above is processed as shown in
Fig. 2 . In particular, atstep 10 raw echoes are received according to a triple-wait-time activation sequence, such as shown inFig. 1 . Instep 20, in a preferred embodiment the method applies certain corrections to the raw data generally designed to improve the signal-to-noise ratio of the received signal. In a specific embodiment, instep 20 the raw data undergoes a phase correction and/or a running average correction. Both corrections are known in the art and thus will not be considered in detail. For purposes of illustration, in a specific embodiment implementing phase correction, if r(n) is the magnitude for the nth echo in a CPMG echo train, and a(n) is its angle (in radians) the phase correction for the ' CPMG echo train is given by the following pseudo-code: - 1) First find the Phase correction angle A over a group of M echos (where M = 2-10 in a specific embodiment)

- 2) Apply phase correction, i.e., phase rotation to the individual echos using

- 3) obtain phase corrected values using

- It will be appreciated that the above processing sequence separates signal with noise in one channel and noise only in the secondary channel (i.e., the imaginary part following the correction), and has the additional benefit of reducing the original complex number representation to working with real numbers.
- In a specific embodiment, a running average correction (using 8 or 16 echos) can also be applied as known in the art in
step 20 to further improve the signal-to-noise ratio. - With reference to
Fig. 2 , followingstep 20 the processing algorithm is separated into two branches. Generally, hydrocarbon volumes and T1 estimates are determined in the right branch. In the left branch, the long Tw andfrequency 4 echo data are inverted to obtain T2 distributions that are combined to obtain an apparent total porosity, capillary- and clay-bound water volumes, and other parameters of interest. - Focusing first on the determination of hydrocarbon volumes, in accordance with the present invention the method generally comprises four steps. First, the T2's of the hydrocarbons are determined. In the second step, the determined T2's are used to extract hydrocarbon signal amplitudes from two echo difference trains. In accordance with the present invention these amplitudes are used to compute T1 values for the hydrocarbons, as shown below. Corrections for hydrogen index and polarization (T1) are applied to the signal amplitudes in the last step to compute the hydrocarbon volumes. In the left processing branch, apparent total pore (or fluid) volume φ ta is derived from the TWL and frequency 4 T2 distributions. Corrected total pore volume φ1 is then computed as the sum of φ ta and hydrocarbon volume corrections (Δφ o and Δφ g ) that are functions of the T1's and hydrogen indices of the hydrocarbon phases. An additional correction (Δφ w ) may be required for under-polarized water, before various other parameters of interest are determined.
- In particular, at
step 30 of the method is formed the difference Edif1 between echo signals with a long wait time TWL and the first short wait time TWS1. As shown inFig. 1 , in a preferred embodiment two or more measurements (data groups) associated with different frequencies can be combined (i.e., averaged) to result in a single data stream. Again with reference toFig.1 , forming the difference Edif1 corresponds to forming differences between echo signals in the C and D data groups. It will be appreciated by those skilled in the art that the difference signal carries information essentially about the hydrocarbon phase which has a single T1 and T2 values, because the water contribution is canceled out. In the followingstep 40 is computed the T2 spectrum of the Edif1 difference signal. Various ways of computing this spectrum are known in the art. In a preferred embodiment, one can use the MAP algorithm as disclosed inU.S. Pat. No. 5,517,115 to the assignee of the present application, or in Prammer, M.G.: "NMR Pore Size. Distributions and Permeability at the Well Site," paper SPE 28368 presented at the 1994 SPE Annual Technical Conference and Exhibition, New Orleans, Sept. 25-28. - In
step 50 of the method are determined T2 values for the corresponding hydrocarbon components from the T2 spectrum of the difference signal. In a specific embodiment, this involves locating the peaks of the T2 spectrum and assigning the values for the peak(s) as the T2 values of the respective hydrogen components. It will be appreciated that relatively long T2 peak values generally correspond to oil components, while relatively short T2 values generally correspond to gas components. - Having determined the value(s) for the T2 of the hydrocarbon components, in the following steps 60-90 the difference signals Edif1 and Edif2 are used to compute two apparent hydrocarbon volumes. In a preferred embodiment, this is done by using matched filters to fit exponential terms to each echo difference train. First, in
step 80 is formed the Edif2 difference signal between the TWL and TWS2 signals. With reference toFig.1 this corresponds to forming the difference between the A and B data groups. It will be appreciated that TWS2 is longer than TWS1. - Next, the apparent hydrocarbon signal amplitudes (gas and/or oil), A0, in the Edif1 and Edif2 echo difference trains are obtained by fitting the equation with matching filter, in this case exp(-t/T2mp), for gas and oil:

step 50 for a hydrocarbon zone, for the hydrocarbon phase component (gas or oil). On output, method steps 70 and 90 will give the two apparent hydrocarbon signal amplitudes A0, corresponding to the two difference signals (Edif1 and Edif2). - Next, in
step 100 of the method is determined the value for the T1 parameter(s) for the hydrocarbon phases, using the following equation (separately for oil (phase p1) and gas (phase p2)):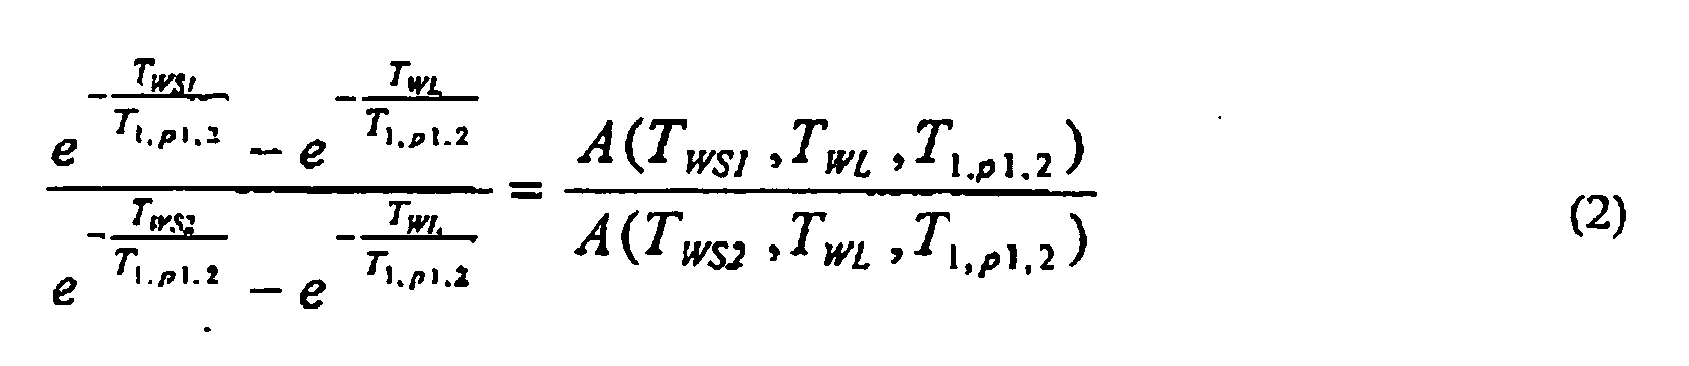

- The T1's from the triple-wait-time experiments are found by solving Eqn. (2) or Eqn. (3) when A(TWS1,TWL,T1,p1) and A(TWS2,TWL,T1,p1) are replaced with the Edif1 and Edif2 signal amplitudes, respectively, for each experiment. The most probable value for T1mp in a hydrocarbon zone of formation, is then used in
step 110 to compute corrected hydrocarbon volumes φ h . In a preferred embodiment, this is done by applying
- Turning next to the left branch of the processing algorithm illustrated in
Fig. 2 , instep 120 is determined the total apparent porosity φ ta , using TWL and frequency 4 T2 distributions. In a specific embodiment, the determination is done by combining a long Tw (i.e., data group A and/or C) andfrequency 4 echo data (data group E). In a specific embodiment, the combination is done by separately computing the T2 spectra of the two echo signals and generating a composite signal where below certain limit, i.e., 4 ms, data group E is used, while above that merge point the TWL distribution is applied. - In the
following step 130 the total porosity φ t , is computed from the total apparent porosity φ ta , and corrections for HI and polarization of water and hydrocarbons based on the apparent fluid volumes and T1s computed in the right processing branch. In a specific embodiment, corrected total porosity is obtained using the corrections in Eqn. (4). Thus, for example, oil and gas corrections can be computed in a specific embodiment by φ h * exp(- TWL / T 1mp ). In certain instances correction for under-polarized water can be computed as a fluid phase in the right branch of the algorithm. Alternative corrections for water can be applied as known in the art. - In the
following step 140 is determined the total water volume as the difference between the total porosity and the total hydrocarbon volume. From the quantities determined thus far, in thefinal step 150 of the algorithm are computed various parameters of interest, as shown in a specific embodiment inFig. 2 . - The data processing method illustrated in
Fig. 2 is a preferred embodiment designed to operate with the data acquisition sequence inFig. 1 . Alternative embodiments are possible and will be apparent to persons of skill in the art. For example, the individual steps discussed above can be implemented using alternative signal models and/or approaches. Thus, the specific use of equations (1) - (4) is not required in accordance with the present invention. For example, once the water contribution is canceled out, in the right branch of the algorithm one may consider different signal models, with increased number of parameters for increased accuracy. - The application of the new method for determining the hydrocarbon T1 values is next illustrated in the following two cases.
- Case 1: A two-phase mixture, consisting of water and light oil (possibly oil filtrate) or water and gas.
- Following echo train correction, two echo train differences, Edif1 and Edif2, are used to eliminate the broadly distributed water signal, Edif1 = TWL - TWS1 (data group C minus group D) data and Edif2 = TWL - TWS2(A group minus B group) data. Next, Edif1 and Edif2 are used to compute two apparent hydrocarbon volumes by using matched filters to fit exponential terms to each echo difference train. The T1 for the hydrocarbon phase T1p31 is given by

- Case 1: A three-phase mixture of water, light oil (or oil filtrate), and gas.
- Matched-filter exponential fitting is performed on the Edif1 and Edif2 echo differences as above to obtain apparent volumes for each of the hydrocarbon phases. T1's for the hydrocarbon phases are given by applying Eqn. (2) separately for oil (phase p1) and gas (phase p2). As before, T1 values for the hydrocarbons can be computed directly from the known quantities.
- Based on the above discussion, it is apparent that a key element of the method for determining hydrocarbon T1 values is the selection of the wait times. Generally, all TW values should be long enough to polarize the water signal fully, so that echo difference signals (i.e., Edif1, Edif2, ...) contain only hydrocarbon signals that have discrete T1 and T2 values for each phase. In addition, in accordance with the present invention the left side of Eqns. (2) and (3) must be from 1.4 to 5 for T1 to be accurately determined. Moreover, the delay times must be chosen to keep the overall activation set cycle time as short as possible to maximize logging speed.
- In a typical Gulf of Mexico gas well, water T2 signals range from a few hundred microseconds to a few hundred milliseconds, and gas T1's are on the order of a few seconds. See, e.g., Akkurt, R., et al.: "NMR Logging of Natural Gas Reservoirs," Paper N presented at the 36th Annual SPWLA Logging Symposium, Paris, June 26-29, 1995.
Fig. 3 shows hypothetical saturation recovery curves for water (assuming T1 = 0.25 s) and hydrocarbon (assuming T1 = 3 s). The uppermost curve is for water with an assumed T1 = 0.25 s. From this, it can be seen that a TW of 1 second will achieve more than 95% polarization of the water signal. The bottom curve depicts a hydrocarbon phase (T1 = 3 s). The middle curve represents an equal mixture of the water and hydrocarbon phases. For two-phase mixtures of these fluids, accurate values for hydrocarbon T1 and volume can be obtained with the triple-wait-time method when wait times of 1, 3, and 8 seconds (indicated by the vertical lines) are used. - Shown in
Fig. 4 are crossplots of TWS1 and TWS2 with contour lines of
Fig. 4 , if a 1-second TW (TWS1) is needed to fully polarize the water signal and the possible hydrocarbon T1 could be as large as 6 seconds, then for an 8-second TWL the charts suggest that TWS2, should be 3 seconds. - In accordance with the present invention, these crossplots can be used in selecting the best wait-time combination for a given set of logging conditions. For example, based on the above criteria and the information in
Figs. 3 and4 , the three TW values for a typical Gulf of Mexico well can be selected as 1, 3, and 8 seconds. It should be apparent that for different conditions different TW can be selected using the crossplots shown inFig. 4 , or the mathematical relationship expressed in Eqn. (5). The derivation of these tools is believed to be a significant contribution of the present invention. - One of the main applications of the system and method of this invention stems from the need to determine accurately the T1 parameter corresponding to slow T2 decay components in echo difference signals usually associated with light hydrocarbons, such as light oil, oil filtrate, and gas or free brine in large pores. Three experiments were performed with mixtures of C12H26 and doped water, a sandstone core filled with water and C12H26, and a freshwater-filled tank to demonstrate the effectiveness of the proposed method. A MARAN-1 laboratory spectrometer operating at a 1-MHz resonant frequency was used to obtain measurements on the bulk C12H26/doped water and sandstone core samples. A MRIL-Prime logging tool was used to perform experiments in a water-filled tank. The following describes the procedures and results obtained from each experiment.
- A 3.5-in. (inside diameter) glass sample holder was used to measure bulk fluids in the MARAN spectrometer. To determine the true volumes of the samples in arbitrary units, CPMG pulse sequences were used to make 10 measurements on separate samples of doped water and C12H26. The mean volume of the doped water sample was determined to be 136±0.7 arbitrary units. Similarly, the mean volume for the C12H26 sample was found to be 108±0.9 arbitrary units. Inversion recovery measurements, consisting of 51 inversion recovery times, were performed separately on the samples. The data from these experiments were used to find bulk-fluid T1 values of 395±1.8 and 995±4.7 ms, respectively, for the doped water and C12H26 samples.
- The samples of doped water and C12H26 were combined and mixed to form a 1.26: 1 -volume ratio of doped water to C12H26. A series of tests were performed on the mixture in which different wait-time combinations were used to collect sets of 30 CPMG triple-wait-time experiments consisting of 5,000 1-ms echoes. Data from these tests were used to derive the C12H26 volumes and T1's that are shown in Table 1 below for each triple-wait-time combination trial. By comparing the true values with the results in Table 1, the smallest error occurred when a triple-wait-time combination of 1, 2, and 8 seconds was used.
Table 1-Optimization of Tws for determining T1 and volume of hydrocarbon in a mixture of dodecane and doped water True values TWs=1, 1.5,& 8s TWs=1, 2, & 8s TWs=1, 2.5,& 8 s TWs=1, 3, & 8 s T1 of C12H26 (ms) 995a 1162 991 1047 893 Standard dev. of T1 (ms) 4.7 158.1 66.4 74.2 150.9 Volume of C12H26 (arb.) 108b 92.9c 106.7c 102c 119.5c Standard dev. of the volume (arb.) 0.9 3.3 4.0 4.1 7.1 aTrue T1 was derived from an inversion recovery measurement with 51 inversion recovery times performed on a bulk sample.
bReported sample volume is the average signal amplitude at t = 0 obtained from T2 inversions performed on 10 CPMG measurements.
cThe volume of C12H26 in the doped water/C12H26 mixture is the same as the C12H26 sample. -
Fig. 5 shows the triple-wait-time echo trains acquired for the 1-, 2-, and 8-second combination. The MAP algorithm was used to perform 21-bin T2 inversions of the, 8-second wait-time echo trains. Overlay of triple-wait-time echo trains obtained in the laboratory from 30 CPMG experiments performed on a 1.26:1 mixture of doped water and C12H26. The top set of curves is the 8-second Tw. The middle set is the 2-second Tw. The bottom set of curves was acquired with a 1-second Tw. For details of the MAP algorithm the reader is directed toU.S. Pat. No. 5,517,115 ; and Prammer, M.G.: "NMR Pore Size Distributions and Permeability at the Well Site," paper SPE 28368 presented at the 1994 SPE Annual Technical Conference and Exhibition, New Orleans, Sept. 25-28. - An example from one experiment,
Fig. 6 shows a uni-modal distribution of T2 values. This T2 distribution was selected at random from one of the 8-s TW CPMG experiments performed on the doped-water/C12H26 mixture using this invention. A MAP inversion with 21 T2 bins (indicated by the stair-step curve) was performed. The bin amplitudes, shown as the line joining T2 times at the bin centers, have been normalized to the maximum bin amplitude. The dotted curve indicates the normalized cumulative amplitude as a function of T2 time. The two liquid phases are not resolved in the T2 spectrum at the signal-to-noise conditions for the single experiment shown. A similar situation occurs in many logging applications, which can make fluid typing difficult with only one kind of NMR acquisition. - To obtain only C12H26 signals, the triple-wait-time echo trains were used to generate two sets of echo train differences for each experiment, shown in
Fig. 7. Fig. 7 shows overlays of difference echo trains for the 30 CPMG triple-wait-time sequences performed on a doped-water/C12H26 mixture. The top panel shows the Edif2 (8-second minus 2-second) differences and the bottom panel shows the Edif1 (8-second - 1-second). In addition, each panel includes the corresponding matched-filter fitted curves that provided the apparent C12H26 volume for each experiment. - Assuming the doped water signals are eliminated in the Edif1 (8-second minus 1-second echo difference) echo train, Edif1 was used to determine the most probable hydrocarbon T2 value - T2mp. The value was found by performing T2 inversions on each Edif1 echo train and computing the average of the largest T2 modes observed in the 30 distributions.
- Apparent C12H26 signal amplitudes, A0, in the echo difference trains were obtained for each experiment by fitting the Eqn. (1), reproduced here for convenience

- The apparent T1's from the triple-wait-time experiments were found by solving Eq. 1 when A(TWS1,TWL,T1,p1) and A(TWS2,TWL,T1,p1) were replaced with the Edif1 and Edif2 C12H26 signal amplitudes, respectively, for each experiment. The most probable T1 (average of the 30 experiments), Tlmp, was then used to compute corrected hydrocarbon volumes (C12H26) φ h by applying Eqn. (4)

- A three-step process was used to prepare 3.5- (diameter) by 4.5-in, sandstone core having 22.06% porosity for laboratory NMR experiments with water and C12H26 pore fluids. The core was cleaned and saturated with a 4% potassium chloride (KCl) brine solution under 1 atmosphere of pressure. Then the sample was desaturated to a capillary pressure of 50 psi, and the brine volume in the core was decreased from 151.9 to 32.4 cm3. Under atmospheric conditions, 119.5 cm3 of C12H26 were added to the sample, and the core was placed in a closed glass sample holder before making NMR measurements.
- As before, several triple-wait-time combinations were investigated to determine the best set of wait times for the saturation state. Sets of 28 triple-wait-time CPMG pulse sequences were collected, which consisted of 9,000 0.4-ms echoes, for each wait-time combination. Data from these tests were used to derive the C12H26 volumes and T1's that are shown in Table 2 for each wait-time combination tried. The true C12H26 T1 value for these experiments was taken to be the same as the value determined in the bulk fluid experiments, and true C12H26 volume was normalized to core porosity. By comparing the true values with the results in Table 2, the smallest error occurred when a triple-wait-time combination of 0.4, 1, and 6 seconds was used.
Table 2-Optimization of Tws for determining T1 and volume of hydrocarbon in a sandstone core filled with water and dodecane True values TWs=0.4, 0.8,& 6 s TWs=0.4, 1 & 6 s TWs=0.4, 1.2,& 6 s TWs=0.4, 1.4,&6s T1 of C12H26 (ms) 995a 1149 1050 1157 1162 Standard dev. of T1 (ms) 4.7 12.5 12.0 11.6 10.5 Volume of C12H26 (arb.) 17.35d 17.09 17.10 16.97 17.02 Standard dev. of the volume (arb.) 0.140 0.060 0.060 0.061 0.073 aTrue T1 was derived from an inversion recovery measurement with 51 inversion recovery times performed on a bulk sample.
dActual C12H26 volume = C12H26 saturation x core porosity. - The triple-wait-time echo trains acquired with the 0.4-, 1-, and 6-second combination are displayed in
Fig. 8 . The figure shows overlay of triple-wait-time echo trains obtained in the laboratory from 28 CPMG experiments performed on a 22-p.u. sandstone core filled with a 4% KCl brine and C12H26. The top set of curves is the 6-second Tw. The middle set is the 1-second Tw. The bottom set of curves was acquired with a 0.4-second Tw. -
Fig. 9 shows the results of a 21-bin inversion performed on one of the 6-second Tw echo trains. The figure illustrates a T2 distribution, selected at random, from one of the 6-s Tw measurements performed on the brine- and C12H26-filled sandstone core. The sharp, high-amplitude peak in the 1,000-ms bin comes from the C12H26. The two lower amplitude peaks to the left are from the residual brine. The cumulative amplitude ratio (dotted curve) indicates that the volume ratio of C12H26 to water is approximately 4:1, close to the materials balance ratio of 3.7:1. - Edif1 and Edif2 echo differences (shown in
Fig. 10 ) were generated from the triple-wait-time echo trains to cancel the residual water signal. The most probable hydrocarbon T2 was extracted by inverting the Edif1 (6-second minus 0.4-second echo difference) echo trains. More specifically,Fig. 10 shows overlays of difference echo trains for the 28 CPMG triple-wait-time sequences performed on the brine- and C12H26-filled sandstone core sample. The top panel shows the Edif2 (6-second minus 1-second) differences. The bottom panel shows the Edif1 (6-second minus 0.4-second). Matched-filter fitted curves are also shown for each experiment that provided the apparent C12H26 volume. - Edif1 and Edif2 were each fit to the exponential relationship in Eq. (1) to obtain the apparent C12H26 signal amplitudes that were used in Eq. (3) to compute an apparent T1 for each CPMG triple-wait-time sequence. Eq. (4) was then used to compute corrected C12H26 volumes for comparison with the true value. The absolute error for T1 is 5.5%, and the absolute error for the volume of C12H26 is 1.4%. The Edif1 signal-to-noise ratio is defined for the examples in this paper as the first echo difference amplitude divided by the standard deviation of the mean of the last 100 echo difference amplitudes. Edif1 signal-to-noise ratio was approximately 5:1 in this series of experiments, compared with the 7:1 ratio obtained during the bulk fluid mixture experiments discussed previously. The larger errors obtained in this case are attributed to the poorer signal-to-noise quality of the measurements.
- The triple-wait-time method was also tested by the use of an MRIL-Prime tool in a freshwater-filled tank in which the water has a volume of 100 porosity units (p.u.) and a T1 of approximately 2.5 seconds.
- Again, several wait-time combinations were tried. The activation set shown in
Fig. 1 was used to acquire 48 sets of CPMG pulse sequences in the water tank for each wait time combination. In all butfrequency 4, the collected echo trains consisted of 400 1.2-ms echoes. Table 3 lists the T1 and volume results from each test, which show that the optimum combination of wait times for this setup is 1, 3, and 10 seconds.Table 3-Optimization of Tws for determining T1 and volume of free fresh water in a water tank True values TWs=1, 3,& 10 s TWs=2, 3 & 10 s TWs=1, 3.5,& 12 s TWs=1.5, 3.5,&6s T1 of fresh water (ms) ∼2500e 2180 2010 2059 2018 Standard dev. of T1 (ms) 176.2 394.2 170.0 216.2 Volume of C12H26 (arb.) 100 100.4 99.6 102 102 Standard dev. of the volume (arb.) 2.43 4.35 2.81 3.13 eThe true T1 and the volume of the water were obtained in a water tank used to calibrate MAIL-Prime tools. - Though an accurate water volume was obtained from the series of experiments, the water T1 value obtained with the triple-wait-time method had a relatively large absolute error of 15%. It is believed that the acquisition time of 0.48 seconds (400 echoes x 1.2 ms/echo), which is short compared with the T2 of bulk water and the 4:1 Edif1 signal-to-noise ratio, contributed substantially to this error.
- The activation set outlined in
Fig. 1 , however, has an important advantage over dual-frequency, dual-Tw activations. (See Akkurt, R., et al.: "NMR Logging of Natural Gas Reservoirs," Paper N presented at the 36th Annual SPWLA Logging Symposium, Paris, June 26-29, 1995). Because four frequencies are available to collect Edif1 echo-difference data, the signal-to-noise quality is 1.4 times better compared with the same data acquired with a dual-frequency activation. - Specifically,
Fig. 11 shows how the multifrequency triple-wait-time acquisition method, developed for the MRIL-Prime tool, improves the signal-to-noise ratio of Edif1 echo differences compared with those obtained with a dual-Tw, dual frequency method. The examples shown were obtained in a freshwater-filled calibration tank. The MRIL-Prime Edif1 difference echo trains are displayed in the top panel. The dual-Tw dual frequency Edif1 appears in the bottom panel. The multifrequency triple-wait-time method gives an echo difference signal-to-noise ratio that is 1.4 times better. The increase in Edif1 signal-to-noise ratio, shown inFig. 11 , is important because it influences the accuracy of T2's, T1's, and volumes of hydrocarbons (or free brine) derived from multi-wait-time measurements. - Based on the above, the inventors have found that the proposed data acquisition and processing method result in substantial improvements over prior art methods. Thus, for NMR signal differences having signal-to-noise ratios larger than 4: 1, the absolute errors in determining fluid volume were less than 1.5%. In general, the new acquisition method brings a 1.4-time improvement to echo difference signal-to-noise ratios compared with previous implementations of dual-Tw logging with dual-frequency tools. The triple-wait-time technique has been applied successfully to two-phase or three-phase mixtures of water and hydrocarbons - light oil (or oil filtrate) and gas.
- The following provides the mathematical foundation for the method outlined above. The time-dependent NMR T2 signal for a three-phase mixture of oil, gas, and water in a water-wet formation can be expressed as a weighted sum of exponential terms


- Models of the time-dependent signals in the Edif1 and Edif2 echo difference trains are obtained when Eqs. A-4 and A-5 are subtracted from Eq. A-3,

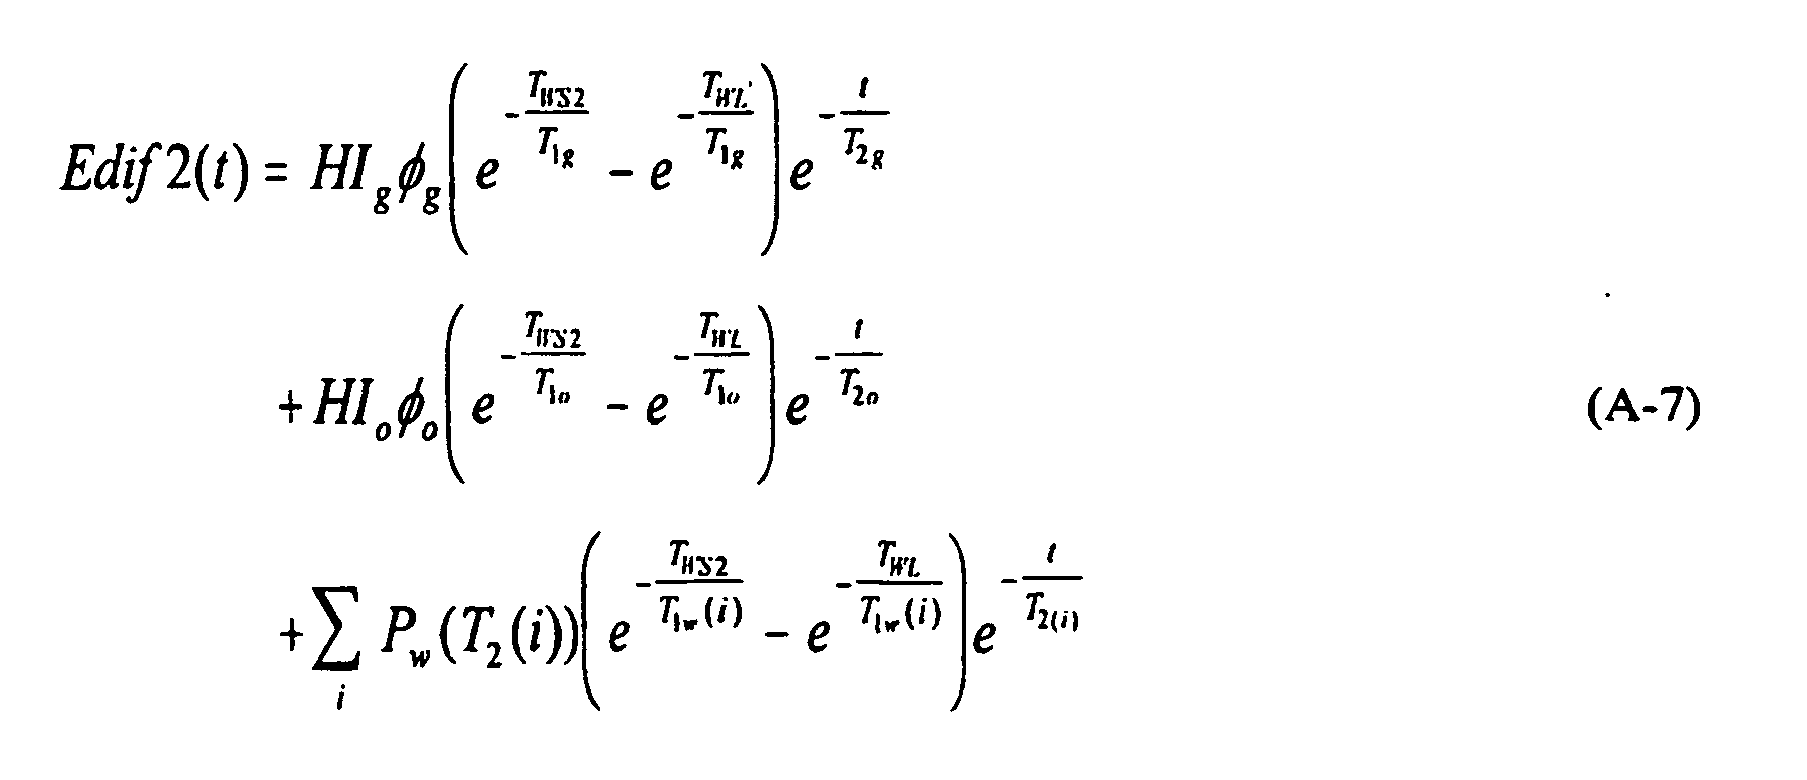
- When TWS1 is much larger than the maximum water T1 value, then contributions to Edif1 and Edif2 from under-polarized water become negligible and the last term in Eqs. A-6 and A-7 disappears. The product of hydrogen index, hydrocarbon porosity, and the differential polarization factor represents the amplitude of the hydrocarbon signal. Thus, Eqs. A-6 and A-7 simplify to biexponential equations


- The hydrocarbon signal amplitudes in the Edif1 and Edif2 difference echo trains models can be obtained by applying matched-filter exponential fitting. Once the amplitudes have been determined for the two echo difference trains, the hydrocarbon T1's can be calculated by taking their ratio. The hydrocarbon index and hydrocarbon porosity are canceled when the amplitude ratio is computed so that, for either hydrocarbon phase:

- For the reader's convenience, a list of all notations used in the description above is given next.
-
- A -
- amplitude, p.u.
- D -
- self-diffusion coefficient, cm2/s
- Edif1 -
- echo train difference from TWL and TWS1 data, p.u.
- Edif2 -
- echo train difference from TWL and TWS2, data, p.u.
- F -
- contour constant
- HI -
- hydrogen index
- P -
- incremental porosity
- t -
- time, s
- T1 -
- longitudinal NMR relaxation time, s
- T2 -
- transverse NMR relaxation time, s
- Te -
- echo spacing, ms
- Tw -
- wait-time, s
- TWL -
- long wait time in the triple-wait-time method, s
- TWS1 -
- shortest wait time in the triple-wait-time method, s
- TWS2 -
- second shortest wait time in the triple-wait-time method, s
- φ -
- porosity
-
- bvi -
- capillary-bound water
- cbw -
- clay-bound water
- g -
- gas
- h -
- hydrocarbon
- mp -
- most probable
- o -
- oil
- p1 -
- fluid phase one
- p2 -
- fluid phase two
- pw -
- producible water
- t -
- total
- ta -
- total apparent
- w -
- water
- While the invention has been described with reference to a preferred embodiment, it will be appreciated by those of ordinary skill in the art that modifications can be made to the structure and form of the invention without departing from its scope which is defined in the following claims.
Claims (17)
- A method for conducting NMR logging measurements, comprising:applying several CPMG pulse sequences to a geologic formation, at least two of said pulse sequences having short but different recovery times TWS1 and TWS2, respectively, and at least one of said pulse sequences having a long recovery time TWL;receiving NMR echo signals from a population of particles in said geologic formation in response to said pulse sequences;forming a first echo difference train by subtracting NMR echo signals acquired with the CPMG sequence having the short recovery time TWS1 from NMR echo signals acquired with the CPMG sequence having the long recovery time TWL and forming a second echo difference train by subtracting NMR echo signals acquired with the CPMG sequence having the short recovery time TWS2 from NMR echo signals acquired with the CPMG sequence having the long recovery time TWL;and processing the first echo difference train to determine a first hydrocarbon amplitude A(TWS1, TWL, T1,pi) for at leat one hydrocarbon fluid phase and processing the second echo difference train to determine a second hydrocarbon amplitude A(TWS2, TWL, T1,pi) for said at least one hydrocarbon fluid phase, wherein T1,pi is the longitudinal relaxation time for the ith hydrocarbon fluid phase;and estimating said longitudinal relaxation time T1,pi of the ith hydrocarbon fluid phase by solving the following equation for T1,pi:

- The method of claim 1, further comprising the step of computing a T2 distribution of the first echo difference train.
- The method of claim 2, further comprising determining a value for the T2 relaxation time of said at least one hydrocarbon phase.
- The method of claim 3, wherein the value for the T2 relaxation time is determined as the most probable value based on the T2 distribution of the first difference train.
- The method of claim 3, wherein the step of determining the first and second hydrocarbon amplitudes for said at least one hydrocarbon phase is based on the determine value for the T2 relaxation time and the first and second echo difference trains, respectively
- The method of claim 5, wherein the step of determining said first and second hydrocarbon amplitudes is performed using matched filters to fit a model to each difference train.
- The method of claim 5, wherein the step of determining a first and second hydrocarbon amplitudes from said difference trains is performed by fitting the equation:

- The method of claim 5, further comprising the step of computing corrected hydrocarbon volumes based on the computed value for the corresponding relaxation time T1,pi of said at least one hydrocarbon fluid phase.
- The method of claim 8, wherein the corrected volumes are computed using the equation:

- The method of claim 1, further comprising the step of computing the total apparent porosity φ ta of the geologic formation.
- The method of claim 10, further comprising the step of determining the total porosity of the formation φ t from the total apparent porosity φ ta and the hydrocarbon amplitudes of the fluid phases.
- The method of claim 11, further comprising the step of determining the total water volume as the difference between the total porosity and porosity associated with hydrocarbon phases.
- The method of claim 1, wherein the first and second short but different recovery times TWS1 and TWS2 are selected long enough to substantially polarize a water phase component in the population of particles.
- The method of claim 1, wherein the first and second short but different recovery times TWS1, TWS2 and the long recovery time TWL of the sets of CPMG pulses are selected such that water-phase contribution is substantially canceled in a difference signal formed by subtracting NMR signals corresponding to a relatively short recovery time from NMR signals corresponding to the relatively long recovery time TWL.
- The method of claim 1, wherein the three CPMG pulse sequences are applied in three different frequency bands.
- A computer software product adapted to implement the steps of the method of claim 1, on a computer controlling the operation of a NMR logging tool.
- A multi-frequency NMR logging tool arranged to perform NMR logging measurements according to the method of claim 1.
Applications Claiming Priority (3)
| Application Number | Priority Date | Filing Date | Title |
|---|---|---|---|
| US14894399P | 1999-08-13 | 1999-08-13 | |
| US148943P | 1999-08-13 | ||
| PCT/US2000/022252 WO2001013142A1 (en) | 1999-08-13 | 2000-08-11 | Nmr apparatus and methods for measuring volumes of hydrocarbon gas and oil |
Publications (3)
| Publication Number | Publication Date |
|---|---|
| EP1203242A1 EP1203242A1 (en) | 2002-05-08 |
| EP1203242A4 EP1203242A4 (en) | 2005-10-19 |
| EP1203242B1 true EP1203242B1 (en) | 2010-09-22 |
Family
ID=22528138
Family Applications (1)
| Application Number | Title | Priority Date | Filing Date |
|---|---|---|---|
| EP00955514A Expired - Lifetime EP1203242B1 (en) | 1999-08-13 | 2000-08-11 | Nmr apparatus and methods for measuring volumes of hydrocarbon gas and oil |
Country Status (5)
| Country | Link |
|---|---|
| US (1) | US6661226B1 (en) |
| EP (1) | EP1203242B1 (en) |
| CA (1) | CA2397385C (en) |
| DE (1) | DE60045007D1 (en) |
| WO (1) | WO2001013142A1 (en) |
Families Citing this family (32)
| Publication number | Priority date | Publication date | Assignee | Title |
|---|---|---|---|---|
| US6727696B2 (en) | 1998-03-06 | 2004-04-27 | Baker Hughes Incorporated | Downhole NMR processing |
| GB2403553B (en) * | 1999-12-15 | 2005-03-02 | Halliburton Energy Serv Inc | Method and apparatus for improving the vertical resolution of NMR logs |
| US6541969B2 (en) * | 1999-12-15 | 2003-04-01 | Halliburton Energy Services, Inc. | Method and apparatus for improving the vertical resolution of NMR logs |
| US20020175682A1 (en) | 2001-05-23 | 2002-11-28 | Songhua Chen | Rapid nmr multi-frequency t1 and t2 acquisition for earth formations evaluation with mwd or wireline tools |
| US6518756B1 (en) * | 2001-06-14 | 2003-02-11 | Halliburton Energy Services, Inc. | Systems and methods for determining motion tool parameters in borehole logging |
| US7301338B2 (en) | 2001-08-13 | 2007-11-27 | Baker Hughes Incorporated | Automatic adjustment of NMR pulse sequence to optimize SNR based on real time analysis |
| US6693557B2 (en) | 2001-09-27 | 2004-02-17 | Wavetronix Llc | Vehicular traffic sensor |
| US6859033B2 (en) * | 2002-08-28 | 2005-02-22 | Schlumberger Technology Corporation | Method for magnetic resonance fluid characterization |
| US6841996B2 (en) * | 2003-01-22 | 2005-01-11 | Schlumberger Technology Corporation | Nuclear magnetic resonance apparatus and methods for analyzing fluids extracted from earth formation |
| WO2004099817A2 (en) | 2003-05-02 | 2004-11-18 | Halliburton Energy Services, Inc. | Systems and methods for nmr logging |
| US6952096B2 (en) * | 2003-09-05 | 2005-10-04 | Schlumberger Technology Corporation | Method and apparatus for determining speed and properties of flowing fluids using NMR measurements |
| US7301337B2 (en) * | 2003-09-30 | 2007-11-27 | Baker Hughes Incorporated | Frequency dithering to avoid excitation pulse ringing |
| GB2422201B (en) | 2003-10-03 | 2007-06-06 | Halliburton Energy Serv Inc | System And Methods For T1-Based Logging |
| EP1702284A4 (en) * | 2003-12-24 | 2012-09-05 | Halliburton Energy Serv Inc | Contamination estimation using fluid analysis models |
| US7196516B2 (en) | 2004-08-16 | 2007-03-27 | Baker Hughes Incorporated | Correction of NMR artifacts due to constant-velocity axial motion and spin-lattice relaxation |
| US8248067B2 (en) * | 2004-09-24 | 2012-08-21 | Baker Hughes Incorporated | Apparatus and methods for estimating downhole fluid compositions |
| US7225078B2 (en) * | 2004-11-03 | 2007-05-29 | Halliburton Energy Services, Inc. | Method and system for predicting production of a well |
| US8665113B2 (en) | 2005-10-31 | 2014-03-04 | Wavetronix Llc | Detecting roadway targets across beams including filtering computed positions |
| CA2753347C (en) * | 2009-03-02 | 2017-09-26 | Statoil Asa | Method of adjusting properties of drilling fluids and apparatus for use in such methods |
| WO2011059543A1 (en) * | 2009-11-10 | 2011-05-19 | The Johns Hopkins University | Magnetic resonance imaging and spectroscopy of low concentration solutes with exchangeable protons using label transfer modules: frequency transfer, inversion transfer, and dephasing transfer |
| MX353733B (en) * | 2011-12-29 | 2018-01-26 | Schlumberger Technology Bv | In-situ characterization of formation constituents. |
| US10024938B2 (en) * | 2012-03-08 | 2018-07-17 | Schlumberger Technology Corporation | System and method for processing magnetic resonance signals |
| MX347327B (en) * | 2012-10-04 | 2017-04-24 | Schlumberger Technology Bv | Hydrocarbon saturation from total organic carbon logs derived from inelastic and capture nuclear spectroscopy. |
| US9412271B2 (en) | 2013-01-30 | 2016-08-09 | Wavetronix Llc | Traffic flow through an intersection by reducing platoon interference |
| US10338052B2 (en) | 2015-11-30 | 2019-07-02 | Vanderbilt University | Methods of detecting sulfur-containing compounds |
| US10739489B2 (en) * | 2016-01-15 | 2020-08-11 | Baker Hughes, A Ge Company, Llc | Low gradient magnetic resonance logging for measurement of light hydrocarbon reservoirs |
| EP3414557B1 (en) * | 2016-02-12 | 2019-11-27 | Bruker Biospin Corp. | Rapid quantification of components in solid mixtures of chemicals via time-domain nmr spectroscopy |
| US10267946B2 (en) | 2016-06-01 | 2019-04-23 | Baker Hughes, A Ge Company, Llc | Magnetic resonance pulse sequences having wait times based on carrier speed |
| CN110306977B (en) * | 2018-03-27 | 2021-10-29 | 中国石油化工股份有限公司 | Method and system for hydrocarbon-containing correction in nuclear magnetic resonance T2 spectrum |
| CN112268919B (en) * | 2020-09-25 | 2023-09-26 | 中国石油天然气股份有限公司 | A method for identifying tight sandstone reservoir fluids using nuclear magnetic resonance inversion |
| CN114137015B (en) * | 2021-12-03 | 2024-08-16 | 中国海洋石油集团有限公司 | Porosity correction method and device |
| US12590940B2 (en) * | 2022-03-11 | 2026-03-31 | Baker Hughes Oilfield Operations Llc | System and method for estimating reservoir fluid contamination |
Family Cites Families (99)
| Publication number | Priority date | Publication date | Assignee | Title |
|---|---|---|---|---|
| US1158959A (en) | 1912-07-16 | 1915-11-02 | Edward W Beach | Centrifugal separator. |
| US3395337A (en) | 1952-01-03 | 1968-07-30 | Varian Associates | Apparatus and method for identifying substances |
| US2973471A (en) | 1953-05-08 | 1961-02-28 | Texaco Development Corp | Analysis techniques based on nuclear magnetic resonance |
| US3617867A (en) | 1953-07-17 | 1971-11-02 | Texaco Inc | Method and apparatus for well logging utilizing resonance |
| US2912641A (en) | 1956-07-27 | 1959-11-10 | Texaco Development Corp | Analysis techniques based on nuclear magnetic resonance |
| US3360716A (en) | 1956-08-06 | 1967-12-26 | Varian Associates | Gyromagnetic resonance methods and apparatus |
| US3205477A (en) | 1961-12-29 | 1965-09-07 | David C Kalbfell | Electroacoustical logging while drilling wells |
| US3213357A (en) | 1962-10-22 | 1965-10-19 | California Research Corp | Earth formation and fluid material investigation by nuclear magnetism relaxation rate determination |
| US3402344A (en) | 1965-08-02 | 1968-09-17 | Chevron Res | Nuclear magnetism well logging method and apparatus |
| US3453433A (en) | 1966-12-08 | 1969-07-01 | Schlumberger Technology Corp | Combined sidewall neutron porosity gamma-gamma tool |
| US3508438A (en) | 1967-06-27 | 1970-04-28 | Schlumberger Technology Corp | Well logging apparatus and method |
| US3590228A (en) | 1967-10-02 | 1971-06-29 | Schlumberger Technology Corp | Methods and apparatus for processing well logging data |
| US3567935A (en) | 1968-02-07 | 1971-03-02 | Schlumberger Technology Corp | Measuring apparatus and method |
| US3567936A (en) | 1968-02-07 | 1971-03-02 | Schlumberger Technology Corp | Multiple neutron detector borehole logging tool |
| US3638484A (en) | 1968-11-05 | 1972-02-01 | Schlumberger Technology Corp | Methods of processing well logging data |
| US3593116A (en) | 1969-07-29 | 1971-07-13 | Schlumberger Technology Corp | Nuclear magnetic logging apparatus coil configuration |
| US3657730A (en) | 1970-01-14 | 1972-04-18 | Shell Oil Co | Method for determining residual hydrocarbons present in a subterranean earth formation |
| US3667035A (en) | 1970-03-17 | 1972-05-30 | Texaco Development Corp | Nuclear magnetism logging |
| FR2119862B1 (en) | 1970-12-30 | 1973-11-23 | Schlumberger Prospection | |
| US3784898A (en) | 1972-02-16 | 1974-01-08 | Shell Oil Co | Method for reducing borehole signals in nuclear magnetic logging |
| US4310887A (en) | 1972-08-28 | 1982-01-12 | Schlumberger Technology Corporation | Verification and calibration of well logs and reconstruction of logs |
| US3896668A (en) | 1973-10-05 | 1975-07-29 | Schlumberger Technology Corp | Methods and apparatus for determining characteristics of subsurface earth formations |
| US4479564A (en) | 1979-04-12 | 1984-10-30 | Schlumberger Technology Corporation | System and method for monitoring drill string characteristics during drilling |
| GB2056082B (en) | 1979-08-10 | 1983-07-06 | Emi Ltd | Nuclear magnetic logging |
| US4291271A (en) | 1979-11-01 | 1981-09-22 | Phillips Petroleum Company | Method for determining pore size distribution and fluid distribution in porous media |
| US4350955A (en) | 1980-10-10 | 1982-09-21 | The United States Of America As Represented By The United States Department Of Energy | Magnetic resonance apparatus |
| US4536714A (en) | 1982-04-16 | 1985-08-20 | Schlumberger Technology Corporation | Shields for antennas of borehole logging devices |
| USRE32913E (en) | 1982-04-16 | 1989-04-25 | Schlumberger Technology Corp. | Shields for antennas of borehole logging devices |
| US4656422A (en) | 1982-06-10 | 1987-04-07 | Paramagnetic Logging, Inc. | Oil well logging tools measuring paramagnetic logging effect for use in open boreholes and cased well bores |
| US4528508A (en) | 1982-06-10 | 1985-07-09 | Paramagnetic Logging, Inc. | Nuclear magnetic resonance method and apparatus for remote detection and volumetric measurement of petroleum reserves |
| GB8315866D0 (en) | 1983-06-09 | 1983-07-13 | Nat Res Dev | Nuclear magnetic logging |
| DE3504734C2 (en) | 1985-02-12 | 1998-12-10 | Max Planck Gesellschaft | Method and device for recording spin resonance data |
| US4792757A (en) | 1985-04-08 | 1988-12-20 | Paramagnetic Logging, Inc. | Oil well logging tools measuring paramagnetic logging effect for use in open boreholes and cased well bores |
| US4686364A (en) | 1985-07-19 | 1987-08-11 | Schlumberger Technology Corporation | In situ determination of total carbon and evaluation of source rock therefrom |
| US4728892A (en) | 1985-08-13 | 1988-03-01 | Shell Oil Company | NMR imaging of materials |
| US4710713A (en) | 1986-03-11 | 1987-12-01 | Numar Corporation | Nuclear magnetic resonance sensing apparatus and techniques |
| US4714881A (en) | 1986-07-15 | 1987-12-22 | Mobil Oil Corporation | Nuclear magnetic resonance borehole logging tool |
| US4717876A (en) | 1986-08-13 | 1988-01-05 | Numar | NMR magnet system for well logging |
| US5055787A (en) | 1986-08-27 | 1991-10-08 | Schlumberger Technology Corporation | Borehole measurement of NMR characteristics of earth formations |
| US4933638A (en) | 1986-08-27 | 1990-06-12 | Schlumber Technology Corp. | Borehole measurement of NMR characteristics of earth formations, and interpretations thereof |
| US4785245A (en) | 1986-09-12 | 1988-11-15 | Engineering Measurement Company | Rapid pulse NMR cut meter |
| US4717877A (en) | 1986-09-25 | 1988-01-05 | Numar Corporation | Nuclear magnetic resonance sensing apparatus and techniques |
| US4717878A (en) | 1986-09-26 | 1988-01-05 | Numar Corporation | Nuclear magnetic resonance sensing apparatus and techniques |
| US4875013A (en) | 1987-03-13 | 1989-10-17 | Hitachi, Ltd. | High-frequency coil for nuclear magnetic imaging |
| NO882570L (en) | 1987-06-11 | 1988-12-12 | Numar Corp | NUCLEAR MAGNETIC RESONANCE SENSOR DEVICE. |
| US4825163A (en) | 1987-07-31 | 1989-04-25 | Hitachi, Ltd. | Quadrature probe for nuclear magnetic resonance |
| US4829252A (en) | 1987-10-28 | 1989-05-09 | The Regents Of The University Of California | MRI system with open access to patient image volume |
| US4899112A (en) | 1987-10-30 | 1990-02-06 | Schlumberger Technology Corporation | Well logging apparatus and method for determining formation resistivity at a shallow and a deep depth |
| US4949045A (en) | 1987-10-30 | 1990-08-14 | Schlumberger Technology Corporation | Well logging apparatus having a cylindrical housing with antennas formed in recesses and covered with a waterproof rubber layer |
| US4987368A (en) | 1987-11-05 | 1991-01-22 | Shell Oil Company | Nuclear magnetism logging tool using high-temperature superconducting squid detectors |
| US4885540A (en) | 1988-10-31 | 1989-12-05 | Amoco Corporation | Automated nuclear magnetic resonance analysis |
| US5350925A (en) | 1988-12-08 | 1994-09-27 | Schlumberger Technology Corporation | Methods for determining values for earth formation properties |
| US4933640A (en) | 1988-12-30 | 1990-06-12 | Vector Magnetics | Apparatus for locating an elongated conductive body by electromagnetic measurement while drilling |
| US4994777A (en) | 1989-11-14 | 1991-02-19 | The United States Of America As Represented By The Secretary Of The Army | Enhanced magnetic field within enclosed cylindrical cavity |
| US5122746A (en) | 1990-06-12 | 1992-06-16 | Gas Research Institute | Hydrocarbon gas measurements using nuclear magnetic resonance |
| US5212447A (en) | 1990-12-03 | 1993-05-18 | Numar Corporation | Apparatus and technique for nmr diffusion measurement |
| DE69123260T2 (en) | 1990-12-05 | 1997-06-12 | Numar Corp., Malvern, Pa. | ARRANGEMENT FOR MEASURING A DRILL HOLE DURING DRILLING |
| US5138263A (en) | 1991-01-16 | 1992-08-11 | Teleco Oilfield Services Inc. | Electromagnetic formation evaluation tool |
| US5412320A (en) | 1991-05-16 | 1995-05-02 | Numar Corporation | Nuclear magnetic resonance determination of petrophysical properties of geologic structures |
| US5309098A (en) | 1991-05-16 | 1994-05-03 | Numar Corporation | Nuclear magnetic resonance detection of geologic structures |
| US5557200A (en) | 1991-05-16 | 1996-09-17 | Numar Corporation | Nuclear magnetic resonance determination of petrophysical properties of geologic structures |
| US5387865A (en) | 1991-09-20 | 1995-02-07 | Exxon Research And Engineering Company | Permeability determination from NMR relaxation measurements for fluids in porous media |
| US5200699A (en) | 1991-09-25 | 1993-04-06 | Phillips Petroleum Company | Evaluation of liquid-containing samples using nuclear magnetic resonance |
| US5235285A (en) | 1991-10-31 | 1993-08-10 | Schlumberger Technology Corporation | Well logging apparatus having toroidal induction antenna for measuring, while drilling, resistivity of earth formations |
| US5379216A (en) | 1992-05-27 | 1995-01-03 | Schlumberger Technology Corporation | Method and apparatus for producing a new output record medium illustrating a quantitative description in the volume dimension of mud filtrate invasion into permeable zones of a formation in a wellbore |
| US5923167A (en) | 1992-07-30 | 1999-07-13 | Schlumberger Technology Corporation | Pulsed nuclear magnetism tool for formation evaluation while drilling |
| US5629623A (en) | 1992-07-30 | 1997-05-13 | Schlumberger Technology Corporation | Pulsed nuclear magnetism tool for formation evaluation while drilling |
| DK0581666T3 (en) | 1992-07-30 | 1997-10-27 | Schlumberger Ltd | Pulse-modulated nuclear magnetic tool for formation evaluation during drilling |
| US5705927A (en) * | 1992-07-30 | 1998-01-06 | Schlumberger Technology Corporation | Pulsed nuclear magnetism tool for formation evaluation while drilling including a shortened or truncated CPMG sequence |
| US5453692A (en) | 1992-08-06 | 1995-09-26 | Hitachi, Ltd. | RF probe for nuclear magnetic resonance imaging (MRI) devices |
| DE4234544C2 (en) | 1992-10-14 | 1996-09-05 | Bruker Analytische Messtechnik | Directly coupled sample changing system for liquid NMR spectroscopy and method for its operation |
| US5432446A (en) | 1992-11-02 | 1995-07-11 | Schlumberger Technology Corporation | Borehole measurement of NMR characteristics of earth formation |
| US5486762A (en) | 1992-11-02 | 1996-01-23 | Schlumberger Technology Corp. | Apparatus including multi-wait time pulsed NMR logging method for determining accurate T2-distributions and accurate T1/T2 ratios and generating a more accurate output record using the updated T2-distributions and T1/T2 ratios |
| US5291137A (en) | 1992-11-02 | 1994-03-01 | Schlumberger Technology Corporation | Processing method and apparatus for processing spin echo in-phase and quadrature amplitudes from a pulsed nuclear magnetism tool and producing new output data to be recorded on an output record |
| US5363041A (en) | 1992-12-31 | 1994-11-08 | Schlumberger Technology Corporation | Determining bound and unbound fluid volumes using nuclear magnetic resonance pulse sequences |
| US5349184A (en) | 1993-01-21 | 1994-09-20 | Schlumberger Technology Corporation | Method and apparatus for reducing matrix density effects on porosity measurements during epithermal neutron porosity well logging |
| US5376884A (en) | 1993-04-01 | 1994-12-27 | Schlumberger Technology Corporation | Nuclear magnetic resonance measuring apparatus |
| US5517115A (en) | 1993-12-16 | 1996-05-14 | Numar Corporation | Efficient processing of NMR echo trains |
| US6392409B1 (en) * | 2000-01-14 | 2002-05-21 | Baker Hughes Incorporated | Determination of T1 relaxation time from multiple wait time NMR logs acquired in the same or different logging passes |
| US5497087A (en) * | 1994-10-20 | 1996-03-05 | Shell Oil Company | NMR logging of natural gas reservoirs |
| US5498960A (en) | 1994-10-20 | 1996-03-12 | Shell Oil Company | NMR logging of natural gas in reservoirs |
| AU711508B2 (en) | 1995-03-23 | 1999-10-14 | Schlumberger Technology B.V. | Nuclear magnetic resonance borehole logging apparatus and method |
| US5680043A (en) | 1995-03-23 | 1997-10-21 | Schlumberger Technology Corporation | Nuclear magnetic resonance technique for determining gas effect with borehole logging tools |
| US5565775A (en) | 1995-06-23 | 1996-10-15 | Exxon Research And Engineering Company | Producible fluid volumes in porous media determined by pulsed field gradient nuclear magnetic resonance |
| US5696448A (en) * | 1995-06-26 | 1997-12-09 | Numar Corporation | NMR system and method for formation evaluation using diffusion and relaxation log measurements |
| US5936405A (en) * | 1995-09-25 | 1999-08-10 | Numar Corporation | System and method for lithology-independent gas detection using multifrequency gradient NMR logging |
| US6242912B1 (en) * | 1995-10-12 | 2001-06-05 | Numar Corporation | System and method for lithology-independent gas detection using multifrequency gradient NMR logging |
| US5757186A (en) | 1996-02-23 | 1998-05-26 | Western Atlas International, Inc. | Nuclear magnetic resonance well logging apparatus and method adapted for measurement-while-drilling |
| US6005389A (en) | 1996-03-15 | 1999-12-21 | Numar Corporation | Pulse sequences and interpretation techniques for NMR measurements |
| US5767674A (en) | 1996-04-17 | 1998-06-16 | Griffin; Douglas D. | Apparatus for protecting a magnetic resonance antenna |
| US6023163A (en) * | 1996-06-14 | 2000-02-08 | Schlumberger Technology Corporation | Well logging method and apparatus for determining gas and diffusion coefficient using NMR |
| US5831433A (en) | 1996-12-04 | 1998-11-03 | Sezginer; Abdurrahman | Well logging method and apparatus for NMR and resistivity measurements |
| US5977768A (en) | 1997-06-23 | 1999-11-02 | Schlumberger Technology Corporation | Nuclear magnetic resonance logging with azimuthal resolution |
| US5992519A (en) | 1997-09-29 | 1999-11-30 | Schlumberger Technology Corporation | Real time monitoring and control of downhole reservoirs |
| US6049205A (en) * | 1997-10-01 | 2000-04-11 | Western Atlas International, Inc. | Multiple frequency method for nuclear magnetic resonance longitudinal relaxation measurement and pulsing sequence for power use optimization |
| US6094048A (en) * | 1997-12-18 | 2000-07-25 | Shell Oil Company | NMR logging of natural gas reservoirs |
| US5869755A (en) | 1997-12-31 | 1999-02-09 | Schlumberger Technology Corporation | Porosity estimation method in carbonate rock |
| US6229308B1 (en) * | 1998-11-19 | 2001-05-08 | Schlumberger Technology Corporation | Formation evaluation using magnetic resonance logging measurements |
| US10124997B2 (en) | 2015-03-18 | 2018-11-13 | Gray Manufacturing Company, Inc. | Remote lift control using independent computing devices |
-
2000
- 2000-08-10 US US09/636,502 patent/US6661226B1/en not_active Expired - Lifetime
- 2000-08-11 EP EP00955514A patent/EP1203242B1/en not_active Expired - Lifetime
- 2000-08-11 CA CA002397385A patent/CA2397385C/en not_active Expired - Fee Related
- 2000-08-11 DE DE60045007T patent/DE60045007D1/en not_active Expired - Lifetime
- 2000-08-11 WO PCT/US2000/022252 patent/WO2001013142A1/en not_active Ceased
Also Published As
| Publication number | Publication date |
|---|---|
| WO2001013142A1 (en) | 2001-02-22 |
| US6661226B1 (en) | 2003-12-09 |
| WO2001013142A9 (en) | 2001-11-29 |
| DE60045007D1 (en) | 2010-11-04 |
| CA2397385A1 (en) | 2001-02-22 |
| EP1203242A1 (en) | 2002-05-08 |
| EP1203242A4 (en) | 2005-10-19 |
| CA2397385C (en) | 2008-10-07 |
Similar Documents
| Publication | Publication Date | Title |
|---|---|---|
| US6661226B1 (en) | NMR apparatus and methods for measuring volumes of hydrocarbon gas and oil | |
| US6956371B2 (en) | Method and apparatus for detecting diffusion sensitive phases with estimation of residual error in NMR logs | |
| US6242912B1 (en) | System and method for lithology-independent gas detection using multifrequency gradient NMR logging | |
| US5936405A (en) | System and method for lithology-independent gas detection using multifrequency gradient NMR logging | |
| EP1397708B1 (en) | System and method for determining oil, water and gas saturations for low-field gradient nmr logging tools | |
| US7755354B2 (en) | System and methods for T1-based logging | |
| US6825658B2 (en) | NMR logging apparatus and methods for fluid typing | |
| US6859034B2 (en) | Time-domain data integration of multiple gradient, multiple TE echo trains | |
| US6331775B1 (en) | Gas zone evaluation by combining dual wait time NMR data with density data | |
| US7176682B2 (en) | Method and apparatus for detecting hydrocarbons with NMR logs in wells drilled with oil-based muds | |
| AU731337B2 (en) | A method for determining a characteristic of a gas-bearing formation traversed by a borehole | |
| EP0852737B1 (en) | Lithology-independent gradient nmr gas detection | |
| EP0787309B1 (en) | Nmr logging of natural gas in reservoirs | |
| US20020196017A1 (en) | System and methods for nmr signal processing without phase alternated pair stacking | |
| EP0834089B1 (en) | Nmr logging of natural gas reservoirs | |
| US6867589B2 (en) | Method for detecting hydrocarbons from NMR data | |
| Hou et al. | Enhanced NMR Logging Methods for accurately measuring volumes of gas and light oil in hydrocarbon reservoirs |
Legal Events
| Date | Code | Title | Description |
|---|---|---|---|
| PUAI | Public reference made under article 153(3) epc to a published international application that has entered the european phase |
Free format text: ORIGINAL CODE: 0009012 |
|
| 17P | Request for examination filed |
Effective date: 20020228 |
|
| AK | Designated contracting states |
Kind code of ref document: A1 Designated state(s): AT BE CH CY DE DK ES FI FR GB GR IE IT LI LU MC NL PT SE |
|
| RBV | Designated contracting states (corrected) |
Designated state(s): DE FR GB |
|
| A4 | Supplementary search report drawn up and despatched |
Effective date: 20050902 |
|
| RIC1 | Information provided on ipc code assigned before grant |
Ipc: 7G 01V 3/32 B Ipc: 7G 01R 33/44 B Ipc: 7G 01V 3/00 A |
|
| 17Q | First examination report despatched |
Effective date: 20080212 |
|
| GRAP | Despatch of communication of intention to grant a patent |
Free format text: ORIGINAL CODE: EPIDOSNIGR1 |
|
| GRAS | Grant fee paid |
Free format text: ORIGINAL CODE: EPIDOSNIGR3 |
|
| GRAA | (expected) grant |
Free format text: ORIGINAL CODE: 0009210 |
|
| AK | Designated contracting states |
Kind code of ref document: B1 Designated state(s): DE FR GB |
|
| REG | Reference to a national code |
Ref country code: GB Ref legal event code: FG4D |
|
| REF | Corresponds to: |
Ref document number: 60045007 Country of ref document: DE Date of ref document: 20101104 Kind code of ref document: P |
|
| PLBE | No opposition filed within time limit |
Free format text: ORIGINAL CODE: 0009261 |
|
| STAA | Information on the status of an ep patent application or granted ep patent |
Free format text: STATUS: NO OPPOSITION FILED WITHIN TIME LIMIT |
|
| 26N | No opposition filed |
Effective date: 20110623 |
|
| REG | Reference to a national code |
Ref country code: DE Ref legal event code: R097 Ref document number: 60045007 Country of ref document: DE Effective date: 20110623 |
|
| PGFP | Annual fee paid to national office [announced via postgrant information from national office to epo] |
Ref country code: FR Payment date: 20110811 Year of fee payment: 12 Ref country code: DE Payment date: 20110831 Year of fee payment: 12 |
|
| PGFP | Annual fee paid to national office [announced via postgrant information from national office to epo] |
Ref country code: GB Payment date: 20120726 Year of fee payment: 13 |
|
| REG | Reference to a national code |
Ref country code: FR Ref legal event code: ST Effective date: 20130430 |
|
| PG25 | Lapsed in a contracting state [announced via postgrant information from national office to epo] |
Ref country code: DE Free format text: LAPSE BECAUSE OF NON-PAYMENT OF DUE FEES Effective date: 20130301 |
|
| PG25 | Lapsed in a contracting state [announced via postgrant information from national office to epo] |
Ref country code: FR Free format text: LAPSE BECAUSE OF NON-PAYMENT OF DUE FEES Effective date: 20120831 |
|
| REG | Reference to a national code |
Ref country code: DE Ref legal event code: R119 Ref document number: 60045007 Country of ref document: DE Effective date: 20130301 |
|
| GBPC | Gb: european patent ceased through non-payment of renewal fee |
Effective date: 20130811 |
|
| PG25 | Lapsed in a contracting state [announced via postgrant information from national office to epo] |
Ref country code: GB Free format text: LAPSE BECAUSE OF NON-PAYMENT OF DUE FEES Effective date: 20130811 |