EP1200360B1 - Waste water nitrification - Google Patents
Waste water nitrification Download PDFInfo
- Publication number
- EP1200360B1 EP1200360B1 EP00912768A EP00912768A EP1200360B1 EP 1200360 B1 EP1200360 B1 EP 1200360B1 EP 00912768 A EP00912768 A EP 00912768A EP 00912768 A EP00912768 A EP 00912768A EP 1200360 B1 EP1200360 B1 EP 1200360B1
- Authority
- EP
- European Patent Office
- Prior art keywords
- nitrification
- waste water
- failing
- oxygen
- effluent
- Prior art date
- Legal status (The legal status is an assumption and is not a legal conclusion. Google has not performed a legal analysis and makes no representation as to the accuracy of the status listed.)
- Expired - Lifetime
Links
- 239000002351 wastewater Substances 0.000 title claims abstract description 21
- QGZKDVFQNNGYKY-UHFFFAOYSA-N Ammonia Chemical compound N QGZKDVFQNNGYKY-UHFFFAOYSA-N 0.000 claims abstract description 61
- 229910021529 ammonia Inorganic materials 0.000 claims abstract description 24
- QVGXLLKOCUKJST-UHFFFAOYSA-N atomic oxygen Chemical compound [O] QVGXLLKOCUKJST-UHFFFAOYSA-N 0.000 claims abstract description 24
- 239000001301 oxygen Substances 0.000 claims abstract description 24
- 229910052760 oxygen Inorganic materials 0.000 claims abstract description 24
- 241000894006 Bacteria Species 0.000 claims abstract description 8
- 230000001546 nitrifying effect Effects 0.000 claims abstract description 5
- 239000000463 material Substances 0.000 claims abstract description 3
- 231100000331 toxic Toxicity 0.000 claims abstract 2
- 230000002588 toxic effect Effects 0.000 claims abstract 2
- 238000000034 method Methods 0.000 claims description 44
- 239000010802 sludge Substances 0.000 claims description 14
- 238000012544 monitoring process Methods 0.000 claims description 8
- 239000000126 substance Substances 0.000 claims description 8
- 238000004065 wastewater treatment Methods 0.000 claims description 6
- 230000003247 decreasing effect Effects 0.000 claims description 3
- GQPLMRYTRLFLPF-UHFFFAOYSA-N Nitrous Oxide Chemical compound [O-][N+]#N GQPLMRYTRLFLPF-UHFFFAOYSA-N 0.000 abstract description 82
- IOVCWXUNBOPUCH-UHFFFAOYSA-M Nitrite anion Chemical compound [O-]N=O IOVCWXUNBOPUCH-UHFFFAOYSA-M 0.000 abstract description 18
- 239000007789 gas Substances 0.000 abstract description 18
- IJGRMHOSHXDMSA-UHFFFAOYSA-N nitrogen Substances N#N IJGRMHOSHXDMSA-UHFFFAOYSA-N 0.000 abstract description 14
- NHNBFGGVMKEFGY-UHFFFAOYSA-N Nitrate Chemical compound [O-][N+]([O-])=O NHNBFGGVMKEFGY-UHFFFAOYSA-N 0.000 abstract description 13
- 229910002651 NO3 Inorganic materials 0.000 abstract description 12
- 229910052757 nitrogen Inorganic materials 0.000 abstract description 12
- 229960001730 nitrous oxide Drugs 0.000 abstract description 7
- 239000012530 fluid Substances 0.000 abstract description 4
- 230000008569 process Effects 0.000 description 27
- 238000005273 aeration Methods 0.000 description 22
- 230000035939 shock Effects 0.000 description 22
- 238000011068 loading method Methods 0.000 description 12
- 239000010865 sewage Substances 0.000 description 9
- 238000001514 detection method Methods 0.000 description 8
- 230000005764 inhibitory process Effects 0.000 description 8
- MWUXSHHQAYIFBG-UHFFFAOYSA-N Nitric oxide Chemical compound O=[N] MWUXSHHQAYIFBG-UHFFFAOYSA-N 0.000 description 7
- 238000004519 manufacturing process Methods 0.000 description 7
- 239000007787 solid Substances 0.000 description 7
- 230000000694 effects Effects 0.000 description 6
- 238000005259 measurement Methods 0.000 description 6
- 238000012360 testing method Methods 0.000 description 6
- HTKFORQRBXIQHD-UHFFFAOYSA-N allylthiourea Chemical compound NC(=S)NCC=C HTKFORQRBXIQHD-UHFFFAOYSA-N 0.000 description 5
- 229960001748 allylthiourea Drugs 0.000 description 5
- 239000008346 aqueous phase Substances 0.000 description 5
- 230000014759 maintenance of location Effects 0.000 description 5
- 239000005416 organic matter Substances 0.000 description 5
- 230000003647 oxidation Effects 0.000 description 5
- 238000007254 oxidation reaction Methods 0.000 description 5
- 238000004458 analytical method Methods 0.000 description 4
- 238000002474 experimental method Methods 0.000 description 4
- 239000001272 nitrous oxide Substances 0.000 description 4
- 230000009467 reduction Effects 0.000 description 4
- 239000003440 toxic substance Substances 0.000 description 4
- 241000605159 Nitrobacter Species 0.000 description 3
- IOVCWXUNBOPUCH-UHFFFAOYSA-N Nitrous acid Chemical compound ON=O IOVCWXUNBOPUCH-UHFFFAOYSA-N 0.000 description 3
- 238000006243 chemical reaction Methods 0.000 description 3
- 239000010842 industrial wastewater Substances 0.000 description 3
- 231100000167 toxic agent Toxicity 0.000 description 3
- 231100000419 toxicity Toxicity 0.000 description 3
- 230000001988 toxicity Effects 0.000 description 3
- AVXURJPOCDRRFD-UHFFFAOYSA-N Hydroxylamine Chemical compound ON AVXURJPOCDRRFD-UHFFFAOYSA-N 0.000 description 2
- 229910017912 NH2OH Inorganic materials 0.000 description 2
- GRYLNZFGIOXLOG-UHFFFAOYSA-N Nitric acid Chemical compound O[N+]([O-])=O GRYLNZFGIOXLOG-UHFFFAOYSA-N 0.000 description 2
- 241000605122 Nitrosomonas Species 0.000 description 2
- 239000010840 domestic wastewater Substances 0.000 description 2
- 238000004868 gas analysis Methods 0.000 description 2
- 239000007792 gaseous phase Substances 0.000 description 2
- 238000011835 investigation Methods 0.000 description 2
- 239000010841 municipal wastewater Substances 0.000 description 2
- 239000003053 toxin Substances 0.000 description 2
- 231100000765 toxin Toxicity 0.000 description 2
- 108700012359 toxins Proteins 0.000 description 2
- XLYOFNOQVPJJNP-UHFFFAOYSA-N water Substances O XLYOFNOQVPJJNP-UHFFFAOYSA-N 0.000 description 2
- 238000007704 wet chemistry method Methods 0.000 description 2
- 108010061397 Ammonia monooxygenase Proteins 0.000 description 1
- QGZKDVFQNNGYKY-UHFFFAOYSA-O Ammonium Chemical compound [NH4+] QGZKDVFQNNGYKY-UHFFFAOYSA-O 0.000 description 1
- 239000002028 Biomass Substances 0.000 description 1
- CXRFDZFCGOPDTD-UHFFFAOYSA-M Cetrimide Chemical compound [Br-].CCCCCCCCCCCCCC[N+](C)(C)C CXRFDZFCGOPDTD-UHFFFAOYSA-M 0.000 description 1
- 101710171638 Chanoclavine-I dehydrogenase easD Proteins 0.000 description 1
- 229920000742 Cotton Polymers 0.000 description 1
- 108010086710 Hydroxylamine dehydrogenase Proteins 0.000 description 1
- ODUCDPQEXGNKDN-UHFFFAOYSA-N Nitrogen oxide(NO) Natural products O=N ODUCDPQEXGNKDN-UHFFFAOYSA-N 0.000 description 1
- 230000015572 biosynthetic process Effects 0.000 description 1
- 230000008859 change Effects 0.000 description 1
- 238000012937 correction Methods 0.000 description 1
- 230000001419 dependent effect Effects 0.000 description 1
- 230000001627 detrimental effect Effects 0.000 description 1
- 238000005516 engineering process Methods 0.000 description 1
- 239000003344 environmental pollutant Substances 0.000 description 1
- 230000008020 evaporation Effects 0.000 description 1
- 238000001704 evaporation Methods 0.000 description 1
- 229910001385 heavy metal Inorganic materials 0.000 description 1
- 239000003295 industrial effluent Substances 0.000 description 1
- 239000003112 inhibitor Substances 0.000 description 1
- 238000009434 installation Methods 0.000 description 1
- 238000009413 insulation Methods 0.000 description 1
- 239000007788 liquid Substances 0.000 description 1
- 230000000813 microbial effect Effects 0.000 description 1
- 244000005700 microbiome Species 0.000 description 1
- 239000000203 mixture Substances 0.000 description 1
- 229910000069 nitrogen hydride Inorganic materials 0.000 description 1
- 238000011017 operating method Methods 0.000 description 1
- 150000002894 organic compounds Chemical class 0.000 description 1
- 239000011368 organic material Substances 0.000 description 1
- 239000002245 particle Substances 0.000 description 1
- 231100000614 poison Toxicity 0.000 description 1
- 235000013824 polyphenols Nutrition 0.000 description 1
- 238000012163 sequencing technique Methods 0.000 description 1
- 150000004763 sulfides Chemical class 0.000 description 1
- 239000002699 waste material Substances 0.000 description 1
Images




Classifications
-
- C—CHEMISTRY; METALLURGY
- C02—TREATMENT OF WATER, WASTE WATER, SEWAGE, OR SLUDGE
- C02F—TREATMENT OF WATER, WASTE WATER, SEWAGE, OR SLUDGE
- C02F3/00—Biological treatment of water, waste water, or sewage
- C02F3/006—Regulation methods for biological treatment
-
- C—CHEMISTRY; METALLURGY
- C02—TREATMENT OF WATER, WASTE WATER, SEWAGE, OR SLUDGE
- C02F—TREATMENT OF WATER, WASTE WATER, SEWAGE, OR SLUDGE
- C02F2209/00—Controlling or monitoring parameters in water treatment
- C02F2209/38—Gas flow rate
Definitions
- This invention relates to a waste water nitrification method, and concerns in particular the control of such a method.
- Nitrification is the biological oxidation of ammonia (NH 3 ) to nitrate (NO 3 - ) via nitrite (NO 2 - ).
- Two bacteria genera are responsible for nitrification; Nitrosomonas oxidises ammonia to nitrite and Nitrobacter , oxidises this to nitrate.
- Nitrosomonas oxidise ammonia to nitrite as follows:- Oxidation of ammonia to nitrite Step Reaction 1 NH 3 + O 2 +2H + + 2e - ⁇ NH 2 OH + H 2 O Ammonia mono-oxygenase 2 NH 2 OH + H 2 O ⁇ HONO + 4H + + 4e - Hydroxyl amine oxidoreductase 3 0.5O 2 + 2H + + 2e - ⁇ H 2 O Total NH 3 + 1. 5O 2 ⁇ NO 2 - + H + + H 2 O
- the Nitrobacter oxidise nitrite to nitrate as follows:- oxidation of nitrite to nitrate Step Reaction 1 HONO + H 2 O ⁇ HONO 2 + 2H + + 2e - Nitrite oxidoreductase 2 0.5O 2 + 2H + + 2e - ⁇ H 2 O Total HONO + 0.5O 2 ⁇ HONO 2
- Nitrification is a sensitive process, the stability of which is dependent upon numerous operating conditions; especially pH, organic matter, ammonia content, dissolved oxygen and the absence of toxins.
- the oxidation of a kg of ammonia to nitrate requires approximately 4.3 kg of oxygen.
- the nitrification process has a much greater oxygen requirement than the oxidation of organic matter in waste water, with the stability of the former process particularly effected by the oxygen supply rate and dissolved oxygen (DO) concentration.
- DO dissolved oxygen
- Monitoring of the nitrification during wastewater treatment is mainly done by spot analysis of effluent ammonia, nitrite and nitrate by wet chemistry methods. This method of monitoring is time consuming, resource demanding and does not provide any pre-warning of a nitrification failure. More recently, biological nitrification toxicity monitors have been installed in side streams at some wastewater treatment plants. Though expensive to install, time consuming and costly to operate this method at least provides online monitoring.
- NO and N 2 O are formed via the reduction of NO 2 - when the nitrification process is oxygen stressed and operating under oxic conditions. Under such conditions NO 2 - is used by ammonium oxidisers as the terminal electron acceptor instead of oxygen and N 2 O formed rather than NO 3 - . Therefore, any change in influent or operating procedures that results in oxic conditions and an increase in NO 2 - can be determined by monitoring gaseous N 2 O.
- N 2 O production during nitrification is strongly linked to nitrification inhibition.
- the invention exploits this relationship; gaseous N 2 O concentration is determined using a N 2 O gas analyser and used to assess the stability of the nitrification process.
- concentration of gaseous N 2 O formed during nitrification is directly related to the build-up of NO 2 - in the aqueous phase during oxic conditions.
- the failure of the nitrification caused by the presence of toxic substances is also detected by the increased N 2 O production.
- the rate at which gaseous N 2 O increases is directly related to the degree of. nitrification inhibition.
- the advantages of this invention are considerable; non-invasive online monitoring of the nitrification process in all types of biological treatment processes can be undertaken without the need for regular spot samples, wet chemistry analysis or expensive toxicity monitors.
- N 2 O The increase in N 2 O indicates that the nitrification is failing, whatever the cause of the inhibition of the nitrification.
- An increase in ammonia concentration, a decrease in oxygen supply (however caused) and the presence of a toxin affecting the nitrifying bacteria will each result in an increase in N 2 O production.
- nitrification failure Upon detection of nitrification failure by N 2 O detection in a commercial installation a number of different actions can be taken to ensure correction of the failure.
- the rate of air flow into the aeration basin can be increased to raise the DO level.
- the influent rate could be reduced or stopped altogether.
- the rate of return of the activated sludge could be increased.
- Further material could be added to the aeration basin or the effluent to counter the presence of any toxic compound.
- the effluent could be passed to a further treatment stage or it could be passed to a storage tank for returning to the nitrification works as influent. Any or all of these actions can be taken in real time, in order to correct the inhibition of the nitrification.
- the fluid treatment plant 1 of Figure 1 is for the biological treatment of domestic or industrial waste water.
- the nitrification takes place in the aeration basin 2. If the waste water contains organic matter that also requires biological treatment using micro-organisms different from those carrying out the nitrification then this can also be carried out in the same basin 2. Alternatively the treatment of the organic matter and the nitrification can occur in series, in separate basins.
- the waste water in the form of settled sewage arrives at a tank 3. From this tank 3 influent can be pumped at a controlled rate into the aeration basin 2 which contains the two different nitrifying bacteria, Ni trosomonas and Nitrobacter. Air from a compressor 4 is fed to the basin 2 to provide oxygen. The bacteria break down the ammoniacal-nitrogen present to nitrate via nitrate and the treated sewage in the form of sludge is principally passed to a settling column 5 whereby the sludge which contains substantial amounts of bacteria (and therefore called "activated sludge") is separated from the remainder which is discharged as effluent. The activated sludge is pumped through a return pipe 6 to the aeration basin 2. The basin 2 also has the facility to divert waste sludge to a tank 7 for passing directly to a drain.
- a hood 10 placed above the aeration basin 2 of the nitrification wastewater treatment unit 1 collects the gaseous products formed.
- the gas produced is then transferred via a pipe 11 to an N 2 O analyser 12 for gaseous N 2 O concentration determination.
- a suitable analyser would be the Horiba VIA-510 Gas Analysis Unit. The following Examples show how the production of N 2 O varies according to variation in operating conditions.
- a nitrifying microbial population with a biomass concentration of 1 ( ⁇ 0.05) mg TSS (total suspended solids) l -1 were cultured in a 7 litre activated sludge process maintained at a pH of 7.2 and a temperature of 25°C.
- the hydraulic retention time was 7 days and the solid retention time was 23 days.
- the process was fed ammonia as the only energy source; at a steady state the nitrogen loading was 244 ( ⁇ 15) mg NH 3 -N g TSS -1 d -1 .
- NH 3 -N refers to nitrogen in the form of ammonia.
- the activated sludge plant was shock loaded by adding.
- Example 1 The process was subjected to ammonia shock loads over a range of concentrations and the production rate of N 2 O from the activated sludge determined ( Figure 4). The rate of N 2 O production was directly related to the size of the shock load at concentrations less than 1.6 NH 3 -N g TSS l -1 . It can therefore be clearly seen from Examples 1 and 2 that a sudden. increase in the ammonia content of the influent produces an immediate and corresponding increase in N 2 O formed.
- Example 2 The same process as described in Example 1 was operated under the same conditions in this Example. However, in this Example the aeration rate was reduced from 3.7 l min -1 to 0.3 l min -1 which resulted in a decrease in the dissolved oxygen (DO) level from 4.5 mg l -1 to ⁇ 2 mg l -1 .
- DO dissolved oxygen
- the resultant increase in N 2 O concentration in the gaseous phase was closely related to the build-up of NO 2 - in the aqueous phase, as shown in Figure 5.
- Each basin 2 was initially filled with 150 l wastewater and 150 l activated sludge taken from the return activated sludge (RAS) channel of a municipal wastewater treatment works (Cotton Valley Wastewater Treatment Works, Yalen Water). Cranfield University Wastewater Treatment Works wastewater (mean COD 391 ⁇ 40 mg/l, mean NH, 44.3 ⁇ 7.5 mg/l) was supplied at 50 l/h, thus maintaining the hydraulic retention time (HRT) at 8 hours.
- the hydraulic retention time is the length of time that the waste water remains in the aeration basin 1.
- the aeration basins and settling columns were covered to minimise liquid loss by evaporation. Frost protection and insulation were provided to the aeration basins, and the settling columns insulated.
- the dissolved oxygen (DO) was maintained at 4.0 ⁇ 1.7 mg/l and the influent pH remained within 7.31-7.60 without pH control. Solids were brushed off the basin walls daily, and sludge wasted from the aeration basins at a rate to maintain a mean cell retention time (MCRT) of 12 d.
- Measurements of the,influent and effluent chemical oxygen demand (COD), NH 3 and suspended solids (SS) concentrations were made three times per week; mixed liquor suspended solids (MLSS) was also measured.
- the N 2 O was sampled and analysed using an Horiba VIA-510 Gas Analysis Unit.
- This unit accurately measures the concentrations of specific components in gas mixtures using non-dispersive infrared analysis for spot or continuous measurement of components in sample gases. Particles consisting of different atoms absorb infrared in their specific wavelength bands, and gases at constant pressure absorb infrared corresponding to their concentration.
- the VIA-510 measures infrared light of a specified wavelength passing through a cell of sample gas held under constant conditions. Changes to the quantity of N 2 O cause changes to the quantity of light passing through the sample cell, from which gas concentrations are calculated.
- the gas analyser working range was 0-200 ppm, measured to one decimal place ( ⁇ 1.0 ppm) when calibrated with compressed air (zero gas) and 160 ppm N 2 O (with N 2 balance, certified 99.99% accurate).
- the limit of detection was 0.1 ppm.
- Example 4 one of the pilot plant lanes was shock loaded by adding 2.44g NH 3 -N (dosed as 7.25g NH 3 Cl dissolved in 1000ml H 2 O) directly into the aeration tank, a dose calculated to exert an instantaneous oxygen demand of 3.5 mg.l -1 on the 3001 aeration tank. Influent ammonia in the sewage feed was 36.4 mg.l -1 prior to shock loading. The air supply was kept constant. during the experiment and the starting DO was 2.2 mg.l -1 . Mixed liquor DO (MLDO) and N 2 O in the headspace were logged every 15 min, and the effluent was sampled for ammonia, nitrite and nitrate determination. The experiment proceeded for 12 hours.
- MLDO Mixed liquor DO
- N 2 O in the headspace were logged every 15 min, and the effluent was sampled for ammonia, nitrite and nitrate determination. The experiment proceeded for 12 hours.
- Example 5 employed the same ammonia load, dissolved in sewage feed and pumped into the second pilot plant lane over a period of approximately 15 minutes. The experiment continued in exactly the same way as before.
- the starting DO was 2.4 mg.l -1 and the ammonia in the sewage feed was 36.0 mg.l -1 .
- Mixed liquor DO and N 2 O in the headspace were logged every 5 minutes for the first 2 hours and every 15 minutes thereafter, and the effluent was sampled for analysis at 15 minute intervals for the next 10 hours.
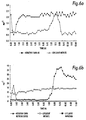
- Example 4 a minimum for the DO and maximum N 2 O was reached approximately 30 minutes after the shock load, after which DO increased and N 2 O decreased. Both DO and N 2 O had recovered after approximately 105 minutes. Effluent NO 2 -N ( Figure 6a) and NH 3 -N ( Figure 6b) remained stable at 0.7 ⁇ 0.1 and 1.5 ⁇ 1.4 mg.l -1 respectively, until 7 hours after the shock load was applied. NO 2 -N had recovered after a further 2.5 hours whereas NH 3 -N values remained high for the remainder of the test. An effluent sample taken 24 hours after shock loading contained 1.8 mg.l -1 NH 3 -N, indicating that the system had recovered.
- Ammonia loading in Example 5 produced a broader peak of N 2 O between 15 and 35 minutes after the dose was applied.
- the trough in mixed liquor dissolved oxygen (MLDO) was also broader, occurring between 30 and 75 minutes after dosing.
- Effluent NO 2 -N ( Figure 7a) and NH 3 -N ( Figure 7b) increased 7 hours and 30 minutes after the shock load was applied. NO 2 -N had recovered after a further hour whereas NH 3 -N values remained high for the remainder of the test.
- An effluent sample taken 15 hours after shock loading contained 2.1 mg.l -1 NH 3 -N, indicating that the system had recovered.
- the observed peak in exhaust gas N 2 O preceded the appearance of ammonia and nitrite in the plant effluent by approximately 6 hours and fifteen minutes (i.e. 0.78 x HRT) .
- Example 6 During Examples 6 and 7, aeration was reduced to maintain DO concentrations of ⁇ 1.0 mg.l -1 for 1 hour.
- the air regulators available read from 0 to 10 bar and therefore did not give a reliable pressure reading at the low flows required, hence air flow rate measurements were not available.
- Air flow was altered to achieve target mixed liquor dissolved oxygen (MLDO) values rather than specified air flow rates.
- a submersible pump was placed in the aeration tank to maintain mixing of the mixed liquor suspended solids (MLSS) while the air supply was reduced. Headspace N 2 O, MLDO and effluent NO 3 ,-N, NO 2 -N and NH 3 -N were measured as in Example 5.
- the initial MLDO reading was 2.4 mg.l -1 and feed NH 3 -N was 44.6 mg.l -1 in Example 6, and 2.9 mg. l -1 and 40.1 mg.l -1 respectively in Example 7.
- Example 6 An effluent sample taken 12 hours after Example 6 contained 3.7 mg.l -1 NH 3 -N, and 8.7 mg.l -1 12 hours after Example 7, indicating that the system had not completely recovered, but this was partly attributed to ambient temperatures of 5 - 8 °C.
- Example 8 was a chemical shock applied to one of the activated sludge systems.
- a dose of allylthiourea (ATU) was mixed with sewage and pumped in as feed over a 15 minute period.
- the total ATU load was 22.8 mg, a dose calculated to give 75% inhibition in the aeration basin.
- a concentration of 0.076 mg.l -1 produces 75% inhibition.
- influent NH,-N concentration was 38.1
- mg.l -1 and MLDO was 2.2 mg.l -1 .
- the aeration rate was kept constant throughout the 12 hour test, and MLDO, headspace N 2 O and effluent NO 3 -N, NO 2 -N and NH,-N were measured as in Examples 5 to 7.
- Example 8 the MLDO and N 2 O increased when the ATU dose was applied to the aeration tank.
- Maximum mixed liquor dissolved oxygen (MLDO) was reached approximately 180 minutes after the shock load, N 2 O after approximately 135 minutes. Both DO and N 2 O recovered after approximately 10 hours.
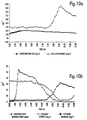
- Effluent NO 2 -N ( Figure 10a) and NH 3 -N ( Figure 10b) remained stable at 3.8 ⁇ 0.1 mg.l -1 and 2.5 ⁇ 0.3 mg.l -1 respectively until 7 hours after the shock load was applied.
- Toxicity can be caused by other substances including heavy metals, organic compounds with C-S and C-N linkages, phenolics and sulphides.
- Example Type Initial N 2 O Peak N 2 O (ppm) Time to N 2 O peak (HRT) Time to effluent N 2 O (HRT) Time to increased effluent NH3 (HRT) Time from N 2 O increase to effluent NO 2 (HRT) 4 NH 3 0.1 17.5 0.0625 0.9 0.9 0.9 5 NH 3 0.1 14.2 0.0313 0.938 0.938 0.78 6 MLDO 0.1 22.3 0.125 0.938 0.938 0.805 7 MLDO 0.1 28.1 0.135 0.938 0.938 0.805 8 ATU 0.1 54.5 0.155 0.875 0.875 0.75 0.75
- N 2 O detection provides early warning of nitrification failure, regardless of the cause of the failure.
- the time lag between detection of increased offgas N 2 O and the appearance of nitrite in the effluent ranged from 0.75 to 0.90 HRT.
- the mean time taken from N 2 O increase to appearance of nitrite was. 0.808 HRT, providing a 6.5 hour warning of nitrification failure, indicating that N 2 O detection is a superior indicator of nitrification failure.
Landscapes
- Life Sciences & Earth Sciences (AREA)
- Engineering & Computer Science (AREA)
- Water Supply & Treatment (AREA)
- Biodiversity & Conservation Biology (AREA)
- Microbiology (AREA)
- Hydrology & Water Resources (AREA)
- Health & Medical Sciences (AREA)
- Environmental & Geological Engineering (AREA)
- Molecular Biology (AREA)
- Chemical & Material Sciences (AREA)
- Organic Chemistry (AREA)
- Purification Treatments By Anaerobic Or Anaerobic And Aerobic Bacteria Or Animals (AREA)
- Activated Sludge Processes (AREA)
- Micro-Organisms Or Cultivation Processes Thereof (AREA)
- Control Of Motors That Do Not Use Commutators (AREA)
Abstract
Description
| Oxidation of ammonia to | |
| Step | Reaction |
| 1 | NH3 + O2 +2H+ + 2e- → NH2OH + H2O |
| Ammonia mono- | |
| 2 | NH2OH + H2O → HONO + 4H+ + 4e- |
| | |
| 3 | 0.5O2 + 2H+ + 2e-→ H2O |
| Total | NH3 + 1. 5O2 → NO2 - + H+ + H2O |
| oxidation of nitrite to | |
| Step | Reaction |
| 1 | HONO + H2O → HONO2 + 2H+ + 2e- |
| Nitrite oxidoreductase | |
| 2 | 0.5O2 + 2H+ + 2e- → H2O |
| Total | HONO + 0.5O2 → HONO2 |
| Reduction of nitrite to dinitrogen | |
| Step | Reaction |
| 1 | NO2 - + e- +2H+ → NO + H2O |
| 2 | NO + e- + H+→ ½N2O + ½ H2O |
| Total | NO2 - + 2e- + 3H+→ ½ N2O + 1½ H2O |
| Experimental conditions | ||||
| Example | Type | Initial MLDO (mg.l-1) | Influent NH3 (mg.l-1) | Initial effluent NH3 (mg.l-1) |
| 4 | NH3 shock NH, shock | 2.2 | 36.4 | 1.7 |
| (instantaneous) | ||||
| 5 | NH3 shock | 2.4 | 36.0 | 1.2 |
| (15 min duration) | ||||
| 6 | MLDO depletion | 2.4 | 44.6 | 1.2 |
| 7 | MLDO depletion | 2.9 | 40.1 | 1.9 |
| 8 | Chemical inhibition | 2.2 | 38.1 | 2.3 |
| Results summary. | |||||||
| Example | Type | Initial N2O (ppm) | Peak N2O (ppm) | Time to N2O peak (HRT) | Time to effluent N2O (HRT) | Time to increased effluent NH3 (HRT) | Time from N2O increase to effluent NO2 (HRT) |
| 4 | NH3 | 0.1 | 17.5 | 0.0625 | 0.9 | 0.9 | 0.9 |
| 5 | NH3 | 0.1 | 14.2 | 0.0313 | 0.938 | 0.938 | 0.78 |
| 6 | MLDO | 0.1 | 22.3 | 0.125 | 0.938 | 0.938 | 0.805 |
| 7 | MLDO | 0.1 | 28.1 | 0.135 | 0.938 | 0.938 | 0.805 |
| 8 | ATU | 0.1 | 54.5 | 0.155 | 0.875 | 0.875 | 0.75 |
Claims (11)
- A method of monitoring for failing of nitrification of waste water in a waste water treatment plant, comprising measuring N2O produced, the measured N2O concentration increasing following said failing of said nitrification.
- A method according to claim 1, wherein said failing is caused by increasing ammonia concentration in said waste water.
- A method according to claim 1 or 2, wherein oxygen is supplied to said waste water and said failing is caused by decreasing supply of oxygen to said waste water.
- A method according to claim 1, 2 or 3, wherein said failing is caused by a substance which is toxic to nitrifying bacteria present in said waste water.
- A method according to any preceding claim, wherein action is taken in response to the increase in the N2O concentration.
- A method according to claim 5wherein said action comprises increasing rate of O2 addition.
- A method according to claim 5 or 7, wherein said action comprises reducing or stopping the inflow of waste water to the nitrification.
- A method according to claim 5, 6, or 7, wherein said action comprises increasing rate of return of activated sludge.
- A method according to any one of claims 5 to 8, wherein said action comprises diverting said waste water to a storage tank.
- A method according to any one of claims 5 to 8, wherein said action comprises passing said waste water to a further treatment stage.
- A method according to claim 4, or any one of claims 5 to 10 as appended to claim 4, wherein further material is added to said waste water to counter the presence of said substance.
Applications Claiming Priority (3)
| Application Number | Priority Date | Filing Date | Title |
|---|---|---|---|
| GBGB9907210.0A GB9907210D0 (en) | 1999-03-30 | 1999-03-30 | Nitrification monitor |
| GB9907210 | 1999-03-30 | ||
| PCT/GB2000/001094 WO2000058227A1 (en) | 1999-03-30 | 2000-03-30 | Waste water nitrification |
Publications (2)
| Publication Number | Publication Date |
|---|---|
| EP1200360A1 EP1200360A1 (en) | 2002-05-02 |
| EP1200360B1 true EP1200360B1 (en) | 2004-12-22 |
Family
ID=10850580
Family Applications (1)
| Application Number | Title | Priority Date | Filing Date |
|---|---|---|---|
| EP00912768A Expired - Lifetime EP1200360B1 (en) | 1999-03-30 | 2000-03-30 | Waste water nitrification |
Country Status (5)
| Country | Link |
|---|---|
| EP (1) | EP1200360B1 (en) |
| AT (1) | ATE285384T1 (en) |
| DE (1) | DE60016931T2 (en) |
| GB (1) | GB9907210D0 (en) |
| WO (1) | WO2000058227A1 (en) |
Families Citing this family (3)
| Publication number | Priority date | Publication date | Assignee | Title |
|---|---|---|---|---|
| FR2954306B1 (en) * | 2009-12-18 | 2014-03-21 | Degremont | PROCESS FOR TREATING WASTE WATER TO CONTROL NITROGEN PROTOXIDE (N2O) FORMATION DURING TREATMENT |
| ES2579992B1 (en) * | 2015-02-16 | 2017-09-19 | Acciona Agua, S.A. | AIR CONTROL IN TREATMENT OF WASTEWATER THROUGH MONITORING OF NITRIFICATION SUBPRODUCTS |
| CN110316811A (en) * | 2019-06-14 | 2019-10-11 | 盐城恒清河湖整治有限公司 | A kind of municipal sewage treatment tower biological filter |
Family Cites Families (2)
| Publication number | Priority date | Publication date | Assignee | Title |
|---|---|---|---|---|
| DE3724027A1 (en) * | 1987-07-21 | 1989-02-02 | Bock Eberhard | METHOD FOR NITRIFICATION, A MICROORGANISM SUITABLE FOR THIS, AND THE PLASMID DNA CONTAINED IN THE MICROORGANISM |
| DE3818777C1 (en) * | 1988-06-02 | 1989-07-13 | Eberhard Prof. Dr. 2000 Hamburg De Bock | Method for the non-destructive removal of salts from rocks, and device for implementing the method |
-
1999
- 1999-03-30 GB GBGB9907210.0A patent/GB9907210D0/en not_active Ceased
-
2000
- 2000-03-30 WO PCT/GB2000/001094 patent/WO2000058227A1/en not_active Ceased
- 2000-03-30 DE DE60016931T patent/DE60016931T2/en not_active Expired - Lifetime
- 2000-03-30 EP EP00912768A patent/EP1200360B1/en not_active Expired - Lifetime
- 2000-03-30 AT AT00912768T patent/ATE285384T1/en not_active IP Right Cessation
Also Published As
| Publication number | Publication date |
|---|---|
| DE60016931T2 (en) | 2005-12-15 |
| GB9907210D0 (en) | 1999-05-26 |
| EP1200360A1 (en) | 2002-05-02 |
| ATE285384T1 (en) | 2005-01-15 |
| DE60016931D1 (en) | 2005-01-27 |
| WO2000058227A1 (en) | 2000-10-05 |
Similar Documents
| Publication | Publication Date | Title |
|---|---|---|
| She et al. | Partial nitrification and denitrification in a sequencing batch reactor treating high-salinity wastewater | |
| Randall et al. | Nitrite build-up in activated sludge resulting from temperature effects | |
| Bernet et al. | Nitrification at low oxygen concentration in biofilm reactor | |
| KR910001617B1 (en) | Activated sludge wastewater treating process | |
| CN101258108B (en) | Method and arrangement for processing nitrogen-concentrated effluents in a sequential fractionated cycle biological reactor | |
| EP0417098B1 (en) | Method of sewage treatment | |
| US5288406A (en) | Process for biologically purifying waste waters | |
| Baetens et al. | Temperature effects in bio-P removal | |
| Burgess et al. | Dinitrogen oxide detection for process failure early warning systems | |
| Gomez et al. | Kinetic study of addition of volatile organic compounds to a nitrifying sludge | |
| Hardy et al. | Simultaneous activated sludge wastewater treatment and odour control | |
| Villaverde et al. | New operational strategy for SBR technology for total nitrogen removal from industrial wastewaters highly loaded with nitrogen | |
| Aktan et al. | A new approach for treating ammonia-rich wastewater deficient in organic matter: A tandem process for nitrification/nitritation in MBBR followed by sulfur-based denitrifying column reactor | |
| Delanghe et al. | Biological denitrification with ethanol in a membrane bioreactor | |
| EP1200360A1 (en) | Waste water nitrification | |
| KR102665116B1 (en) | Method for treating reject water of wastewater treatment | |
| Sagir-Kurt | A pilot-scale study on the partial nitritation-anammox process for treatment of anaerobic sludge digester effluent | |
| AU2016221583A1 (en) | Aeration control in waste water treatment by monitoring nitrification by-products | |
| Villaverde et al. | Nitrification-denitrification of UASB effluents highly loaded with nitrogen in an activated sludge reactor operated with short cycled aeration | |
| Li et al. | The application of ORP in activated sludge wastewater treatment processes | |
| Gut et al. | Partial nitritation process assessment | |
| Sadowski et al. | Comparison of aeration strategies for optimization of nitrogen removal in an A/B process: DO, ABAC, and AvN control | |
| Guo et al. | Concentration-dependent effects of NH2OH on partial nitrification performance: Microbial structure evolution and process recovery | |
| Holtmann et al. | Detection of the microbial activity of aerobic heterotrophic, anoxic heterotrophic and aerobic autotrophic activated sludge organisms with an electrochemical sensor | |
| Zabranska | Inhibition of Biological Denitrifi cation by Nitric Oxide, Its Early Detection and Prevention of Negative Impact on the Denitrifi cation of Industrial Wastewater |
Legal Events
| Date | Code | Title | Description |
|---|---|---|---|
| PUAI | Public reference made under article 153(3) epc to a published international application that has entered the european phase |
Free format text: ORIGINAL CODE: 0009012 |
|
| 17P | Request for examination filed |
Effective date: 20010926 |
|
| AK | Designated contracting states |
Kind code of ref document: A1 Designated state(s): AT BE CH CY DE DK ES FI FR GB GR IE IT LI LU MC NL PT SE |
|
| GRAP | Despatch of communication of intention to grant a patent |
Free format text: ORIGINAL CODE: EPIDOSNIGR1 |
|
| GRAS | Grant fee paid |
Free format text: ORIGINAL CODE: EPIDOSNIGR3 |
|
| GRAA | (expected) grant |
Free format text: ORIGINAL CODE: 0009210 |
|
| AK | Designated contracting states |
Kind code of ref document: B1 Designated state(s): AT BE CH CY DE DK ES FI FR GB GR IE IT LI LU MC NL PT SE |
|
| PG25 | Lapsed in a contracting state [announced via postgrant information from national office to epo] |
Ref country code: IT Free format text: LAPSE BECAUSE OF FAILURE TO SUBMIT A TRANSLATION OF THE DESCRIPTION OR TO PAY THE FEE WITHIN THE PRESCRIBED TIME-LIMIT;WARNING: LAPSES OF ITALIAN PATENTS WITH EFFECTIVE DATE BEFORE 2007 MAY HAVE OCCURRED AT ANY TIME BEFORE 2007. THE CORRECT EFFECTIVE DATE MAY BE DIFFERENT FROM THE ONE RECORDED. Effective date: 20041222 Ref country code: LI Free format text: LAPSE BECAUSE OF FAILURE TO SUBMIT A TRANSLATION OF THE DESCRIPTION OR TO PAY THE FEE WITHIN THE PRESCRIBED TIME-LIMIT Effective date: 20041222 Ref country code: AT Free format text: LAPSE BECAUSE OF FAILURE TO SUBMIT A TRANSLATION OF THE DESCRIPTION OR TO PAY THE FEE WITHIN THE PRESCRIBED TIME-LIMIT Effective date: 20041222 Ref country code: CH Free format text: LAPSE BECAUSE OF FAILURE TO SUBMIT A TRANSLATION OF THE DESCRIPTION OR TO PAY THE FEE WITHIN THE PRESCRIBED TIME-LIMIT Effective date: 20041222 Ref country code: FI Free format text: LAPSE BECAUSE OF FAILURE TO SUBMIT A TRANSLATION OF THE DESCRIPTION OR TO PAY THE FEE WITHIN THE PRESCRIBED TIME-LIMIT Effective date: 20041222 |
|
| REG | Reference to a national code |
Ref country code: GB Ref legal event code: FG4D |
|
| REG | Reference to a national code |
Ref country code: CH Ref legal event code: EP |
|
| REG | Reference to a national code |
Ref country code: IE Ref legal event code: FG4D |
|
| REF | Corresponds to: |
Ref document number: 60016931 Country of ref document: DE Date of ref document: 20050127 Kind code of ref document: P |
|
| PG25 | Lapsed in a contracting state [announced via postgrant information from national office to epo] |
Ref country code: DK Free format text: LAPSE BECAUSE OF FAILURE TO SUBMIT A TRANSLATION OF THE DESCRIPTION OR TO PAY THE FEE WITHIN THE PRESCRIBED TIME-LIMIT Effective date: 20050322 Ref country code: GR Free format text: LAPSE BECAUSE OF FAILURE TO SUBMIT A TRANSLATION OF THE DESCRIPTION OR TO PAY THE FEE WITHIN THE PRESCRIBED TIME-LIMIT Effective date: 20050322 Ref country code: SE Free format text: LAPSE BECAUSE OF FAILURE TO SUBMIT A TRANSLATION OF THE DESCRIPTION OR TO PAY THE FEE WITHIN THE PRESCRIBED TIME-LIMIT Effective date: 20050322 |
|
| PG25 | Lapsed in a contracting state [announced via postgrant information from national office to epo] |
Ref country code: IE Free format text: LAPSE BECAUSE OF NON-PAYMENT OF DUE FEES Effective date: 20050330 Ref country code: CY Free format text: LAPSE BECAUSE OF FAILURE TO SUBMIT A TRANSLATION OF THE DESCRIPTION OR TO PAY THE FEE WITHIN THE PRESCRIBED TIME-LIMIT Effective date: 20050330 Ref country code: LU Free format text: LAPSE BECAUSE OF NON-PAYMENT OF DUE FEES Effective date: 20050330 |
|
| PG25 | Lapsed in a contracting state [announced via postgrant information from national office to epo] |
Ref country code: MC Free format text: LAPSE BECAUSE OF NON-PAYMENT OF DUE FEES Effective date: 20050331 |
|
| PG25 | Lapsed in a contracting state [announced via postgrant information from national office to epo] |
Ref country code: ES Free format text: LAPSE BECAUSE OF FAILURE TO SUBMIT A TRANSLATION OF THE DESCRIPTION OR TO PAY THE FEE WITHIN THE PRESCRIBED TIME-LIMIT Effective date: 20050402 |
|
| REG | Reference to a national code |
Ref country code: GB Ref legal event code: 732E |
|
| REG | Reference to a national code |
Ref country code: CH Ref legal event code: PL |
|
| PLBE | No opposition filed within time limit |
Free format text: ORIGINAL CODE: 0009261 |
|
| STAA | Information on the status of an ep patent application or granted ep patent |
Free format text: STATUS: NO OPPOSITION FILED WITHIN TIME LIMIT |
|
| 26N | No opposition filed |
Effective date: 20050923 |
|
| REG | Reference to a national code |
Ref country code: IE Ref legal event code: MM4A |
|
| ET | Fr: translation filed | ||
| REG | Reference to a national code |
Ref country code: FR Ref legal event code: TP |
|
| PG25 | Lapsed in a contracting state [announced via postgrant information from national office to epo] |
Ref country code: PT Free format text: LAPSE BECAUSE OF NON-PAYMENT OF DUE FEES Effective date: 20050522 |
|
| PGFP | Annual fee paid to national office [announced via postgrant information from national office to epo] |
Ref country code: DE Payment date: 20140602 Year of fee payment: 15 |
|
| PGFP | Annual fee paid to national office [announced via postgrant information from national office to epo] |
Ref country code: BE Payment date: 20140605 Year of fee payment: 15 |
|
| PGFP | Annual fee paid to national office [announced via postgrant information from national office to epo] |
Ref country code: FR Payment date: 20140602 Year of fee payment: 15 |
|
| PGFP | Annual fee paid to national office [announced via postgrant information from national office to epo] |
Ref country code: NL Payment date: 20140929 Year of fee payment: 15 |
|
| REG | Reference to a national code |
Ref country code: DE Ref legal event code: R119 Ref document number: 60016931 Country of ref document: DE |
|
| REG | Reference to a national code |
Ref country code: NL Ref legal event code: MM Effective date: 20150401 |
|
| REG | Reference to a national code |
Ref country code: FR Ref legal event code: ST Effective date: 20151130 |
|
| PG25 | Lapsed in a contracting state [announced via postgrant information from national office to epo] |
Ref country code: DE Free format text: LAPSE BECAUSE OF NON-PAYMENT OF DUE FEES Effective date: 20151001 |
|
| PG25 | Lapsed in a contracting state [announced via postgrant information from national office to epo] |
Ref country code: FR Free format text: LAPSE BECAUSE OF NON-PAYMENT OF DUE FEES Effective date: 20150331 |
|
| PGFP | Annual fee paid to national office [announced via postgrant information from national office to epo] |
Ref country code: GB Payment date: 20160425 Year of fee payment: 17 |
|
| REG | Reference to a national code |
Ref country code: GB Ref legal event code: 732E Free format text: REGISTERED BETWEEN 20161013 AND 20161019 |
|
| PG25 | Lapsed in a contracting state [announced via postgrant information from national office to epo] |
Ref country code: NL Free format text: LAPSE BECAUSE OF NON-PAYMENT OF DUE FEES Effective date: 20150401 |
|
| PG25 | Lapsed in a contracting state [announced via postgrant information from national office to epo] |
Ref country code: BE Free format text: LAPSE BECAUSE OF NON-PAYMENT OF DUE FEES Effective date: 20150331 |
|
| GBPC | Gb: european patent ceased through non-payment of renewal fee |
Effective date: 20170330 |
|
| PG25 | Lapsed in a contracting state [announced via postgrant information from national office to epo] |
Ref country code: GB Free format text: LAPSE BECAUSE OF NON-PAYMENT OF DUE FEES Effective date: 20170330 |