EP1187067A2 - Automatic detection of colorimetry of unknown CMYK images - Google Patents
Automatic detection of colorimetry of unknown CMYK images Download PDFInfo
- Publication number
- EP1187067A2 EP1187067A2 EP01121032A EP01121032A EP1187067A2 EP 1187067 A2 EP1187067 A2 EP 1187067A2 EP 01121032 A EP01121032 A EP 01121032A EP 01121032 A EP01121032 A EP 01121032A EP 1187067 A2 EP1187067 A2 EP 1187067A2
- Authority
- EP
- European Patent Office
- Prior art keywords
- image
- colorimetry
- metrics
- class
- classes
- Prior art date
- Legal status (The legal status is an assumption and is not a legal conclusion. Google has not performed a legal analysis and makes no representation as to the accuracy of the status listed.)
- Withdrawn
Links
Images


Classifications
-
- G—PHYSICS
- G06—COMPUTING OR CALCULATING; COUNTING
- G06T—IMAGE DATA PROCESSING OR GENERATION, IN GENERAL
- G06T7/00—Image analysis
- G06T7/90—Determination of colour characteristics
-
- G—PHYSICS
- G06—COMPUTING OR CALCULATING; COUNTING
- G06V—IMAGE OR VIDEO RECOGNITION OR UNDERSTANDING
- G06V10/00—Arrangements for image or video recognition or understanding
- G06V10/40—Extraction of image or video features
- G06V10/56—Extraction of image or video features relating to colour
Definitions
- the invention relates to the art of rendering images.
- the invention finds application where the colorimetry or authorship device of an image is unknown.
- Modern electronic image files contain identifying information.
- the identifying information is usually stored in what is called a header section of the image files.
- the header can identify a means with which the image was created. For example, the header can list an authoring device by manufacturer and model number as well as describe configuration settings that were used during authoring. Additionally, the header can describe a color space or gamut the authoring device operates in.
- the header information can be used by image processing equipment to properly interpret image data within the file and automatically ensure proper rendering.
- the header information is most important when an image created or adjusted for proper rendering on a first image processing system or device is rendered on a second image processing system or device.
- the header information is especially important when the second image rendering system is totally unaware of, and disconnected from, the first image processing system or authoring device.
- header information is especially important.
- Modern image processing equipment depends on the header information in order to accurately and automatically translate or transform an image created for rendering on a first device in the first color space or gamut so that it can be properly rendered with a second device in a second color space.
- authorship device or colorimetry header information is needed in order to properly convert an image into a device independent color space, such as, for example the CIELAB color space.
- legacy images These image files, created on authoring devices that do not provide complete or correct identifying information, are referred to in this document as legacy images.
- the image processing equipment must request operator intervention in order to properly identify and render the image.
- the operator is presented with a list of possible sources for the data. For example, while processing a CMYK image of unknown origin, wherein C, M, Y, and K represent color separations (cyan, magenta, yellow, black), the user may be asked to pick the device the image was created for, or could have been created with, from a list including offset press standards such as Specification Web Offset Printing (SWOP) devices, JapanColor devices, Euroscale devices, and/or other devices.
- SWOP Specification Web Offset Printing
- choices may include scanners, scanned medium (e.g. photographic, lithographic), and tone scale ( ⁇ ) corrections.
- softproofing involves the emulation of the characteristics of possible authoring devices on a display device such as a computer CRT.
- a user, or operator of an image processor enters or selects a possible authoring device, for example, from a list of known authoring devices.
- the image processor interprets and displays image file information in a manner that is based on the assumption that the selected authoring device is the actual authoring device.
- the characteristics of the selected authoring device are emulated on the display device.
- the image is rendered through that emulation.
- the user is able to evaluate a likelihood that the selected authoring device is the actual authoring device by studying the displayed image. If the selection is incorrect a new selection is made and the process is repeated.
- the softproofing method eliminates the need to actually render or print the image after each authorship guess or selection. Therefore, the softproofing method can save a great deal of time.
- an inexperienced user may still be forced to select and evaluate a large number of possible authoring devices before finding a correct or acceptable authoring device or colorimetry description.
- a list of possible authoring devices can contain hundreds of items to choose from.
- a complete list of possible authoring devices includes an entry for every scanner, word processor, desk top publisher, electronic prepress tool, image processor digital front end (DFE), computer display, spreadsheet editor, slide presentation editor, painting program, digital camera and image editor available.
- a method is needed that identifies image colorimetry so that proper image transformation and processing techniques can be applied to legacy images.
- colorimetry refers to the information that enables a relationship to be defined between the image data and an unambiguously defined color space (such as CIELAB, CIEXYZ, etc.) Identifying, for example, that a CMYK file was prepared for a SWOP press is equivalent to identifying the colorimetry of the file, since industry standard color tables exist that translate between SWOP CMYK and CIELAB.
- the present invention comprises a method for determining the colorimetry of an image file.
- the method comprises the step of calculating at least a colorant relationship metric based on a relationship between reciprocal colorant combinations in pixels comprising at least part of the image. Reciprocal colorant relationships occur where one colorant or set of colorants can be used to replace or substitute for some portions of another set of colorants.
- the method comprises the step of associating the image with one of a plurality of image classes based, at least in part, on a similarity between the first calculated metric and predetermined metrics associated with each of the plurality of image classes.
- Some embodiments of the method further comprise calculating a saturation metric based on a saturation of at least part of the image and calculating a luminance metric based on a luminance of at least part of the image.
- Some embodiments use at least one of the saturation and luminance metrics in the association step.
- An exemplary embodiment of the invention comprises a method for determining the colorimetry of a CMYK image.
- the method comprises the steps of predetermining a set of colorimetry metrics describing each of a plurality of image classes, calculating a set of colorimetry metrics describing the image, and associating the image with one of the plurality of image classes based on a relationship between the predetermined set of colorimetry metrics and the calculated set of colorimetry metrics.
- the step of predetermining a set of colorimetry metrics can further comprise predetermining a first metric based on an image saturation and an image luminance, and predetermining a second metric based on at least one of an under color removal and a gray color replacement parameter.
- One color image processor operative to automatically detect the colorimetry of an image comprises a training image analyzer operative to predetermine image class colorimetry metrics for a plurality of image classes, a colorimetry detector operative to calculate colorimetry metrics that describe an image, and a colorimetry class associator operative to associate the image with one of the plurality of image classes based on a comparison of the calculated colorimetry metrics and the predetermined image class colorimetry metrics.
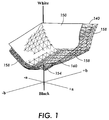
- a first device for example, a high-end xerographic printer has a first color gamut 140 .
- a second device for example, a Standard Web Offset Printing (SWOP) device has a second color gamut 150 .
- the gamuts are illustrated in the CIELAB color space.
- the first color gamut 140 is, in general, larger than the second color gamut 150 .
- the first color gamut extends further into dark 154 and high chroma 158 regions of color space. Therefore, it is likely that images prepared for rendering on the second device will contain a higher percentage of pixels at a gamut boundary 160 than if the same image were prepared for rendering on the first device. In other words, images prepared for rendering on the second device will contain a relatively high percentage of pixels calling for a maximum amount of certain colorants.
- the present invention takes advantage of differentiating or telltale characteristics such as these to detect or identify the colorimetry or authoring device of an image.
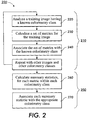
- a training process 200 differentiating characteristics of images prepared for rendering on various devices are identified in a training process 200 .
- a first portion 210 of the training process 200 an image (not shown) with a first known colorimetry class is used as a training image.
- the training image is analyzed in a training image analysis step 220 and interesting portions of the image identified.
- interesting portions of the image include, for example, portions of the image calling for colors known to have differentiating characteristics.
- a metric calculation step 230 a set of differentiating metrics are calculated. The metrics describe characteristics of the training image.
- the calculated set of metrics is then stored or recorded in association with the colorimetry class of the training image in a colorimetry association step 240 .
- This first portion 210 of the training process is repeated with other images until a statistically significant number of training images have been analyzed.
- the other images include further examples of images of the first known colorimetry class as well as a statistically significant number of images of other colorimetry classes of interest.
- a second portion 250 of the training process includes a summary statistic calculation step 260 .
- Summary statistics include, for example a mean and a standard deviation. Summary statistics are calculated for each colorimetry class. For example, where a plurality of training images are associated with a first known colorimetry class and a set of differentiating metrics have been calculated for each of the plurality of images, a mean value and a standard deviation are calculated for each differentiating metric.
- the summary statistics are then associated with the first known colorimetry class in a summary statistic association step 270 .
- summary statistics are associated with each known colorimetry class.
- the summary statistics will be used to describe and distinguish the colorimetry classes from one another in further processing.
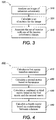
- a colorimetry detection process 300 can be performed on an image file of unknown colorimetry.
- this document refers to an image file of unknown colorimetry as a legacy image.
- the legacy image is analyzed in a legacy image analysis step 310 and interesting portions of the image identified.
- a metric calculation step 320 a set of differentiating metrics are calculated.
- the metrics describe characteristics of the legacy image.
- the calculated set of metrics is then stored or recorded in association with the legacy image.
- a legacy image colorimetry association step 330 the set of differentiating metrics are compared with the summary statistics of the known colorimetry classes described with reference to FIGURE 2.
- a classification algorithm is used to associate an appropriate colorimetry class with the legacy image.
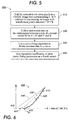
- a metric calculation process 400 includes a first metric calculation step 410 .
- the first metric is calculated based on saturation. For example, where images of interest are CMYK images, a first saturation metric S is calculated based on the following equations. NOTE: All the following equations assume the C, M, Y and K terms are normalized and have values between zero and one.
- R (1-C)(1-K)
- G (1-M)(1-K)
- B (1-Y)(1-K)
- S [max(R, G, B)- min(R,G,B)] / max(R,G,B)
- R, G, and B are considered intermediate terms. They are used here to simplify the appearance of the equations.
- the (1-K) terms in the equations for R, G, and B fold the lightness/darkness information from a K colorant portion of a CMYK pixel into the R, G, and B terms.
- the numerator in equation (1) is a measure of how vivid a color is. Neutral colors (grays ranging from white to black) will generate relatively low values for the numerator.
- a second metric Y is calculated in a second metric calculation step 420 .
- the second metric Y is based on luminance and is calculated, for example, from the following equation.
- Y 0.25R + 0.5G + 0.25B Y is a measure of how bright a pixel appears. Extra weight is given to the G term because it represents spectral content in a portion of a visible light spectrum where human vision is most sensitive.
- S values are skewed toward large values and Y values are skewed toward the small values. Therefore, we developed a combined metric S' that allows the effect of these two tendencies to amplify one another.
- S' is calculated, for example, with the following equation.
- S' S/(Y+e)
- the e term in the denominator is a small offset. It prevents S' from becoming too large when Y is very small.
- S' and its constituent metrics, are calculated for every pixel in an image.
- S' need only be calculated for pixels where S is greater than some threshold.
- a threshold of .2 is useful in reducing calculation load. Additionally, setting the threshold at .2 does not adversely affect colorimetry detection accuracy.
- the combined metric calculation step is concluded by selecting an S' value that is descriptive of the image as a whole. For example, our tests indicate that using the S' value from the 99th percentile of all calculated S' of an image is a good descriptor of the image as a whole.
- the 99th percentile S' is denoted here as first differentiation parameter ⁇ 1 .
- a fourth metric is calculated in a fourth metric calculation step 440 .
- the fourth metric is based on a relationship between reciprocal colorant combinations. Reciprocal colorant combinations occur where one colorant or set of colorants can be used to replace or substitute for some portions of another set of colorants. For example, during image preparation, a K or black colorant level is usually adjusted in an under color removal gray color replacement procedure. In these procedures the level or amount of K colorant in a pixel is manipulated based on levels of other colorants. For example, equal amounts of C, M and Y can be removed from a pixel and replaced with a corresponding amount of K. Hence, in this case, CMY combinations are said to be reciprocal with respect to K. The same concept applies to other color spaces as well.
- the hi-fi color space includes reciprocal colorants.
- hi-fi color there are, for example 5 separations, C, M, Y, K, and green (G).
- Green colorant can be used to substitute for some amount of cyan and yellow colorants. This is because mixtures of cyan and yellow colorants are perceived as green. Therefore, in this color space, green is reciprocal with cyan and yellow.
- Different image preparation procedures used to prepare an image for rendering on various devices tend to use different procedures to manipulate the level of reciprocal colorants in a pixel. The procedures used are selected to accommodate or adapt to capabilities and/or limitations of an intended rendering device. Whether or not a colorant is substituted for other colorants, if it is possible to make such a substitution, the colorants in question are considered reciprocal.
- the effects of these various procedures can act as fingerprints and help identify the intended rendering device and therefore the colorimetry of an image. Procedures that measure the relationship between reciprocal colorant combinations in a CMYK image can be used to unmask these so-called
- a process for calculating a fourth metric 500 based on a relationship between reciprocal colorant combinations includes a reciprocal colorant fold back step 510 .
- the reciprocal colorant fold back step the visual effect of, for example a K colorant is returned or folded into a new set of colorant levels C', M' and Y' .
- a curve fitting step 530 the recorded data (K vs. X) is fitted, for example, to the following equation using, for example, least squares regression techniques.
- K FIT [X - X 0 ] ⁇ for X > 0
- the curve fitting parameters X 0 and ⁇ indicate the under color removal (UCR) or gray color replacement (GCR) strategy used to prepare an image for rendering.
- UCR under color removal
- GCR gray color replacement
- Figure 6 illustrates the curve fitting process 600 and the expected curves for a few popular image preparation strategies.
- Dotted points 610 on the graph represent actual X vs. K data recorded from an image prepared for rendering on a SWOP device.
- a solid curve 620 running through the dotted points 610 is a best fit curve in the form of equation (5) fitted to the data represented buy the dotted points 610 .
- a first dashed curve 630 represents the fitted curve expected when a colorant relationship from pixels from an image prepared for rendering by a xerographic device is studied.
- a second dashed curve or line 640 represents the fitted curve expected when an image prepare for rendering by an inkjet device is analyzed.
- X 0 , the offset 650 is, for a given curve, the value of X at which K rises above a small threshold, for example, zero.
- X 0 is an effective discriminating feature for CMYK colorimetry classification.
- X 0 is expected to have a value near point 660 for the first dashed curve 630 or the xerographic device and X 0 is expected to have a value near point 670 for the second dashed curve 640 of the inkjet device.
- the ⁇ parameter has been less useful.
- most experiments thus far have involved only SWOP CMYK images and CMYK images prepared for the Xerox DocuColor 40 (DC40) xerographic printer. It is anticipated that other curves and curve fitting parameters (for example, ⁇ ) will prove useful in detecting other CMYK sources.
- ⁇ may be useful in detecting images prepared for rendering on inkjet printers.
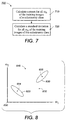
- a summary statistic calculation process 700 includes a ⁇ n mean calculation step 710 .
- a mean or average ⁇ n value is calculated for the ⁇ n 's associated with training images in a particular colorimetry class.
- the summary statistic used is a mean it is appropriate to also calculate a standard deviation for the ⁇ n 's associated with training images in the particular colorimetry class.
- the standard deviation is calculated in a ⁇ n standard deviation calculation step 720 .
- ⁇ n refers to all the differentiation parameters used in a given embodiment for which the calculation of summary statistics is appropriate, for example, ⁇ 1 and ⁇ 2 .
- standard images (a Standard Color Image Data set of 8 images(ISO-SCID) set) and a standard Graphic Arts Technical Foundation set of 6 images (GATF)) were used for training in an experiment to test the method for colorimetry detection.
- a first set of files was prepared for rendering with a SWOP device and a second set of files was prepared for rendering with a high-end xerographic image processor (a DC40).
- the summary statistics describing ⁇ 1 for each colorimetry class are listed in Table 1 below.
- the SWOP colorimetry class was characterized by a mean ⁇ 1 of 53.9 with a standard deviation of 36.
- the DC40 colorimetry class was characterized by a mean ⁇ 1 of 9.5 and a standard deviation of 2.2.
- Table 2 summarizes ⁇ 2 values calculated for the two sets of standard images mentioned above (the standard ISO-SCID set (8 images) and the standard GATF set (6 images)).
- the mean value of ⁇ 2 was 0.47 and the standard deviation was 0.15.
- ⁇ 2 was 0.16 and the standard deviation was 0.07.
- a classification algorithm examines the differentiation parameters of a legacy image and compares them to the summary statistics of known colorimetry classes.
- a legacy image is directly associated with one of the known colorimetry classes.
- the colorimetry class selected for association is the one with summary statistics that most closely match the differentiation parameters of the legacy image.
- the legacy image may be labeled with a colorimetry that is a hybrid or blend between two or more known colorimetry classes.
- an image may not fit well in any known class or blend of classes.
- color sweeps and test patch images may defy classification. Images such as these are comprised of pure hues. Pure hues are located at gamut boundaries independent of the kind of rendering device the pure hues are to be rendered on. Unclassifiable images, such as these, can be labeled as, for example, "colorimetry free” images and further processing can proceed accordingly.
- Bayesian quadratic classifier algorithm compares legacy image differentiation parameters to know colorimetry class summary statistics in order to detect the colorimetry of the legacy image.
- the Bayesian quadratic classifier algorithm is preferable for its relative simplicity and accuracy.
- Bayesian classifiers are based on statistical probabilities. The probability that the differentiation parameters of a legacy image fall within the range of values associated with each known colorimetry class are calculated based on the summary statistics of each known colorimetry class. The colorimetry class with the highest probability of including the differentiation parameter values of the legacy image is associated with the legacy image. Alternatively, if two or more colorimetry classes are equally likely to include the differentiation parameters of the legacy image, the legacy image may be labeled as having a colorimetry that is hybridization or blend of the two or more colorimetry classes. If the legacy image differentiation parameters have a low probability of being found in any known colorimetry class, the image may be labeled as being colorimetry free.
- the Bayesian quadratic classifier determines probabilities that the differentiation parameters of a legacy image fall within ranges of values associated with each known colorimetry class.
- the Bayesian quadratic classifier algorithm treats the differentiation parameters and the summary statistics as if they are a point 810 and regions 820 , 830 within a feature space respectively 840 .
- the summary statistics are described as regions or clouds because they represent a range of values.
- the summary statistics are, for example a set of means or average values and standard deviations.
- the standard deviations are indicative of a range or region around the means where it is likely to find differentiation parameters for images of the same colorimetry class. In general, the further from the mean a value is, the less likely it is to be within the class.
- the feature space has two dimensions, ⁇ 1 and ⁇ 2 .
- the probability that at image is of a particular colorimetry class is calculated by measuring a kind of statistical distance between the point 810 defined by the differentiation parameters of the legacy image and the regions or clouds 820 , 830 defined by the summary statistics of the know colorimetry classes. This distance is called a Mahanalobis distance.
- W [ ⁇ 1... ⁇ n] is called a feature vector.
- the feature vector can be thought of as extending from the origin 850 of the feature space 840 to the point 810 defined by the differentiation characteristics of a legacy image.
- M i is a mean vector and contains the means 854, 858 of each of the differentiation metrics of each of the known colorimetry classes.
- the SWOP CMYK device colorimetry is denoted C 1
- the DC40 CMYK colorimetry is denoted C 2 .
- ⁇ i is a covariance matrix.
- the covariance matrix contains a measure of the size and shape of the region or cloud of each of the colorimetry classes, for example C 1 and C 2 .
- the values in the covariance matrix are related to the standard deviations of each of the differentiation metrics of each colorimetry class.
- the Mahanalobis distance D i is a normalized Euclidean distance. As used here the Mahanalobis distances measure the separation between the point 810 defined by the differentiation parameters of the legacy image and the mean position 854, 858 M i of each colorimetry class. The normalization takes into account the covariance ⁇ i of each colorimetry class. The Bayesian quadratic classifier then picks the colorimetry class with the smaller distance, metric D i , as the most likely class for the input image. That is: If D 1 ⁇ D 2 pick C 1 Else pick C 2
- the colorimetry class C i assigned to the legacy image is the one associated with the minimum D i i.e.; min (D 1 , D 2 , D 3 ,...D n ). If a plurality of colorimetry classes are at about a same shortest Mahanalobis distance from W , for example D 1 ⁇ D 3 , then the colorimetry of the legacy image can be defined as a hybrid or blend of the group of closest colorimetry classes (D 1 and D 3 ). If none of the colorimetry classes is reasonably close to W (D 1 , D 2 ...D n >> Threshold) the legacy image can be labeled "colorimetry free" for the purposes of subsequent processing.
- a feature space 900 contains probability clouds representing various colorimetry classes.
- a SWOP image class 910 is characterized by relatively high values of ⁇ 1 and relatively low values of ⁇ 2 .
- a high-end xerography colorimetry class 920 is characterized by somewhat lower values of ⁇ 1 and somewhat higher values of ⁇ 2 .
- some embodiments may use additional differentiation parameters in order to improve image classification accuracy.
- a thermal inkjet/coated paper colorimetry class 930 is characterized by values of ⁇ 1 that are similar to those of the high-end xerography class 920 .
- thermal inkjet/coated paper colorimetry class 930 is also characterized by relatively high values of ⁇ 2 .
- a thermal inkjet/plain paper colorimetry class 940 is expected to be characterized by values of ⁇ 2 that are similar to those of the thermal inkjet/coated paper colorimetry class 930 .
- the thermal inkjet/plain paper colorimetry class 940 is characterized by somewhat higher values of ⁇ 1 than is the thermal inkjet/coated paper colorimetry class 930 .
- test images were classified as belonging to either the SWOP or DC40 colorimetry class.
- Table 3 summaries the accuracy of the method for every possible combination of training and test images. The entries in Table 3 are the number of misclassifications out of the total number of images tested. TEST SET TRAINING SET GATF SCID GATF 0 out of 12 0 out of 16 SCID 0 out of 12 1 out of 16 Clearly the method did a very good job of identifying the colorimetry of the test images. In the case where one image was mis-classified, the characteristics of the image were such that the two Mahanalobis distances (D 1 and D 2 ) were very similar.
- the mis-classified image would have instead been classified as a hybrid. This would have been an acceptable result, as any subsequent processing treating the image as a hybrid would have rendered the image in an acceptable manner.
- equation (7) can be made to, for example, equation (7) to improve classification accuracy.
- equation (7) One simple extension of equation (7) is the following form: If D 1 ⁇ ⁇ D 2 + ⁇ pick C 1 Else pick C 2 where ⁇ and ⁇ are chosen to minimize misclassification within representative training and test sets. Of course, more sophisticated adjustments are required where more than two known colorimetry classes are used.
- n is the number of known colorimetry classes
- D t is a small distance threshold that accounts for a potential singularity in the numerator of equation (9).
- Class i D 2 *100 / D 1 + D 2 if D 1 > D t
- Equations (9) or (10) can be useful, for example, in the case where a legacy or test image is classified as a hybrid. Equations (9) or (10) can be helpful in properly blending between two or more colorimetry classes.
- a color image processor 1000 for carrying out the method of the present invention comprises a training image analyzer 1010 , a colorimetry detector 1020 , a colorimetry class associator 1030 and an information storage device 1040 .
- the training image analyzer 1010 analyzes training images. Training images are image files that have been prepared for rendering on devices of known colorimetry.
- the training image classifier measures differentiation parameters for a plurality of training images.
- the training image analyzer associates the differentiation parameters of a training image with the colorimetry class of that training image.
- the training image analyzer calculates summary statistics for the given colorimetry class and records the summary statistics in association with the given colorimetry class. The recording is made in the information storage device 1040 .
- the colorimetry detector 1020 measures differentiation parameters for individual images of unknown colorimetry.
- the training image analyzer 1010 makes use of the colorimetry detector 1020 to make training image differentiation parameter measurements as well. In either case, when the colorimetry detector 1020 measures differentiation parameters of an image of unknown colorimetry it passes those differentiation parameters to the class associator 1030 .
- the class associator 1030 retrieves the colorimetry class summary statistics stored in the information storage device and compares the summary statistics with the differentiation parameters of the image of unknown colorimetry. Based on the comparison, the class associator 1030 assigns an appropriate colorimetry class to the image, reports that the colorimetry of the image is a hybrid of known colorimetry classes, reports that the colorimetry of the image is not similar to any known colorimetry, or the class associator 1030 reports a confidence level or probability that the legacy image has the same colorimetry as any of the known colorimetries.
- the training image analyzer 1010 , colorimetry detector 920 and class associator 1030 are usually implemented as a set of software modules.
- the modules access the information storage device 1040 and pass information to each other.
- the information storage device 1040 is preferably a computer or microprocessor memory. However, other storage devices may be used. For example, a computer hard drive or a computer network can be used as information storage device.
- training image analyzer 1010 colorimetry detector 1020 and class associator 1030 are usually stored in computer or microprocessor memory and executed by a microprocessor or central processing unit.
- functions of training image analyzer 1010 , colorimetry detector 1020 and class associator 1030 can be carried out in various ways and by various devices, including but not limited to distributed processors and various components interconnected via computer networks.
Landscapes
- Engineering & Computer Science (AREA)
- Physics & Mathematics (AREA)
- General Physics & Mathematics (AREA)
- Theoretical Computer Science (AREA)
- Multimedia (AREA)
- Computer Vision & Pattern Recognition (AREA)
- Spectrometry And Color Measurement (AREA)
- Image Processing (AREA)
- Image Analysis (AREA)
- Facsimile Image Signal Circuits (AREA)
- Color Image Communication Systems (AREA)
Abstract
Description
| ω1 (99th percentile of S') | CMYK DC40 | SWOP CMYK |
| Mean | 52.9 | 9.5 |
| Standard Deviation | 36 | 2.2 |
| ω2 (99th percentile of S') | SWOP CMYK | DC40 CMYK |
| Mean | 0.47 | 0.16 |
| Standard Deviation | 0.15 | 0.07 |
| TEST SET | ||
| TRAINING SET | GATF | SCID |
| GATF | 0 out of 12 | 0 out of 16 |
| SCID | 0 out of 12 | 1 out of 16 |

Claims (10)
- A method for determining the colorimetry of an image, the image included in an image file in association with incomplete or incorrect authorship and colorimetry information, the method comprising the step of:calculating at least a colorant relationship metric based on a relationship between reciprocal colorant combinations in pixels comprising at least part of the image; andassociating the image with one of a plurality of image classes based, at least in part, on a similarity between the colorant relationship metric and predetermined metrics associated with each of the plurality of image classes.
- The method for determining the colorimetry of an image of claim 1 further comprising the steps of:calculating a saturation metric based on a saturation of at least part of the image, andcalculating a luminance metric based on a luminance of at least part of the image.
- The method for determining the colorimetry of an image of claim 2 further comprising:calculating a combination metric based on the saturation and luminance metrics.
- The method for determining the colorimetry of an image of claim 1 further comprising:using a classification algorithm to predetermine a set of metrics for each of a plurality of image colorimetry classes.
- The method for determining the colorimetry of an image of claim 4 wherein the step of using a classification algorithm further comprises:using a Bayesian quadratic classification algorithm.
- The method for determining the colorimetry of an image of claim 4 wherein the step of associating further comprises:measuring a Mahanalobis distance between a point defined by the at least one calculated metrics and each of a plurality of regions defined by the sets of predetermined metrics.
- A method for determining the colorimetry of an image comprising the steps of:predetermining a set of colorimetry metrics describing each of a plurality of image classes;calculating a set of colorimetry metrics describing the image, andassociating the image with one of the plurality of image classes based on a relationship between the predetermined set of colorimetry metrics and the calculated set of colorimetry metrics.
- The method for determining the colorimetry of an image of claim 7 wherein the step of predetermining a set of colorimetry metrics further comprises:predetermining a first metric based on an image saturation and an image luminance, andpredetermining a second metric based on at least one of an under color removal and a gray color replacement parameter.
- The method for determining the colorimetry of an image of claim 7 wherein the step of associating further comprises:measuring a Mahanalobis distance between the calculated set of colorimetry metrics and the plurality of predetermined colorimetry metrics.
- A color image processor operative to automatically detect the colorimetry of an image, the color image processor comprising:a training image analyzer operative to predetermine image class colorimetry metrics for a plurality of image classes;a colorimetry detector operative to calculate colorimetry metrics that describe an image;a colorimetry class associator operative to associate the image with one of the plurality of image classes based on a comparison of the calculated colorimetry metrics and the predetermined image class colorimetry metrics.
Applications Claiming Priority (2)
| Application Number | Priority Date | Filing Date | Title |
|---|---|---|---|
| US656623 | 2000-09-07 | ||
| US09/656,623 US6819792B1 (en) | 2000-09-07 | 2000-09-07 | Automatic detection of colorimetry of unknown CMYK images |
Publications (2)
| Publication Number | Publication Date |
|---|---|
| EP1187067A2 true EP1187067A2 (en) | 2002-03-13 |
| EP1187067A3 EP1187067A3 (en) | 2003-02-12 |
Family
ID=24633838
Family Applications (1)
| Application Number | Title | Priority Date | Filing Date |
|---|---|---|---|
| EP01121032A Withdrawn EP1187067A3 (en) | 2000-09-07 | 2001-08-31 | Automatic detection of colorimetry of unknown CMYK images |
Country Status (3)
| Country | Link |
|---|---|
| US (1) | US6819792B1 (en) |
| EP (1) | EP1187067A3 (en) |
| JP (1) | JP4633979B2 (en) |
Families Citing this family (3)
| Publication number | Priority date | Publication date | Assignee | Title |
|---|---|---|---|---|
| US6985622B2 (en) * | 2001-09-21 | 2006-01-10 | Hewlett-Packard Development Company, L.P. | System and method for color correcting electronically captured images by determining input media types using color correlation matrix |
| JP3901173B2 (en) * | 2004-06-07 | 2007-04-04 | セイコーエプソン株式会社 | Image processing apparatus, image processing method, and image processing program |
| US20100158359A1 (en) * | 2008-12-18 | 2010-06-24 | Yue Qiao | Image data clustering and color conversion |
Family Cites Families (13)
| Publication number | Priority date | Publication date | Assignee | Title |
|---|---|---|---|---|
| US4813000A (en) * | 1986-07-09 | 1989-03-14 | Jones-Blair Company | Computerized color matching |
| US6057931A (en) * | 1993-07-12 | 2000-05-02 | Mci Telecommunications Corporation | Method and apparatus for controlling color image reproduction |
| JPH07182516A (en) * | 1993-10-13 | 1995-07-21 | Hewlett Packard Co <Hp> | Judgement method of color component of computer graphic picture |
| US5543940A (en) * | 1994-02-02 | 1996-08-06 | Electronics For Imaging | Method and apparatus for converting color scanner signals into colorimetric values |
| US5748852A (en) | 1994-09-16 | 1998-05-05 | Lockheed Martin Corporation | Fuzzy-logic classification system |
| JP3088063B2 (en) * | 1994-10-25 | 2000-09-18 | 富士通株式会社 | Color image processing method and color image processing apparatus |
| US6076083A (en) | 1995-08-20 | 2000-06-13 | Baker; Michelle | Diagnostic system utilizing a Bayesian network model having link weights updated experimentally |
| US5850472A (en) | 1995-09-22 | 1998-12-15 | Color And Appearance Technology, Inc. | Colorimetric imaging system for measuring color and appearance |
| US5819007A (en) | 1996-03-15 | 1998-10-06 | Siemens Medical Systems, Inc. | Feature-based expert system classifier |
| US6007332A (en) * | 1996-09-26 | 1999-12-28 | O'brien; William J. | Tooth color matching system |
| DE19749063A1 (en) * | 1997-11-06 | 1999-05-12 | Heidelberger Druckmasch Ag | Process for achieving color measurements for ink printers |
| US6509903B1 (en) * | 1999-10-06 | 2003-01-21 | Creoscitex Corporation Ltd. | System and method for recording an image |
| US6594383B1 (en) * | 1999-11-16 | 2003-07-15 | International Business Machines Corporation | Method and apparatus for indexing and retrieving images from an images database based on a color query |
-
2000
- 2000-09-07 US US09/656,623 patent/US6819792B1/en not_active Expired - Lifetime
-
2001
- 2001-08-31 EP EP01121032A patent/EP1187067A3/en not_active Withdrawn
- 2001-09-06 JP JP2001269603A patent/JP4633979B2/en not_active Expired - Fee Related
Also Published As
| Publication number | Publication date |
|---|---|
| JP4633979B2 (en) | 2011-02-16 |
| JP2002183730A (en) | 2002-06-28 |
| EP1187067A3 (en) | 2003-02-12 |
| US6819792B1 (en) | 2004-11-16 |
Similar Documents
| Publication | Publication Date | Title |
|---|---|---|
| US6360007B1 (en) | Dynamic optimized color lut transformations based upon image requirements | |
| US20040109180A1 (en) | Color gamut mapping using a cost function | |
| EP1453006A1 (en) | Converted digital colour image with improved colour distinction for colour-blinds | |
| US20160100080A1 (en) | Image data clustering and color conversion | |
| US8786626B2 (en) | Color processing device, color processing method, and computer readable medium storing program | |
| US8547609B2 (en) | Color conversion of image data | |
| JPH09163161A (en) | Image processing device | |
| US20020154326A1 (en) | Image processing method and apparatus | |
| US6125200A (en) | Removing non-text information from a color image | |
| EP1947577B1 (en) | Method, medium, and system classifying images based on image properties | |
| US6587225B1 (en) | Image processing apparatus | |
| EP2206333A1 (en) | Method, apparatus and computer program for transforming digital colour images | |
| US7570836B2 (en) | Backlit image judgment | |
| US7466455B2 (en) | Image processing method and system for performing monochrome/color judgement of a pixelised image | |
| US8456704B2 (en) | Colorimetric matching the perception of a digital data file to hardcopy legacy | |
| US6819792B1 (en) | Automatic detection of colorimetry of unknown CMYK images | |
| US8373894B2 (en) | System and method for selecting a proof printer for a given production printer | |
| EP1972131B1 (en) | Color reproduction evaluation apparatus and program storage medium | |
| US7817303B2 (en) | Image processing and image forming with modification of a particular class of colors | |
| EP1453008A1 (en) | Cocverted digital colour image with improved colour distinction for colour-blinds | |
| JP2010003091A (en) | Object detection device, object detection method, object detection program and printer | |
| US8363267B2 (en) | Image forming apparatus and color converting method thereof | |
| US10122893B2 (en) | Automatic post processing of spot color combinations for a constrained colorant set | |
| US20140207636A1 (en) | Systems and methods for modifying color characteristics of an image | |
| US8913290B2 (en) | System and methods for determining color characteristics of an image |
Legal Events
| Date | Code | Title | Description |
|---|---|---|---|
| PUAI | Public reference made under article 153(3) epc to a published international application that has entered the european phase |
Free format text: ORIGINAL CODE: 0009012 |
|
| AK | Designated contracting states |
Kind code of ref document: A2 Designated state(s): AT BE CH CY DE DK ES FI FR GB GR IE IT LI LU MC NL PT SE TR |
|
| AX | Request for extension of the european patent |
Free format text: AL;LT;LV;MK;RO;SI |
|
| PUAL | Search report despatched |
Free format text: ORIGINAL CODE: 0009013 |
|
| AK | Designated contracting states |
Designated state(s): AT BE CH CY DE DK ES FI FR GB GR IE IT LI LU MC NL PT SE TR |
|
| AX | Request for extension of the european patent |
Extension state: AL LT LV MK RO SI |
|
| 17P | Request for examination filed |
Effective date: 20030812 |
|
| AKX | Designation fees paid |
Designated state(s): DE FR GB |
|
| 17Q | First examination report despatched |
Effective date: 20141023 |
|
| STAA | Information on the status of an ep patent application or granted ep patent |
Free format text: STATUS: THE APPLICATION IS DEEMED TO BE WITHDRAWN |
|
| 18D | Application deemed to be withdrawn |
Effective date: 20150303 |