EP1184455A1 - Method for predicting binding site structure of gene regulator and apparatus therefor - Google Patents
Method for predicting binding site structure of gene regulator and apparatus therefor Download PDFInfo
- Publication number
- EP1184455A1 EP1184455A1 EP00935572A EP00935572A EP1184455A1 EP 1184455 A1 EP1184455 A1 EP 1184455A1 EP 00935572 A EP00935572 A EP 00935572A EP 00935572 A EP00935572 A EP 00935572A EP 1184455 A1 EP1184455 A1 EP 1184455A1
- Authority
- EP
- European Patent Office
- Prior art keywords
- gene
- enhancer
- binding sites
- promoter
- binding site
- Prior art date
- Legal status (The legal status is an assumption and is not a legal conclusion. Google has not performed a legal analysis and makes no representation as to the accuracy of the status listed.)
- Withdrawn
Links
Images



Classifications
-
- C—CHEMISTRY; METALLURGY
- C12—BIOCHEMISTRY; BEER; SPIRITS; WINE; VINEGAR; MICROBIOLOGY; ENZYMOLOGY; MUTATION OR GENETIC ENGINEERING
- C12N—MICROORGANISMS OR ENZYMES; COMPOSITIONS THEREOF; PROPAGATING, PRESERVING, OR MAINTAINING MICROORGANISMS; MUTATION OR GENETIC ENGINEERING; CULTURE MEDIA
- C12N15/00—Mutation or genetic engineering; DNA or RNA concerning genetic engineering, vectors, e.g. plasmids, or their isolation, preparation or purification; Use of hosts therefor
- C12N15/09—Recombinant DNA-technology
- C12N15/10—Processes for the isolation, preparation or purification of DNA or RNA
- C12N15/1034—Isolating an individual clone by screening libraries
- C12N15/1089—Design, preparation, screening or analysis of libraries using computer algorithms
-
- G—PHYSICS
- G16—INFORMATION AND COMMUNICATION TECHNOLOGY [ICT] SPECIALLY ADAPTED FOR SPECIFIC APPLICATION FIELDS
- G16B—BIOINFORMATICS, i.e. INFORMATION AND COMMUNICATION TECHNOLOGY [ICT] SPECIALLY ADAPTED FOR GENETIC OR PROTEIN-RELATED DATA PROCESSING IN COMPUTATIONAL MOLECULAR BIOLOGY
- G16B20/00—ICT specially adapted for functional genomics or proteomics, e.g. genotype-phenotype associations
-
- G—PHYSICS
- G16—INFORMATION AND COMMUNICATION TECHNOLOGY [ICT] SPECIALLY ADAPTED FOR SPECIFIC APPLICATION FIELDS
- G16B—BIOINFORMATICS, i.e. INFORMATION AND COMMUNICATION TECHNOLOGY [ICT] SPECIALLY ADAPTED FOR GENETIC OR PROTEIN-RELATED DATA PROCESSING IN COMPUTATIONAL MOLECULAR BIOLOGY
- G16B20/00—ICT specially adapted for functional genomics or proteomics, e.g. genotype-phenotype associations
- G16B20/30—Detection of binding sites or motifs
-
- G—PHYSICS
- G16—INFORMATION AND COMMUNICATION TECHNOLOGY [ICT] SPECIALLY ADAPTED FOR SPECIFIC APPLICATION FIELDS
- G16B—BIOINFORMATICS, i.e. INFORMATION AND COMMUNICATION TECHNOLOGY [ICT] SPECIALLY ADAPTED FOR GENETIC OR PROTEIN-RELATED DATA PROCESSING IN COMPUTATIONAL MOLECULAR BIOLOGY
- G16B25/00—ICT specially adapted for hybridisation; ICT specially adapted for gene or protein expression
- G16B25/10—Gene or protein expression profiling; Expression-ratio estimation or normalisation
-
- G—PHYSICS
- G16—INFORMATION AND COMMUNICATION TECHNOLOGY [ICT] SPECIALLY ADAPTED FOR SPECIFIC APPLICATION FIELDS
- G16B—BIOINFORMATICS, i.e. INFORMATION AND COMMUNICATION TECHNOLOGY [ICT] SPECIALLY ADAPTED FOR GENETIC OR PROTEIN-RELATED DATA PROCESSING IN COMPUTATIONAL MOLECULAR BIOLOGY
- G16B25/00—ICT specially adapted for hybridisation; ICT specially adapted for gene or protein expression
Definitions
- the present invention relates to regulation of a gene on the basis of, for example, expression data of the gene or concentration data of a protein with respect to the frame of space and time, and in particular to a method for predicting the structure of a binding site to which a gene regulator binds, as well as to an apparatus therefor.
- gene denotes an essential unit of heredity, and encompasses mRNA (messenger ribonucleic acid).
- Drosophila which is customarily used in molecular biological studies, is taken as an example.
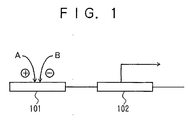
- Fig. 1 is a schematic illustration showing conventional transcriptional regulation of a gene.
- reference numeral 101 represents an enhancer for binding a protein and is located at an upstream region.
- the enhancer 101 functions as a promoter comprising a switch gene.
- Reference numeral 102 represents a coding region.
- Letters A and B represent proteins, and symbols + and - denote activation and repression, respectively.
- transcriptional regulation of a typical gene is generally expressed by an equation in which only the concentration of protein i is employed.
- an object of the present invention is to provide, through investigation of the internal structure of an enhancer or promoter and with an aim toward further clarification of transcriptional regulation of a gene, a method for predicting the structure of a binding site to which a gene regulator binds, as well as an apparatus therefor.
- the present invention provides the following:
- Fig. 2 is a block diagram relating to an apparatus for predicting the structure of a binding site of a gene to which a regulator binds according to an embodiment of the present invention.
- reference numeral 1 indicates an input unit; 2 a processing unit (CPU/memory); 3 a processing section for introducing a gene of interest, of which the user wishes to predict binding sites of regulators within an enhancer or promoter; 4 a processing section for constructing a calculation model in which loci of the binding sites of regulators within an enhancer or promoter are employed as parameters; 5 a processing section for calculating, on the basis of the constructed calculation model, the level of transcription; 6 a processing section for processing expression pattern data of the gene of interest; 7 a memory section for storing parameter search algorithms; 8 a calculation model parameter search processing section for searching, by use of parameter search algorithms, parameters usable in the calculation model so as to obtain an expression which is in agreement with empirically obtained expression of the aforementioned gene; 9 a processing section for predicting microstructures of an enhancer or promoter; and 10 an output unit.
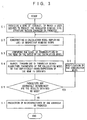
- Fig. 3 is a flow chart for predicting the binding site structure of a gene to which a regulator binds, and depicts an embodiment of the present invention, wherein
- binding sites when all the binding sites are not identified (with respect to the distance and dimension), they may be treated as unidentified binding sites.
- Fig. 4 is a schematic diagram showing exemplary transcriptional regulation of a gene according to the present invention.
- reference numeral 11 indicates an upstream-located enhancer, to which proteins A, B, and C are to be bound.
- the enhancer 11 functions as a promoter formed of a switch gene.
- the parameters which describe the enhancer ⁇ or promoter ⁇ 11 are loci (e.g., X-axis coordinates) of binding sites 12, 13, and 14 to which regulators bind, each site constituting a local structure of the enhancer.
- Reference numeral 15 indicates a coding region. Symbols + and - denote activation and repression, respectively.
- a characteristic feature of the present invention resides in that the binding site structure of a given gene (including mRNA) is predicted on the basis of expression data of the gene.
- the invention enables inference of genetic microstructures (i.e., partial structure or sequence of an enhancer or promoter).
- the method for predicting the structure of a binding site of a gene to which a regulator binds is generally described as follows.
- a regulatory region of a gene is constructed such that the position of a binding site is used as a variable.
- parameters are introduced and estimated; the parameter estimation must be effected so as to determine parameters capable of generating expression data which approximate given expression data.
- the parameter estimation may be performed by use of, for example, a genetic algorithm or an annealing method.
- the gene of interest is the second even-skipped gene (hereinafter referred to as eve2) of Drosophila, which gene relates to the formation of striped patterns.
- eve2 the second even-skipped gene
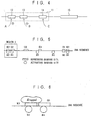
- Fig. 5 is a conceptual sketch for explaining an enhancer or promoter region of eve2 in relation to the exemplary case of the present invention.
- B1 through B5 are binding sites for a bicoid gene (hereinafter referred to as bcd), H3 for a hunchback gene (hereinafter referred to as hb), K3 through K5 for a Kruppel gene (hereinafter referred to as Kr), and G1 through G3 for a giant gene (hereinafter referred to as gt).
- the binding sites indicated by circles relate to activation, and those indicated by squares relate to repression.
- the enhancer or promoter activates or represses genetic transcription. Transcription of a gene is considered to be regulated through this mechanism.
- region A binding sites of a plurality of regulators are dense on the DNA sequence.
- Biological studies conducted in recent years have clarified that actual phenomena occurring within such a region A cannot be explained by simple reliance on the concentration of a regulator.
- binding and non-binding are determined not on the sole basis of the concentration of a regulator, but also on the basis of local competition in binding caused by high local density of the binding sites, which greatly affects binding and non binding.
- region A A case is considered in which firstly Kr is bound to K5, as shown in Fig. 6.
- region B5 and region K5 share a common sequence.
- one hypothesis is that, when binding occurs at either region, that region is entirely covered by the protein bound thereto, thereby nullifying the binding ability imparted to the binding site of the other region; i.e., the unbound region.
- K5 has been taken by Kr for binding thereto, and the sequence of B5 is "covered" by Kr and thus disabled.
- a binding site other than the binding site available to that specific protein may also be covered., Also in such a case, the thus-covered binding site is disabled.
- the other binding sites, B4, B5, and G3 are functionally disabled.
- all the activating binding sites present within the region A are hindered by Kr, and this explains why only repressing functions are exerted under such conditions. (Note that according to conventional theories which rely only on concentration, even under the above situation, if the concentration of bcd is high, activation-related function should occur, and this result does not agree with the actual situation.)
- the method of the present invention which takes into account not only concentration but also stochastic behavior at different points in time, enables determination of the level of transcription of the gene.
- the region A in Fig. 5 is enlarged in Fig. 7, where a certain point X is established on the DNA sequence.
- the distance as counted on the DNA sequence from the point X to the binding site is introduced as a parameter. It is also possible to simultaneously introduce, to each of the binding sites, the size of the binding site itself, binding affinity (or binding probability, dissociation probability, etc.) of the binding site, level of contribution to transcription occurring when a regulator is bound to the binding site, and other possible variables which may be considered attributes of the binding site.
- region A shown in Fig. 5 may be described as follows.
- the introduced binding sites are expressed by means of parameters.
- any type of enhancer structure or promoter structure can be adequately expressed.
- experimental data are employed as solutions (also sometimes called optimal values or theoretical values).
- solutions also sometimes called optimal values or theoretical values.
- experimental data are given as follows.
- a population consisting of a plurality (100, 1,000, or any other plural number) of solution candidates is generated.
- a solution set is introduced such that parameters are randomly distributed (see Fig. 9), or, for some reason, are converged to a local region of the entire solution space 21 (see Fig. 10).
- reference numeral 22 indicates a subspace in which solutions are conjectured to be present.
- values are changed to thereby provide a plurality of solution candidates.
- the created solution candidates contain a variety of values of variables, the candidates exhibit different transcription levels when tested under identical conditions. Thus, under certain common test environments, the transcription level is measured for each of the solution candidates.
- the appropriateness of the solution candidate can be assessed.
- the appropriateness is represented by a "fitness value," and in genetic algorithms, the fitness value represents the viability of the solution candidate. While solution candidates with excellent fitness values can retry transcription in a subsequent assessment, those with poor fitness values cannot.
- this is the process of artificial selection and natural selection.
- genetic algorithms after assessment of solution candidates, those with favorable traits are selected, and among the thus-selected candidates assessment is performed again.
- repetition of this process results in reduction in solution candidates, and therefore, replication is performed so as to make the number of candidates constant.
- solution candidates with poor assessment ratings are not selected; and solution candidates which are not selected in subsequent assessment steps are thus screened out.
- mutation and cross-over are effected. Specifically, when mutation occurs, a previous diffusion coefficient of 0.5, for example, is changed to 0.6 through a certain value determination method (in some cases randomly changed and in other cases changed through use of a method such as SA). Also, “cross-over” is referred to as a process of selecting a solution candidate A and solution candidate B, and portions of them are mutually exchanged.
- optimization performed as described above may provide optimal solutions as shown in Figs. 11, 12, or 13.
- a solution candidate provides a situation similar to that shown in region A in Fig. 5.
- another solution candidate may provide a similar situation with K5 and G3 being exchanged.
- yet another solution candidate may provide a situation in which the binding sites are located at discrete positions (loci).
- the present invention exerts the following effects.
- the present invention enables very prompt and low-cost prediction regarding the efficacy of the substance with respect to its action on the gene, or regarding local interaction of the substance with other substances.
- an enhancer or promoter since the internal structures of an enhancer or promoter are considered, transcriptional regulation of a gene can be more clearly elucidated.
- the microstructures of an enhancer or promoter can be predicted from the parameters searched as follows: at a region where binding sites are dense, the loci are present in the vicinity or the binding sites closely interact with one another; and at a region where binding sites are sparse, they act on the gene independently.
- the present invention may be implemented as follows: Firstly, computer-aided simulation is performed for prediction, and thereafter, suitable biological experiments are designed and carried out. This process alleviates labor, time, and costs, which have heretofore been a significant burden because of the conventional approaches being performed on a trial and error basis. Moreover, in the pharmaceutical or like industry, prediction of the side effects of a drug can be realized.
Landscapes
- Health & Medical Sciences (AREA)
- Life Sciences & Earth Sciences (AREA)
- Engineering & Computer Science (AREA)
- Physics & Mathematics (AREA)
- Bioinformatics & Cheminformatics (AREA)
- Genetics & Genomics (AREA)
- Biotechnology (AREA)
- Chemical & Material Sciences (AREA)
- Biophysics (AREA)
- Molecular Biology (AREA)
- Bioinformatics & Computational Biology (AREA)
- General Health & Medical Sciences (AREA)
- Theoretical Computer Science (AREA)
- Medical Informatics (AREA)
- Evolutionary Biology (AREA)
- Spectroscopy & Molecular Physics (AREA)
- Analytical Chemistry (AREA)
- Proteomics, Peptides & Aminoacids (AREA)
- General Engineering & Computer Science (AREA)
- Wood Science & Technology (AREA)
- Biomedical Technology (AREA)
- Organic Chemistry (AREA)
- Zoology (AREA)
- Crystallography & Structural Chemistry (AREA)
- Microbiology (AREA)
- Biochemistry (AREA)
- Plant Pathology (AREA)
- Preparation Of Compounds By Using Micro-Organisms (AREA)
Abstract
Description
- The present invention relates to regulation of a gene on the basis of, for example, expression data of the gene or concentration data of a protein with respect to the frame of space and time, and in particular to a method for predicting the structure of a binding site to which a gene regulator binds, as well as to an apparatus therefor.
- The term "gene" denotes an essential unit of heredity, and encompasses mRNA (messenger ribonucleic acid).
- Background art will first be described while Drosophila, which is customarily used in molecular biological studies, is taken as an example.
- In the first stage of development of Drosophila, at which point no cells have been formed, transcription products are spread by diffusion. Thus, the concentration of proteins that are present in the vicinity of a certain nucleus plays an important role in regulation of transcription. In simulation of this case, diffusion is calculated according to the following equation:
- However, in reality, binding affinity a must be considered, and therefore, P is expressed as follows.
- Thus, conventional approaches to understanding of transcriptional regulation of a gene have relied only on protein concentration.
- Fig. 1 is a schematic illustration showing conventional transcriptional regulation of a gene.
- In Fig. 1,
reference numeral 101 represents an enhancer for binding a protein and is located at an upstream region. Theenhancer 101 functions as a promoter comprising a switch gene.Reference numeral 102 represents a coding region. Letters A and B represent proteins, and symbols + and - denote activation and repression, respectively. - As described above, transcriptional regulation of a typical gene is generally expressed by an equation in which only the concentration of protein i is employed.
- However, it has now become clear that the transcriptional regulation of a gene depends not only on the above-mentioned protein concentrations but also on the sites where the proteins are actually bound. Thus, elucidation of the internal structure of an enhancer or promoter has now become a very important subject.
- In view of the foregoing, an object of the present invention is to provide, through investigation of the internal structure of an enhancer or promoter and with an aim toward further clarification of transcriptional regulation of a gene, a method for predicting the structure of a binding site to which a gene regulator binds, as well as an apparatus therefor.
- To attain the above object, the present invention provides the following:
- [1] A method for predicting the structure of a gene
regulator binding site, comprising:
- a step for providing a gene of interest, of which a user of the method desires to predict the regulation-related structure of a binding site to which a regulator binds, the binding site being present within an enhancer or promoter region to which a protein serving as a transcriptional element is bound and which is present upstream or downstream to a coding region of the gene;
- a step for constructing a calculation model for each of the binding sites within the enhancer or promoter region, the binding sites being such that relevant regulators or hypothetically introduced regulators are to be bound thereto, the calculation model employing, as parameters, loci of the regulator binding sites or other factors that cause expression of the gene;
- a step for computing the level of transcription of the gene with respect to the above-constructed calculation model;
- a step for searching, through use of parameter search algorithms, parameters of the calculation model so that empirically known expression of the gene is obtained; and
- a step for predicting microstructures of the enhancer or promoter.
- [2] The method for predicting the structure of a gene regulator binding site as described in [1], wherein said other factors that cause expression of the gene include temperature, molecular weight, diffusion coefficient, binding affinity, reaction rate, reverse reaction rate, and %transcription per occurrence of transcription.
- [3] The method for predicting the structure of a gene
regulator binding site as described in [1] or [2], wherein,
from the searched parameter sets, microstructures comprising
binding sites of the enhancer or promoter, some of the
binding sites interacting locally with one another, are
predicted as follows:
- at portions where binding sites are dense, the microstructures are physically close to one another for interaction therebetween, or they are physically remote from one another but interact with one another closely and functionally, and
- at portions where binding sites are sparse, the microstructures are physically remote from one another and yet functional, or they are functionally independent from one another.
- [4] Apparatus for predicting the structure of a gene
regulator binding site, comprising:
- means for providing a gene of interest, of which a user of the method desires to predict the binding site to which a regulator binds, the binding site being present within an enhancer or promoter region to which a protein is bound and which is present in an upstream or downstream region;
- means for constructing a calculation model which employs, as parameters, loci of the regulator binding sites within the enhancer or promoter region or other factors that cause expression of the gene;
- means for computing the transcription level of the gene with respect to the above-constructed calculation model;
- means for searching, through use of parameter search algorithms, parameters of the calculation model so that empirically known expression of the gene is obtained; and
- means for predicting microstructures of the enhancer or promoter.
- [5] The apparatus for predicting the structure of a gene regulator binding site as described in [4], wherein said other factors that cause expression of the gene include temperature, molecular weight, diffusion coefficient, binding affinity, reaction rate, reverse reaction rate, and %transcription per occurrence of transcription.
-
-
- Fig. 1 is a schematic illustration showing conventional transcriptional regulation of a gene.
- Fig. 2 is a block diagram in relation to an apparatus for predicting the structure of a gene regulator binding site according to an embodiment of the present invention.
- Fig. 3 is a flow chart for predicting the structure of a gene regulator binding site and depicting an embodiment of the present invention.
- Fig. 4 is a schematic diagram showing exemplary transcriptional regulation of a gene according to the present invention.
- Fig. 5 is a conceptual sketch for explaining an enhancer or promoter region of eve2 in relation to an example of the present invention.
- Fig. 6 is an enlarged view of the region A shown in Fig. 5.
- Fig. 7 shows model structures of binding sites.
- Fig. 8 is a graph showing the expression data of eve2.
- Fig. 9 is a conceptual illustration of a solution space and solution candidates (candidate solutions) when solution sets are created at random.
- Fig. 10 is a conceptual illustration of a solution space and solution candidates when solution sets are not created at random.
- Fig. 11 is an illustration showing a
solution 1. - Fig. 12 is an illustration showing a
solution 2. - Fig. 13 is an illustration showing a
solution 3. - Fig. 14 is an illustration showing the case where the binding sites are close to each other.
- Fig. 15 is an illustration showing the case where the binding sites are remote from each other.
-
- Modes for carrying out the present invention will next be described with reference to the accompanying drawings.
- Fig. 2 is a block diagram relating to an apparatus for predicting the structure of a binding site of a gene to which a regulator binds according to an embodiment of the present invention.
- In Fig. 2,
reference numeral 1 indicates an input unit; 2 a processing unit (CPU/memory); 3 a processing section for introducing a gene of interest, of which the user wishes to predict binding sites of regulators within an enhancer or promoter; 4 a processing section for constructing a calculation model in which loci of the binding sites of regulators within an enhancer or promoter are employed as parameters; 5 a processing section for calculating, on the basis of the constructed calculation model, the level of transcription; 6 a processing section for processing expression pattern data of the gene of interest; 7 a memory section for storing parameter search algorithms; 8 a calculation model parameter search processing section for searching, by use of parameter search algorithms, parameters usable in the calculation model so as to obtain an expression which is in agreement with empirically obtained expression of the aforementioned gene; 9 a processing section for predicting microstructures of an enhancer or promoter; and 10 an output unit. - Fig. 3 is a flow chart for predicting the binding site structure of a gene to which a regulator binds, and depicts an embodiment of the present invention, wherein
- (1) First, a gene of interest is provided. The gene is such that there the user of the invention desires to predict the structure of a regulator binding site which is present within an enhancer or promoter which binds a protein and which is present upstream or downstream with respect to a coding region of the gene (Step S1).
- (2) Next, a calculation model is constructed for each of the binding sites within the enhancer or promoter region, the binding sites being such that relevant regulators or hypothetically introduced regulators are to be bound thereto, the calculation model employing, as parameters, loci of the regulator binding sites (Step S2).
- (3) Subsequently, the level of transcription of the gene is computed with respect to the above-constructed calculation model (Step 3).
- (4) Then, through use of parameter search algorithms, parameters of the calculation model are searched so that empirically known expression of the gene is obtained (Step S4).
- (5) Regarding Step S4, checking is performed as to whether parameters cannot be appropriately determined, or whether the obtained results are not good (Step S5).
- (6) If the answer to the questions in Step S5 is YES, the constructed model is modified (Step S6).
- (7) If the answer to the questions in Step S5 is NO, microstructures of the enhancer or promoter are conjectured (Step S7). Briefly, the microstructures of an enhancer or promoter can be predicted from the parameters obtained by use of search algorithms as follows: at a region where binding sites are dense, the microstructures predictable are such that binding sites are present physically close to one another and closely interact one another, or alternatively they are physically apart from one another but they interact functionally closely one another; and at a region where binding sites are sparse, they act on the gene independently, or in other words, the binding sites exist physically remote from one another, or their actions are functionally independent from one another.
-
- In this connection, when all the regulators cannot be identified, unidentified regulators may be employed as parameters.
- In addition, when all the binding sites are not identified (with respect to the distance and dimension), they may be treated as unidentified binding sites.
- Hereafter, the method for predicting the structure of a gene regulator binding site will be described in detail.
- Fig. 4 is a schematic diagram showing exemplary transcriptional regulation of a gene according to the present invention.
- In Fig. 4,
reference numeral 11 indicates an upstream-located enhancer, to which proteins A, B, and C are to be bound. Theenhancer 11 functions as a promoter formed of a switch gene. Here, the parameters which describe the enhancer―or promoter―11 are loci (e.g., X-axis coordinates) ofbinding sites Reference numeral 15 indicates a coding region. Symbols + and - denote activation and repression, respectively. - As described above, a characteristic feature of the present invention resides in that the binding site structure of a given gene (including mRNA) is predicted on the basis of expression data of the gene. In other words, the invention enables inference of genetic microstructures (i.e., partial structure or sequence of an enhancer or promoter).
- The method for predicting the structure of a binding site of a gene to which a regulator binds is generally described as follows.
- A regulatory region of a gene is constructed such that the position of a binding site is used as a variable.
- For the initial population, parameters are introduced and estimated; the parameter estimation must be effected so as to determine parameters capable of generating expression data which approximate given expression data. The parameter estimation may be performed by use of, for example, a genetic algorithm or an annealing method.
- If the above step for parameter estimation reveals, for example, that some regulator binding sites are identified at loci which are close to one another, an inference derived therefrom is that the regulators are also close to one another and interact locally.
- On the other hand, if the binding sites are found to be present at loci which are remotely apart from one another, an inference derived therefrom is that the regulators independently and individually act on their respective binding sites.
- Hereafter, the method for predicting the structure of a binding site to which a gene regulator binds will be described in detail with reference to Fig. 4.
- (1) As shown in Fig. 4, local structures of an enhancer
or
promoter 11 are introduced (shown asregulator binding sites regulator binding sites - (2) Parameter optimization Through optimization of the location of the respective loci, there can be identified microstructures that cannot be functional unless they are close to―or conversely remote from―one another.
-
- To this end, the following procedures are used.
- 1) Providing a gene of interest, of which the user
desires to predict the structures (microstructures) within
the enhancer or
promoter 11. - 2) Constructing a calculation model for each of the
binding sites within the enhancer or
promoter 11, the binding sites being such that relevant regulators or hypothetically introduced regulators are to be bound thereto. In the calculation model, loci of the regulators are employed as parameters. - 3) Computing the level of transcription of the gene with respect to the above-constructed calculation model.
- 4) Using parameter search algorithms such as GA (genetic algorithm) and SA (simulated annealing), to search parameters of the calculation model so as to obtain empirically known expression of the gene provided in step 1).
- 5) From the resultant parameter sets, the following
are inferred:
- (i) At portions where binding sites are dense, microstructures are physically close to one another, or if they are physically remote from one another, they interact with one another closely and functionally.
- (ii) At portions where binding sites are sparse, microstructures are physically remote from one another, or if they are physically close to one another, they are functionally independent from one another.
-
- Next, the method for predicting the structure of a binding site to which a gene regulator binds will be described in more detail.
- For illustration purposes, the following description is specifically directed to the case where the gene of interest is the second even-skipped gene (hereinafter referred to as eve2) of Drosophila, which gene relates to the formation of striped patterns.
- Fig. 5 is a conceptual sketch for explaining an enhancer or promoter region of eve2 in relation to the exemplary case of the present invention.
- In Fig. 5, B1 through B5 are binding sites for a bicoid gene (hereinafter referred to as bcd), H3 for a hunchback gene (hereinafter referred to as hb), K3 through K5 for a Kruppel gene (hereinafter referred to as Kr), and G1 through G3 for a giant gene (hereinafter referred to as gt). The binding sites indicated by circles relate to activation, and those indicated by squares relate to repression. When certain proteins called regulators bind to these binding sites, the enhancer or promoter activates or represses genetic transcription. Transcription of a gene is considered to be regulated through this mechanism.
- As described above, according to most conventional theories, transcriptional regulation of a gene is elucidated through determinism on the basis of concentrations of the respective regulators concerned. For example, in the case of a model which depends on concentration alone, the probability of a transcription of a gene occurring is expressed by the following equation (1).
- Now, in Fig. 5, attention is invited particularly to the area surrounded by broken lines (region A). Within this region, binding sites of a plurality of regulators are dense on the DNA sequence. Biological studies conducted in recent years have clarified that actual phenomena occurring within such a region A cannot be explained by simple reliance on the concentration of a regulator. In other words, within such a region A, binding and non-binding (which leads to transcriptional regulation of a gene) are determined not on the sole basis of the concentration of a regulator, but also on the basis of local competition in binding caused by high local density of the binding sites, which greatly affects binding and non binding.
- Now, attention is focused on region A, and the phenomenon occurring in region A is described with reference to Fig. 6. A case is considered in which firstly Kr is bound to K5, as shown in Fig. 6. Originally, region B5 and region K5 share a common sequence. Under such conditions, one hypothesis is that, when binding occurs at either region, that region is entirely covered by the protein bound thereto, thereby nullifying the binding ability imparted to the binding site of the other region; i.e., the unbound region. Specifically, in the case shown in Fig. 6, K5 has been taken by Kr for binding thereto, and the sequence of B5 is "covered" by Kr and thus disabled. Similarly, even when a common sequence is not shared by two or more binding sites, depending on the size of a protein, a binding site other than the binding site available to that specific protein may also be covered., Also in such a case, the thus-covered binding site is disabled. In the particular case shown in Fig. 6, due to the binding of Kr having occurred, in effect, the other binding sites, B4, B5, and G3, are functionally disabled. As a result, all the activating binding sites present within the region A are hindered by Kr, and this explains why only repressing functions are exerted under such conditions. (Note that according to conventional theories which rely only on concentration, even under the above situation, if the concentration of bcd is high, activation-related function should occur, and this result does not agree with the actual situation.)
- Thus, unlike the conventional approach in which concentration alone is used for describing a phenomenon as mentioned above, the method of the present invention, which takes into account not only concentration but also stochastic behavior at different points in time, enables determination of the level of transcription of the gene.
- In connection with the aforementioned regulators of eve2, let us assume that the following are known: activating regulators are bcd and hb, and repressing regulators are Kr and gt (or that some of the regulators are unknown and hypothetical introduction thereof is permitted). Under such conditions and in the case where the structure of an enhancer or promoter of eve2 is unknown, or where presence of functional competition/non-competition is unknown, local structures of the regulators can be predicted by performing the below-described steps.
- The region A in Fig. 5 is enlarged in Fig. 7, where a certain point X is established on the DNA sequence. The distance as counted on the DNA sequence from the point X to the binding site is introduced as a parameter. It is also possible to simultaneously introduce, to each of the binding sites, the size of the binding site itself, binding affinity (or binding probability, dissociation probability, etc.) of the binding site, level of contribution to transcription occurring when a regulator is bound to the binding site, and other possible variables which may be considered attributes of the binding site.
- Specifically, the region A shown in Fig. 5 may be described as follows.

- Thus, the introduced binding sites are expressed by means of parameters. By changing the number of binding sites or values of these parameters, generally speaking, any type of enhancer structure or promoter structure can be adequately expressed.
- During the below-described "parameter search" procedure, experimental data are employed as solutions (also sometimes called optimal values or theoretical values). In the case of the present model, the experimental data are given as follows.

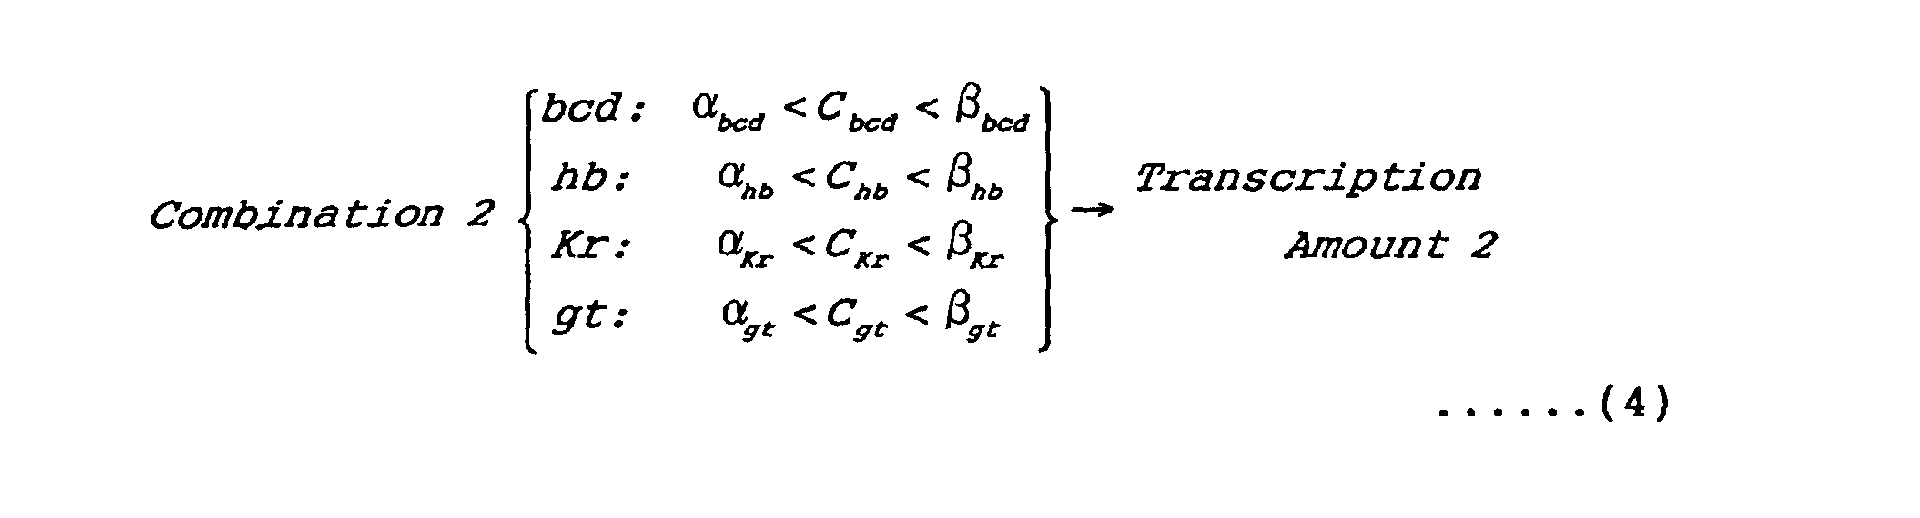
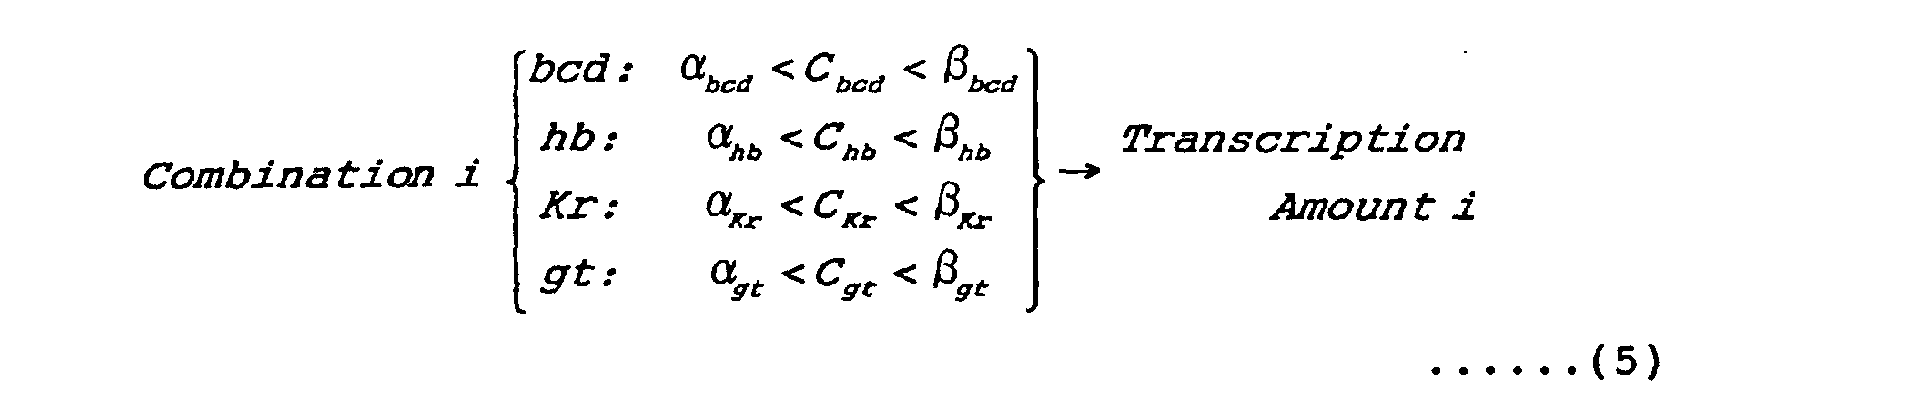
- Briefly, experimental data as to the transcription level of a gene are given in the form of combinations of regulator concentrations as described above. In reality, graphs as shown in Fig. 8 have already become readily available through experiments, and the profiles of the graphs are mathematically expressed by combinations as described above.
- When transcription of the enhancer or promoter expressed as described above is simulated, due to the presence of parameters whose values are not completely determined, the results of simulation may differ from those obtained through experiments. In such a case, through optimization of parameters by use of any appropriate means, parameters for the binding sites that had remained undetermined can be specifically determined.
- Next will be described an example drawn to a case in which GA is employed as a parameter search algorithm which automatically determines parameters of a binding site by use of a computer.
- First, a population consisting of a plurality (100, 1,000, or any other plural number) of solution candidates is generated. A solution set is introduced such that parameters are randomly distributed (see Fig. 9), or, for some reason, are converged to a local region of the entire solution space 21 (see Fig. 10). In Fig. 10,
reference numeral 22 indicates a subspace in which solutions are conjectured to be present. For example, there may be a solution candidate having a distribution coefficient of 0, or another solution candidate having a distribution coefficient of 1.0. Similarly, there may be a solution candidate having a binding affinity of 0, or another solution candidate having a binding affinity of 0.01. Moreover, regarding the variables such as loci and other items, which have been introduced to the model and are now targets of search, values are changed to thereby provide a plurality of solution candidates.

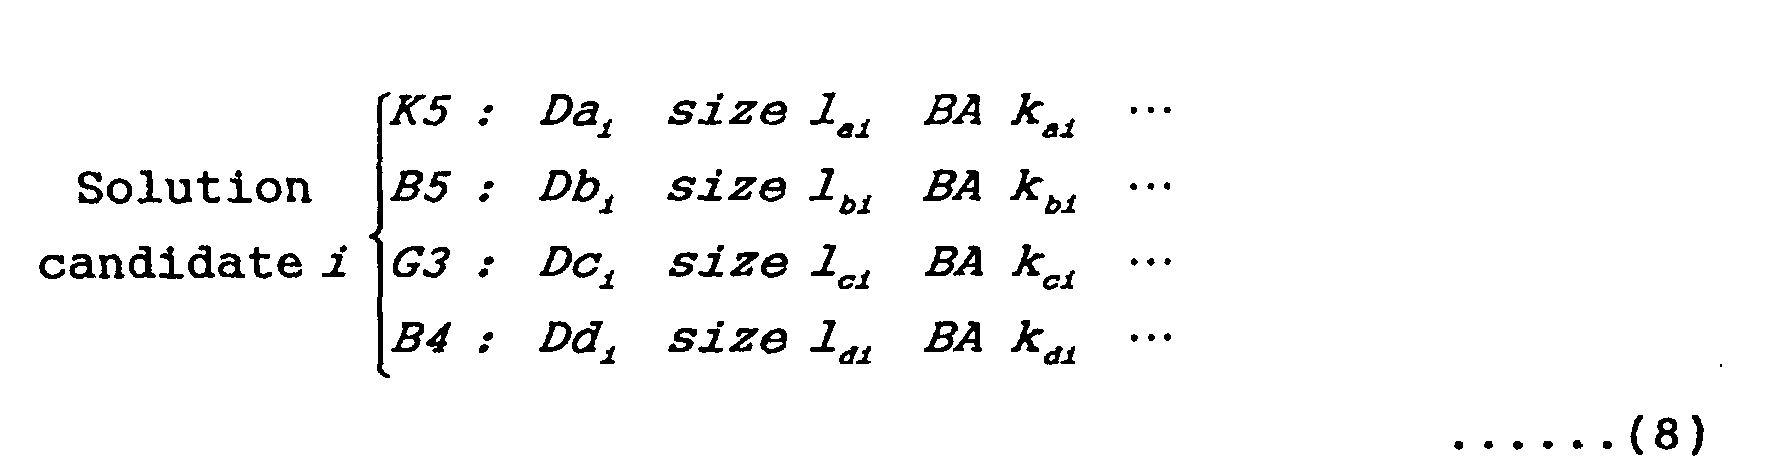
- The above exemplifies actual solution candidates. Each of these solution candidates describes one enhancer or promoter. Therefore, it will be understood that solution candidates of different parameter values provide different transcription levels.
- Since the created solution candidates contain a variety of values of variables, the candidates exhibit different transcription levels when tested under identical conditions. Thus, under certain common test environments, the transcription level is measured for each of the solution candidates.
- In this step, there are solution candidates which, under a specific test environment, fit― or do not fit―experimental values.
- Assuming that under a certain test environment we have information about the transcription level of the gene being handled, the transcription level simulated under the same test environment is compared with the experimentally obtained value. For example, when the transcription level of a gene X is empirically found to be T at a concentration of a regulator A of CA, comparison is performed at a fixed concentration CA of the regulator A by simulating the transcription level of the gene X and determining the difference between T and the value from the simulation. In simple cases, differences are often represented by absolute values of subtraction (but not necessarily always).
- In this case, the smaller the value of Δ, the more approximate the simulation to the experimental results. Thus, it can be decided that the solution candidate which can generate a transcription level more approximate to the experimental result is superior to other solution candidates, in order to obtain a transcription level similar to that obtained by experiments.
- Through comparison with experimental data, the appropriateness of the solution candidate can be assessed. The appropriateness is represented by a "fitness value," and in genetic algorithms, the fitness value represents the viability of the solution candidate. While solution candidates with excellent fitness values can retry transcription in a subsequent assessment, those with poor fitness values cannot.
- In fact, this is the process of artificial selection and natural selection. According to genetic algorithms, after assessment of solution candidates, those with favorable traits are selected, and among the thus-selected candidates assessment is performed again. However, repetition of this process results in reduction in solution candidates, and therefore, replication is performed so as to make the number of candidates constant. Through this process, solution candidates with poor assessment ratings are not selected; and solution candidates which are not selected in subsequent assessment steps are thus screened out.
- In genetic manipulations, mutation and cross-over are effected. Specifically, when mutation occurs, a previous diffusion coefficient of 0.5, for example, is changed to 0.6 through a certain value determination method (in some cases randomly changed and in other cases changed through use of a method such as SA). Also, "cross-over" is referred to as a process of selecting a solution candidate A and solution candidate B, and portions of them are mutually exchanged.
- Thus through repetition of assessment of fitness values and artificial selection/natural selection/genetic manipulation, the entirety of the solution candidates are gradually refined.
- With certain minor errors being ignored, there can be obtained a solution candidate group which has been optimized―or semi-optimized―through an optimization algorithm (note: in the case of optimization being imperfect, the situation may be referred to as "semi-optimized"). From the solution candidate members of the group, actual enhancer or promoter structures can be predicted.
- The solutions can be expressed as follows:wherein D = distance, and BA = binding affinity.

- Taking the region A in Fig. 5 as an example, optimization performed as described above may provide optimal solutions as shown in Figs. 11, 12, or 13.
- That is, in the case of Fig. 11, a solution candidate provides a situation similar to that shown in region A in Fig. 5.
- Alternatively, as in the case of Fig. 12, another solution candidate may provide a similar situation with K5 and G3 being exchanged.
- In the case of Fig. 13, yet another solution candidate may provide a situation in which the binding sites are located at discrete positions (loci).
- Thus, some converged solution candidates can be obtained.
- With respect to these solutions, there can be obtained specific values for the enhancer or promoter structures which are desirable for yielding the results mimicking those obtained through experiments. As a result, the following can be detected, speculated upon, or concluded.
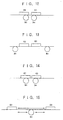
- (a) In the case where binding sites are densely located,
as shown in Fig. 14, since the binding sites are close to
each other, these binding sites interact locally during
transcription of a gene.
- i. There exists a requirement that they must be close to each other as physical loci.
- ii. As physical loci they may be remote from each other, but due to their close mutual interaction in terms of function, the solutions are close to each other.
- (b) In the case where binding sites are sparsely
located, as shown in Fig. 15, since the binding sites are
present remote from each other, they independently act on
genes during transcription thereof.
- i. There exists a requirement that they must be present remote from each other as physical loci.
- ii. As physical loci they may be close to each other, but due to their independent functionality, the solutions as obtained result.
-
- Thus, without any information about the structure of an enhancer or promoter, through simultaneous optimization of values related to binding affinity, reaction rate, reverse reaction rate, etc. of the binding sites, and the situation of interaction of the binding sites contained in the enhancer or promoter, it is possible to know, before actual values are in hand, values which are likely to be found in experiments.
- Being constituted as described above, the present invention exerts the following effects.
- In the manufacture of chemical substances or pharmaceuticals where the influence of a certain substance on a gene is desired to be investigated in order to know, for example, whether the substance activates or represses the gene, let us assume that the efficacy of the substance acting on the gene is unknown due to the structure of enhancer or promoter of the gene being not completely known. Or alternatively, let us assume that, although speculation is that transcription of the gene is effected under competition between that particular substance and other substances, this speculation has not yet been verified.
- Under such circumstances, the present invention enables very prompt and low-cost prediction regarding the efficacy of the substance with respect to its action on the gene, or regarding local interaction of the substance with other substances.
- Conventional methods involve drawbacks in that thorough checking of the sequence of target enhancer or promoter structure is required, and the action of unknown substances cannot be taken into account at all.
- However, according to the present invention, since the internal structures of an enhancer or promoter are considered, transcriptional regulation of a gene can be more clearly elucidated. The microstructures of an enhancer or promoter can be predicted from the parameters searched as follows: at a region where binding sites are dense, the loci are present in the vicinity or the binding sites closely interact with one another; and at a region where binding sites are sparse, they act on the gene independently.
- Therefore, in cases as described above, the present invention may be implemented as follows: Firstly, computer-aided simulation is performed for prediction, and thereafter, suitable biological experiments are designed and carried out. This process alleviates labor, time, and costs, which have heretofore been a significant burden because of the conventional approaches being performed on a trial and error basis. Moreover, in the pharmaceutical or like industry, prediction of the side effects of a drug can be realized.
- The present invention is not limited to the above-described embodiments. Numerous modifications and variations of the present invention are possible in light of the spirit of the present invention, and they are not excluded from the scope of the present invention.
- As described hereinabove in detail, according to the present invention, the following effects are obtained.
- (A) Through investigation of the internal structure of an enhancer or promoter, transcriptional regulation of a gene can be more definitely elucidated.
- (B) From the parameter set obtained through searching, the microstructures of the enhancer or promoter are predicted such that, in a region where binding sites are dense, the binding sites constitute local microstructures, and in a region where binding sites are sparse, they act on the gene independently.
- (C) Thus, in the manufacture of chemical substances or pharmaceuticals, experiments which have conventionally been performed on a trial and error basis, requiring long periods of time, can be performed promptly and accurately.
-
- According to the present invention, experiments with respect to regulation of a gene, which have conventionally been performed on a trial and error basis requiring long periods of time can be performed promptly and accurately, and thus the invention is useful in the manufacture of chemical substances and pharmaceuticals.
Claims (5)
- A method for predicting the structure of a gene regulator binding site, comprising:(a) a step for providing a gene of interest, of which a user of the method desires to predict the regulation-related structure of a binding site to which a regulator binds, the binding site being present within an enhancer or promoter region to which a protein serving as a transcriptional element is bound and which is present upstream or downstream to a coding region of the gene;(b) a step for constructing a calculation model for each of the binding sites within the enhancer or promoter region, the binding sites being such that relevant regulators or hypothetically introduced regulators are to be bound thereto, the calculation model employing, as parameters, loci of the regulator binding sites or other factors that cause expression of the gene;(c) a step for computing the level of transcription of the gene with respect to the above-constructed calculation model;(d) a step for searching, through use of parameter search algorithms, parameters of the calculation model so that empirically known expression of the gene is obtained; and(e) a step for predicting microstructures of the enhancer or promoter.
- The method for predicting the structure of a gene regulator binding site as described in claim 1, wherein said other factors that cause expression of the gene include temperature, molecular weight, diffusion coefficient, binding affinity, reaction rate, reverse reaction rate, and %transcription per occurrence of transcription.
- The method for predicting the structure of a gene regulator binding site as described in claim 1 or 2, wherein, from the searched parameter sets, microstructures comprising binding sites of the enhancer or promoter, some of the binding sites interacting locally with one another, are predicted as follows:at portions where binding sites are dense, the microstructures are physically close to one another for interaction therebetween, or they are physically remote from one another but interact with one another closely and functionally, andat portions where binding sites are sparse, the microstructures are physically remote from one another and yet functional, or they are functionally independent from one another.
- Apparatus for predicting the structure of a gene regulator binding site, comprising:(a) means for providing a gene of interest, of which a user of the method desires to predict the binding site to which a regulator binds, the binding site being present within an enhancer or promoter region to which a protein is bound and which is present in an upstream or downstream region;(b) means for constructing a calculation model which employs, as parameters, loci of the regulator binding sites within the enhancer or promoter region or other factors that cause expression of the gene;(c) means for computing the transcription level of the gene with respect to the above-constructed calculation model;(d) means for searching, through use of parameter search algorithms, parameters of the calculation model so that empirically known expression of the gene is obtained; and(e) means for predicting microstructures of the enhancer or promoter.
- The apparatus for predicting the structure of a gene regulator binding site as described in claim 4, wherein said other factors that cause expression of the gene include temperature, molecular weight, diffusion coefficient, binding affinity, reaction rate, reverse reaction rate, and %transcription per occurrence of transcription.
Applications Claiming Priority (3)
| Application Number | Priority Date | Filing Date | Title |
|---|---|---|---|
| JP11160672A JP2000342257A (en) | 1999-06-08 | 1999-06-08 | Method and apparatus for estimating binding site structure of regulatory factor of gene |
| JP16067299 | 1999-06-08 | ||
| PCT/JP2000/003697 WO2000075301A1 (en) | 1999-06-08 | 2000-06-07 | Method for predicting binding site structure of gene regulator and apparatus therefor |
Publications (2)
| Publication Number | Publication Date |
|---|---|
| EP1184455A1 true EP1184455A1 (en) | 2002-03-06 |
| EP1184455A4 EP1184455A4 (en) | 2002-12-04 |
Family
ID=15719995
Family Applications (1)
| Application Number | Title | Priority Date | Filing Date |
|---|---|---|---|
| EP00935572A Withdrawn EP1184455A4 (en) | 1999-06-08 | 2000-06-07 | METHOD FOR PREDICTING A LINK SITE STRUCTURE OF A GENE REGULATOR AND DEVICE THEREFOR |
Country Status (3)
| Country | Link |
|---|---|
| EP (1) | EP1184455A4 (en) |
| JP (1) | JP2000342257A (en) |
| WO (1) | WO2000075301A1 (en) |
Cited By (2)
| Publication number | Priority date | Publication date | Assignee | Title |
|---|---|---|---|---|
| CN1317676C (en) * | 2003-02-19 | 2007-05-23 | 株式会社东芝 | Optimal operation control device for wide area equipment |
| CN103955628A (en) * | 2014-04-22 | 2014-07-30 | 南京理工大学 | Subspace fusion-based protein-vitamin binding location point predicting method |
Family Cites Families (4)
| Publication number | Priority date | Publication date | Assignee | Title |
|---|---|---|---|---|
| JPH06261755A (en) * | 1993-03-11 | 1994-09-20 | Toshiba Corp | Gene analysis |
| GB2283840B (en) * | 1993-11-12 | 1998-07-22 | Fujitsu Ltd | Genetic motif extracting method and apparatus |
| JP2000057124A (en) * | 1998-08-14 | 2000-02-25 | Nec Corp | Combination optimizing method and combination optimization system |
| JP4040764B2 (en) * | 1998-08-19 | 2008-01-30 | 富士通株式会社 | Gene motif extraction processing apparatus, gene motif extraction processing method, and recording medium storing gene motif extraction processing program |
-
1999
- 1999-06-08 JP JP11160672A patent/JP2000342257A/en active Pending
-
2000
- 2000-06-07 WO PCT/JP2000/003697 patent/WO2000075301A1/en not_active Ceased
- 2000-06-07 EP EP00935572A patent/EP1184455A4/en not_active Withdrawn
Non-Patent Citations (5)
| Title |
|---|
| HEINEMEYER T ET AL: "Databases on transcriptional regulation: TRANSFAC, TRRD and COMPEL." NUCLEIC ACIDS RESEARCH, vol. 26, no. 1, 1 January 1998 (1998-01-01), pages 362-367, XP002215784 ISSN: 0305-1048 * |
| KOLCHANOV N A ET AL: "GeneExpress: a computer system for description, analysis, and recognition of regulatory sequences in eukaryotic genome." PROCEEDINGS /... INTERNATIONAL CONFERENCE ON INTELLIGENT SYSTEMS FOR MOLECULAR BIOLOGY;ISMB. INTERNATIONAL CONFERENCE ON INTELLIGENT SYSTEMS FOR MOLECULAR BIOLOGY. UNITED STATES 1998, vol. 6, 1998, pages 95-104, XP001106120 * |
| KOLCHANOV N A ET AL: "Integrated databases and computer systems for studying eukaryotic gene expression." BIOINFORMATICS (OXFORD), vol. 15, no. 7-8, July 1999 (1999-07), pages 669-686, XP002215783 ISSN: 1367-4803 * |
| QUANDT K ET AL: "MatInd and MatInspector: new fast and versatile tools for detection of consensus matches in nucleotide sequence data" NUCLEIC ACIDS RESEARCH, OXFORD UNIVERSITY PRESS, SURREY, GB, vol. 23, no. 23, 1995, pages 4878-4884, XP002081231 ISSN: 0305-1048 * |
| See also references of WO0075301A1 * |
Cited By (3)
| Publication number | Priority date | Publication date | Assignee | Title |
|---|---|---|---|---|
| CN1317676C (en) * | 2003-02-19 | 2007-05-23 | 株式会社东芝 | Optimal operation control device for wide area equipment |
| CN103955628A (en) * | 2014-04-22 | 2014-07-30 | 南京理工大学 | Subspace fusion-based protein-vitamin binding location point predicting method |
| CN103955628B (en) * | 2014-04-22 | 2017-03-01 | 南京理工大学 | The protein vitamin binding site estimation method being merged based on subspace |
Also Published As
| Publication number | Publication date |
|---|---|
| JP2000342257A (en) | 2000-12-12 |
| WO2000075301A1 (en) | 2000-12-14 |
| EP1184455A4 (en) | 2002-12-04 |
Similar Documents
| Publication | Publication Date | Title |
|---|---|---|
| US11887696B2 (en) | Systems and methods for classifying, prioritizing and interpreting genetic variants and therapies using a deep neural network | |
| Lai et al. | On the importance of cotranscriptional RNA structure formation | |
| Ji et al. | A graph theoretical approach for predicting common RNA secondary structure motifs including pseudoknots in unaligned sequences | |
| Sasse et al. | Motif models for RNA-binding proteins | |
| WO2008044242A2 (en) | Gene expression analysis using genotype-pheontype based programming | |
| Si et al. | An optimal test with maximum average power while controlling FDR with application to RNA‐seq data | |
| Ben-Dor et al. | On constructing radiation hybrid maps | |
| Peterson et al. | Simulated evolution of protein-protein interaction networks with realistic topology | |
| Pompei et al. | A fitness trade-off explains the early fate of yeast aneuploids with chromosome gains | |
| Scott et al. | Power series method for solving TASEP-based models of mRNA translation | |
| Gebert et al. | Genetic networks and anticipation of gene expression patterns | |
| Nghe et al. | Predicting evolution using regulatory architecture | |
| Vologodskii et al. | Simulation of DNA catenanes | |
| Kang et al. | mirTime: identifying condition-specific targets of microRNA in time-series transcript data using Gaussian process model and spherical vector clustering | |
| Vant‐Hull et al. | Theoretical principles of in vitro selection using combinatorial nucleic acid libraries | |
| Kang et al. | A dynamical model reveals gene co-localizations in nucleus | |
| CN116612821B (en) | Method for establishing prediction model of potential biological target point of chemical and prediction method | |
| Dilão et al. | Validation of a morphogenesis model of Drosophila early development by a multi-objective evolutionary optimization algorithm | |
| Hunt et al. | A forecasting approach to accelerate drug development | |
| Kinghorn et al. | Selective phenome growth adapted NK model: a novel landscape to represent aptamer ligand binding | |
| Pánek et al. | A systematic computational analysis of the rRNA–3′ UTR sequence complementarity suggests a regulatory mechanism influencing post-termination events in metazoan translation | |
| Galimzyanov et al. | An Investigation of the Structural Stability of Drosophila Control Gene Subnetwork in Computer Experiments | |
| Chang et al. | Identification of transcription factor binding sites using GA and PSO | |
| Khan et al. | Comparing Random and Natural RNA Boltzmann Ensembles | |
| CN120783863A (en) | Training method of nucleic acid aptamer generation model and generation method of nucleic acid aptamer |
Legal Events
| Date | Code | Title | Description |
|---|---|---|---|
| PUAI | Public reference made under article 153(3) epc to a published international application that has entered the european phase |
Free format text: ORIGINAL CODE: 0009012 |
|
| 17P | Request for examination filed |
Effective date: 20011213 |
|
| AK | Designated contracting states |
Kind code of ref document: A1 Designated state(s): AT BE CH CY DE DK ES FI FR GB GR IE IT LI LU MC NL PT SE |
|
| A4 | Supplementary search report drawn up and despatched |
Effective date: 20021022 |
|
| AK | Designated contracting states |
Kind code of ref document: A4 Designated state(s): CH DE ES FR GB IT LI |
|
| RBV | Designated contracting states (corrected) |
Designated state(s): CH DE ES FR GB IT LI |
|
| RAP1 | Party data changed (applicant data changed or rights of an application transferred) |
Owner name: JAPAN SCIENCE AND TECHNOLOGY AGENCY |
|
| RAP1 | Party data changed (applicant data changed or rights of an application transferred) |
Owner name: JAPAN SCIENCE AND TECHNOLOGY AGENCY |
|
| 17Q | First examination report despatched |
Effective date: 20050428 |
|
| STAA | Information on the status of an ep patent application or granted ep patent |
Free format text: STATUS: THE APPLICATION IS DEEMED TO BE WITHDRAWN |
|
| 18D | Application deemed to be withdrawn |
Effective date: 20050909 |