EP1174706A2 - Rapid high throughput spectrometer and method - Google Patents
Rapid high throughput spectrometer and method Download PDFInfo
- Publication number
- EP1174706A2 EP1174706A2 EP01306195A EP01306195A EP1174706A2 EP 1174706 A2 EP1174706 A2 EP 1174706A2 EP 01306195 A EP01306195 A EP 01306195A EP 01306195 A EP01306195 A EP 01306195A EP 1174706 A2 EP1174706 A2 EP 1174706A2
- Authority
- EP
- European Patent Office
- Prior art keywords
- fluorescence
- light beam
- light
- spectrometer
- photon
- Prior art date
- Legal status (The legal status is an assumption and is not a legal conclusion. Google has not performed a legal analysis and makes no representation as to the accuracy of the status listed.)
- Withdrawn
Links
- 238000000034 method Methods 0.000 title claims abstract description 65
- 230000008569 process Effects 0.000 claims abstract description 19
- 238000005192 partition Methods 0.000 claims abstract description 12
- 238000012360 testing method Methods 0.000 claims abstract description 5
- 238000004458 analytical method Methods 0.000 claims description 35
- 238000002060 fluorescence correlation spectroscopy Methods 0.000 claims description 29
- 238000004422 calculation algorithm Methods 0.000 claims description 22
- 238000005259 measurement Methods 0.000 claims description 18
- 238000012545 processing Methods 0.000 claims description 6
- 230000001678 irradiating effect Effects 0.000 claims description 3
- 238000012958 reprocessing Methods 0.000 claims 1
- 238000013480 data collection Methods 0.000 abstract 1
- 238000009826 distribution Methods 0.000 description 74
- 239000002245 particle Substances 0.000 description 66
- 230000006870 function Effects 0.000 description 49
- 241000894007 species Species 0.000 description 41
- 239000000523 sample Substances 0.000 description 37
- 230000005284 excitation Effects 0.000 description 27
- 238000005311 autocorrelation function Methods 0.000 description 17
- 238000001514 detection method Methods 0.000 description 14
- 238000002474 experimental method Methods 0.000 description 14
- 238000013537 high throughput screening Methods 0.000 description 13
- 238000009792 diffusion process Methods 0.000 description 12
- 238000013459 approach Methods 0.000 description 10
- 238000005070 sampling Methods 0.000 description 9
- 150000001875 compounds Chemical class 0.000 description 7
- 238000005314 correlation function Methods 0.000 description 7
- 239000000975 dye Substances 0.000 description 7
- 239000000203 mixture Substances 0.000 description 7
- 230000035945 sensitivity Effects 0.000 description 7
- 244000144725 Amygdalus communis Species 0.000 description 6
- 230000000694 effects Effects 0.000 description 6
- 230000008901 benefit Effects 0.000 description 5
- 230000002123 temporal effect Effects 0.000 description 5
- 230000008859 change Effects 0.000 description 4
- 238000007405 data analysis Methods 0.000 description 4
- 238000013461 design Methods 0.000 description 4
- 230000005855 radiation Effects 0.000 description 4
- 238000012216 screening Methods 0.000 description 4
- 241000894006 Bacteria Species 0.000 description 3
- 238000010521 absorption reaction Methods 0.000 description 3
- 230000007423 decrease Effects 0.000 description 3
- GNBHRKFJIUUOQI-UHFFFAOYSA-N fluorescein Chemical compound O1C(=O)C2=CC=CC=C2C21C1=CC=C(O)C=C1OC1=CC(O)=CC=C21 GNBHRKFJIUUOQI-UHFFFAOYSA-N 0.000 description 3
- 238000000475 fluorescence cross-correlation spectroscopy Methods 0.000 description 3
- 238000001506 fluorescence spectroscopy Methods 0.000 description 3
- 238000006862 quantum yield reaction Methods 0.000 description 3
- 230000004044 response Effects 0.000 description 3
- IJGRMHOSHXDMSA-UHFFFAOYSA-N Atomic nitrogen Chemical compound N#N IJGRMHOSHXDMSA-UHFFFAOYSA-N 0.000 description 2
- 230000005653 Brownian motion process Effects 0.000 description 2
- 241000700605 Viruses Species 0.000 description 2
- 230000002776 aggregation Effects 0.000 description 2
- 238000004220 aggregation Methods 0.000 description 2
- 238000005537 brownian motion Methods 0.000 description 2
- 210000004027 cell Anatomy 0.000 description 2
- 238000006243 chemical reaction Methods 0.000 description 2
- 238000011109 contamination Methods 0.000 description 2
- 239000000539 dimer Substances 0.000 description 2
- 229940079593 drug Drugs 0.000 description 2
- 239000003814 drug Substances 0.000 description 2
- 230000009977 dual effect Effects 0.000 description 2
- 238000000695 excitation spectrum Methods 0.000 description 2
- 239000012535 impurity Substances 0.000 description 2
- 230000010354 integration Effects 0.000 description 2
- 230000003993 interaction Effects 0.000 description 2
- 229920002521 macromolecule Polymers 0.000 description 2
- 230000007246 mechanism Effects 0.000 description 2
- 238000000386 microscopy Methods 0.000 description 2
- 239000000178 monomer Substances 0.000 description 2
- 229910052757 nitrogen Inorganic materials 0.000 description 2
- 230000010287 polarization Effects 0.000 description 2
- 238000012552 review Methods 0.000 description 2
- 238000000926 separation method Methods 0.000 description 2
- 239000000126 substance Substances 0.000 description 2
- 230000009897 systematic effect Effects 0.000 description 2
- 230000036962 time dependent Effects 0.000 description 2
- 101710195183 Alpha-bungarotoxin Proteins 0.000 description 1
- 238000012935 Averaging Methods 0.000 description 1
- 108010009685 Cholinergic Receptors Proteins 0.000 description 1
- YZCKVEUIGOORGS-OUBTZVSYSA-N Deuterium Chemical compound [2H] YZCKVEUIGOORGS-OUBTZVSYSA-N 0.000 description 1
- 102000004190 Enzymes Human genes 0.000 description 1
- 108090000790 Enzymes Proteins 0.000 description 1
- 241000053208 Porcellio laevis Species 0.000 description 1
- 241000251733 Tetronarce californica Species 0.000 description 1
- 102000034337 acetylcholine receptors Human genes 0.000 description 1
- 238000013019 agitation Methods 0.000 description 1
- 238000003556 assay Methods 0.000 description 1
- 239000005441 aurora Substances 0.000 description 1
- 239000011324 bead Substances 0.000 description 1
- 229920001222 biopolymer Polymers 0.000 description 1
- 238000004061 bleaching Methods 0.000 description 1
- UIZLQMLDSWKZGC-UHFFFAOYSA-N cadmium helium Chemical compound [He].[Cd] UIZLQMLDSWKZGC-UHFFFAOYSA-N 0.000 description 1
- 238000004364 calculation method Methods 0.000 description 1
- 230000000295 complement effect Effects 0.000 description 1
- 239000004020 conductor Substances 0.000 description 1
- 239000000356 contaminant Substances 0.000 description 1
- 238000005100 correlation spectroscopy Methods 0.000 description 1
- 238000012864 cross contamination Methods 0.000 description 1
- 210000000805 cytoplasm Anatomy 0.000 description 1
- 229910052805 deuterium Inorganic materials 0.000 description 1
- 238000005315 distribution function Methods 0.000 description 1
- 230000005611 electricity Effects 0.000 description 1
- 238000000295 emission spectrum Methods 0.000 description 1
- 238000011156 evaluation Methods 0.000 description 1
- 230000002349 favourable effect Effects 0.000 description 1
- 239000000835 fiber Substances 0.000 description 1
- CPBQJMYROZQQJC-UHFFFAOYSA-N helium neon Chemical compound [He].[Ne] CPBQJMYROZQQJC-UHFFFAOYSA-N 0.000 description 1
- 238000009396 hybridization Methods 0.000 description 1
- 230000006872 improvement Effects 0.000 description 1
- 239000004816 latex Substances 0.000 description 1
- 229920000126 latex Polymers 0.000 description 1
- 238000004519 manufacturing process Methods 0.000 description 1
- 239000003550 marker Substances 0.000 description 1
- 239000000463 material Substances 0.000 description 1
- 238000012067 mathematical method Methods 0.000 description 1
- XLTANAWLDBYGFU-UHFFFAOYSA-N methyllycaconitine hydrochloride Natural products C1CC(OC)C2(C3C4OC)C5CC(C(C6)OC)C(OC)C5C6(O)C4(O)C2N(CC)CC31COC(=O)C1=CC=CC=C1N1C(=O)CC(C)C1=O XLTANAWLDBYGFU-UHFFFAOYSA-N 0.000 description 1
- 238000012986 modification Methods 0.000 description 1
- 230000004048 modification Effects 0.000 description 1
- 230000004001 molecular interaction Effects 0.000 description 1
- 238000012544 monitoring process Methods 0.000 description 1
- 230000035772 mutation Effects 0.000 description 1
- 102000039446 nucleic acids Human genes 0.000 description 1
- 108020004707 nucleic acids Proteins 0.000 description 1
- 150000007523 nucleic acids Chemical class 0.000 description 1
- 230000003287 optical effect Effects 0.000 description 1
- 229920013655 poly(bisphenol-A sulfone) Polymers 0.000 description 1
- 239000000376 reactant Substances 0.000 description 1
- 230000009467 reduction Effects 0.000 description 1
- 239000012488 sample solution Substances 0.000 description 1
- 238000004557 single molecule detection Methods 0.000 description 1
- 239000007787 solid Substances 0.000 description 1
- 230000003595 spectral effect Effects 0.000 description 1
- 238000004611 spectroscopical analysis Methods 0.000 description 1
- 230000002269 spontaneous effect Effects 0.000 description 1
- 230000005654 stationary process Effects 0.000 description 1
- 238000007619 statistical method Methods 0.000 description 1
- 238000005309 stochastic process Methods 0.000 description 1
- 238000003860 storage Methods 0.000 description 1
- 238000012546 transfer Methods 0.000 description 1
- 230000009466 transformation Effects 0.000 description 1
- 238000013519 translation Methods 0.000 description 1
- 229910052724 xenon Inorganic materials 0.000 description 1
- FHNFHKCVQCLJFQ-UHFFFAOYSA-N xenon atom Chemical compound [Xe] FHNFHKCVQCLJFQ-UHFFFAOYSA-N 0.000 description 1
- LYTCVQQGCSNFJU-LKGYBJPKSA-N α-bungarotoxin Chemical compound C(/[C@H]1O[C@H]2C[C@H]3O[C@@H](CC(=C)C=O)C[C@H](O)[C@]3(C)O[C@@H]2C[C@@H]1O[C@@H]1C2)=C/C[C@]1(C)O[C@H]1[C@@]2(C)O[C@]2(C)CC[C@@H]3O[C@@H]4C[C@]5(C)O[C@@H]6C(C)=CC(=O)O[C@H]6C[C@H]5O[C@H]4C[C@@H](C)[C@H]3O[C@H]2C1 LYTCVQQGCSNFJU-LKGYBJPKSA-N 0.000 description 1
Images


Classifications
-
- G—PHYSICS
- G01—MEASURING; TESTING
- G01N—INVESTIGATING OR ANALYSING MATERIALS BY DETERMINING THEIR CHEMICAL OR PHYSICAL PROPERTIES
- G01N21/00—Investigating or analysing materials by the use of optical means, i.e. using sub-millimetre waves, infrared, visible or ultraviolet light
- G01N21/62—Systems in which the material investigated is excited whereby it emits light or causes a change in wavelength of the incident light
- G01N21/63—Systems in which the material investigated is excited whereby it emits light or causes a change in wavelength of the incident light optically excited
- G01N21/64—Fluorescence; Phosphorescence
- G01N21/645—Specially adapted constructive features of fluorimeters
- G01N21/6452—Individual samples arranged in a regular 2D-array, e.g. multiwell plates
-
- G—PHYSICS
- G01—MEASURING; TESTING
- G01N—INVESTIGATING OR ANALYSING MATERIALS BY DETERMINING THEIR CHEMICAL OR PHYSICAL PROPERTIES
- G01N21/00—Investigating or analysing materials by the use of optical means, i.e. using sub-millimetre waves, infrared, visible or ultraviolet light
- G01N21/62—Systems in which the material investigated is excited whereby it emits light or causes a change in wavelength of the incident light
- G01N21/63—Systems in which the material investigated is excited whereby it emits light or causes a change in wavelength of the incident light optically excited
- G01N21/64—Fluorescence; Phosphorescence
- G01N21/6408—Fluorescence; Phosphorescence with measurement of decay time, time resolved fluorescence
-
- G—PHYSICS
- G01—MEASURING; TESTING
- G01N—INVESTIGATING OR ANALYSING MATERIALS BY DETERMINING THEIR CHEMICAL OR PHYSICAL PROPERTIES
- G01N21/00—Investigating or analysing materials by the use of optical means, i.e. using sub-millimetre waves, infrared, visible or ultraviolet light
- G01N21/62—Systems in which the material investigated is excited whereby it emits light or causes a change in wavelength of the incident light
- G01N21/63—Systems in which the material investigated is excited whereby it emits light or causes a change in wavelength of the incident light optically excited
- G01N21/64—Fluorescence; Phosphorescence
- G01N2021/6417—Spectrofluorimetric devices
Definitions
- the invention relates to improvements in a multiple channel spectrometer capable of quickly analyzing large volumes of samples by the fluorescence emitted by the samples. While many different systems for causing fluorescence emission and processing of the fluorescence may be used, one currently preferred method is known as fluorescence correlation spectroscopy (also known as fluorescence fluctuation spectroscopy). Examples of this technique are as described in Schrof et al. U.S. Patent No. 5,815,262. Other examples of fluorescence cross-correlation spectroscopy are shown in the articles by Andre Koltermann et al.
- FCS fluorescence correlation spectroscopy
- the raw data may contain useful information and features that are completely and definitively lost once the data has been processed through the hardware correlator.
- the user can examine the raw data after they have been acquired. Specifically, it may turn out that higher order correlation functions may be of more interest in describing the molecular interactions occurring in the sample solutions being analyzed through the spectrometer. Thus, if one can keep the raw data, this permits the user to further analyze it with more complicated analysis models when that is desired.
- the analysis can be easily implemented in an automated fashion by properly designed software for a spectrometer, particularly for high throughput screening instruments.
- the first order autocorrelation function of fluorescence correlation spectroscopy is typically determined by using the time-mode, which is the traditional way of calculating the function. See particularly Thompson, Fluorescence Correlation Spectroscopy, in "Topics in Fluorescence Spectroscopy” , Volume 1 (J.R. Lakowicz, Editor), Plenum Press, New York 1991, pages 337-410. Time mode operations tend to limit the precision in determining concentrations, and increase the data acquisition time.
- Fluorescence emission is usually preferred for such high throughput uses due to the overall sensitivity when compared to other techniques such as absorption measurements.
- Another advantage of using fluorescence is the detection method of availability of a range of fluorophores that can be used as extrinsic probes.
- five parameters can be measured when using a fluorescence technique, namely the intensity of the excitation spectra, the intensity of the emission spectra (each at selected wavelengths), the polarization of the excitation spectrum, the quantum yield of fluorescence, and the decay time of the excited level.
- Fluorescence correlation spectroscopy was originally proposed by Magde et al., Thermodynamic Fluctuations in a Reacting System: Measurements by Fluorescence Correlation Spectroscopy, Physical Review Letters , Volume 29 (1972), pages 705-708.
- the temporal fluctuations of the detected fluorescence signal that is time-dependent, spontaneous intensity fluctuations of the fluorescence signal in the typically tiny observation volume
- These intensity fluctuations and the volume under observation may arise from Brownian motion, flow, and chemical reactions.
- a fluorescence probe is excited through a one photon or multi photon excitation process.
- the light source may be lamp such as an xenon arc or deuterium lamp, or a laser such as continuous wave lasers: i.e., argon-ion, krypton-ion, helium-neon, helium-cadmium, or other lasers.
- Pulsed lasers may also be used such as nitrogen lasers or mode-locked lasers, diode lasers, or lasers placed in an array.
- the light source should be capable of delivering radiation at a particular wavelength or wavelengths that excite the fluorescence probe through one photon or multi photon excitation processes.
- excitation wavelengths may range from 200 nm. to 5,000 nm.
- a fluorescence spectrometer which comprises a laser; and at least one beam splitter (which may be a prism-type beam splitter, a fiber optic system, or similar device for accomplishing the beam splitting function) positioned to receive a light beam from the laser and to divide the beam into a plurality of separate, first light portions.
- beam splitter which may be a prism-type beam splitter, a fiber optic system, or similar device for accomplishing the beam splitting function
- multiple first light beam portions are provided, typically spaced from and extending parallel to each other.
- Dichroic mirrors are positioned to separately receive the first light beam portions and to reflect the beam portions at an angle to the first light beam portions, typically perpendicular.
- a plurality of transparent wall chambers (such as wells) are provided for holding samples to be analyzed.
- a conventional multiple well sample plate may be used.
- Objective lens systems are provided (typically for confocal use), for example microscopes, which systems are respectively positioned in the path of each of the reflected first beam portions, to respectively focus each reflected beam portion to a point within one of the separate, transparent chambers, to elicit a fluorescent response from the sample for testing in the chamber.
- Lenses are respectively positioned to receive the fluorescence from the sample for testing (which samples are within the transparent chambers), and to respectively focus the fluorescence at pinholes in respective, opaque partitions.
- the lenses are positioned to receive the fluorescence which passes back through the objective lens system and the dichroic mirror, and then to focus the fluorescence at a respective pinhole.
- the dichroic mirror is selected so that it is transparent to at least one wavelength of the fluorescence.
- Light detectors are each respectively positioned adjacent to one of the pinholes, with that pinhole being respectively positioned between the lens and the light detector of the particular system, to permit each light detector to sense fluorescence through the pinhole. Electronics are then provided to receive and process signals from each light detector.
- the spectrometer of this invention will comprise a plurality of such individual systems, typically four or eight, for simultaneous processing of sample in separate chambers or wells, to contribute to a high throughput system.
- a plate comprises the transparent chambers described above, plus a plurality of other transparent chambers for holding samples, typically carried by the same plate.
- An x-y movement device carries the plate and permits a first group of the chambers to be respectively and simultaneously exposed to the first light beam portions for analysis of the resulting fluorescence. Then, the x-y device may be moved in a two dimensional, planar manner for exposure of another group of chambers of the plate to the first light beam portions, for their analysis.
- the system is set up so that fluorescence from each transparent chamber which passes through the objective lens system and the dichroic mirror extends in a straight line, passing further through the objective lens system and the pinhole to the light detector in the same straight line.
- an array of such detector systems comprising the above items to control and process multiple first beam portions, can be used to systematically and simultaneously analyze the contents of multiple chambers of a plate, followed by translation of an x-y table which carries the plate, for analysis of another set of the chambers, until the multiple chamber plate (up to 384 or more such chambers) has been completely and rapidly analyzed.
- each of the first beam portions produced by this invention pass through only one chamber and sample per individual analysis, so there is no possibility of chamber data cross contamination resulting from a light beam that passes through multiple chambers to elicit a fluorescent response, as in the patent cited above.
- the light excitation and detection scheme used in this invention follows the confocal design of microscopy.
- Data acquisition can be achieved by measuring the time intervals between the photons reaching the detector and building a histogram of the detected counts.
- the volume in the sample from which photons are detected can be of extremely small volume, for example, about 0.1 to 10 femtoliters, which is on the order of the volume of a bacterium.
- the photon counting histogram provides the concentrations of the molecular species present in the solution and the number of photons emitted by each species.
- the invention can also derive simultaneously the autocorrelation function or higher-order correlation functions of the parameters of interest for rapid high throughput.
- Screening can be acquired on such small observation volumes over a time of about one to five seconds. Direct measurement of single molecules and the kinetics involved over any desired time scale can be achieved by this technique.
- the lower limit of detection is due to impurities and buffer contamination, plus the effect of the particulate resulting from insoluble compounds.
- Data acquisition and analysis of the data may comprise the steps of: acquiring a fluorescence measurement over time from a sample in the form of electronic raw data.
- This electronic raw data may be picked up by a light detector, sent to a preamplifier discriminator, and then sent to a computer, where the raw data may be stored, in accordance with this invention, and contrary to the procedure used with the conventional hardware correlator.
- the electronically stored raw data is then processed using a first algorithm, without erasing the electronically stored, original raw data. Then, as an advantage of and by means of this invention, the stored raw data may be reprocessed using one or more additional algorithms, or the data may be reprocessed with the first algorithm, without the need of acquiring a complete set of new data as may be required in the prior art.
- the fluorescence signal F(t) as a function of time is measured as the raw data.
- the temporal autocorrelation of the fluorescence fluctuations which is a measurement of the average temporal duration of the fluorescence fluctuations, is determined.
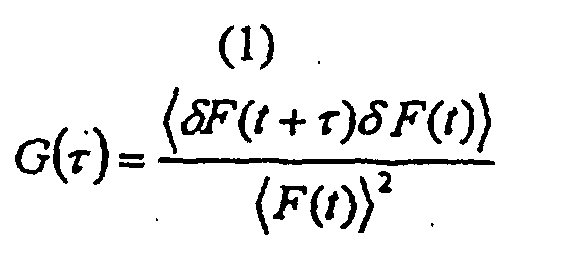
- the normalized autocorrelation function is defined as:
- G( ⁇ ) decays in time.
- the rate of the decay and the shape of the curve contain information about the mechanisms and the rates of the processes that generate the fluorescence fluctuations.
- the observed fluctuations of the fluorescence signal obey Poisson statistics with the amplitude of the average fluctuation proportional to N 1/2 , where N represents the number of molecules in the observation volume.
- Nanomolar concentrations can be detected.
- FCS FCS with two-photon excitation
- the observation volume ranges typically from 0.1 to 1.0 x 10 -15 liters (or femtoliter, abbreviated as "fl"). This small observation volume allows the direct measurement of single molecules and the kinetics involved over a time scale extending from hundreds of nanoseconds to seconds or hours.
- the lower limit of detection is due to impurities and buffer contamination and the effect of the particulate generated from insoluble compounds.
- the detector records the time delay between one photon and the next photon from the fluorescence arriving to the detector.
- the "clocks" are the events to be recorded, and the photons are the starts-stops which define each interval.
- the detector counts the number of photons collected from the sample in a specific time interval.
- the instrument uses about 256 different time intervals.
- the length of a time interval is specified by the user through the software which controls the operation.
- the photons are the "events” to be recorded at each time interval.
- the “clocks” are the arbitrary starting and ending stops defined by the electronics to create each desired time interval.
- the method of this invention may be used in conjunction with a one photon excitation technique, in which the excited level of the molecule is created by one photon contrary to the situation where two or more photons are needed to create the necessary excitation to achieve fluorescence in the sample.
- One photon excitation techniques can use significantly less expensive lasers.
- a data acquisition card may be provided in the computer used for processing the data, in which the data acquisition card acquires the raw data from the light detector and arranges for its storage in the computer memory. Then, the computer may calculate the desired autocorrelation function or higher-order correlation functions.
- This provides the advantage that bad data may be eliminated without losing the entire data set pertinent to the sample well under examination, contrary to the situation of a hardware correlator. The bad data may result from the presence of a solid particle in the tiny volume being examined for fluorescence. Additionally, the raw data may be rerun after acquisition for recalculation based on higher order correlation functions, if that is needed.
- Such a data acquisition card can also have the capability of acquiring the data in either the time mode or in the photon mode, as may be desired.
- a multi-channel high throughput screening (HTS) spectrometer 10 is shown in schematic form, used for FCS.
- a laser 12 serves as a source of excitement radiation for fluorescent samples.
- Light beam 14 from laser 12 is split into four separate first light beam portions 16 by a group of beam splitters 18 of conventional design and mirrors 17.
- the first light beam portions 16 respectively enter different spectrometer units 20a, 20b, 20c, 20d for the irradiation of separate samples and the sensing of fluorescence emitted from the samples.
- the detailed structure of the spectrometer units 20a-20d may be identical, one being specifically shown in Fig. 3.
- system of beam splitters 18 and angle mirrors 17 may be replaced by a multiple light cable system, in which light is transmitted from the laser by the cable system to provide individual first light beam portions directed to the respective spectrometer units 20a-20d.
- spectrometer units 20 There is no intrinsic limit on the number of individual spectrometer units 20 which may be irradiated by a single laser 12. For example, at least eight separate spectrometer units may be serviced by laser 12 and a light distribution system 17, 18 (or light cables), up to about 150 spectrometer units and more if desired, depending upon the power of the laser.
- Fig. 2 shows a plan view of a system which is basically identical with Fig. 1 except that the respective, corresponding spectrometer units 20a', 20b', 20c', 20d' are arranged in a square rather then a straight line pattern by appropriate modification of the light distribution system 17, 18 (or light cables).
- the spectrometer units point at the transparent bottoms of chambers 22, which are present in a checkerboard array as part of a commercially available 384 well plate 24, so that 384 separate samples may be analyzed by the fluorescence spectrometer of this invention.
- Plate 24 is carried in an open bottom X-Y table 26, which is capable of precise movement in both horizontal directions, so that after a typical 1-5 second irradiation of the four wells 22 that are being analyzed by the respective spectrometer units 20a'-20d', X-Y table 26 can be horizontally shifted so that four new wells 22 may then be tested by the four spectrometer units. Accordingly, the system of this invention is capable of high volume production of spectrographic analysis of a large number of samples.
- X-Y tables are well-known, commercially available devices.
- first light beam portions 16 may be directed in any pattern desired, linear, rectangular, or otherwise for transfer into spectrometer units 20.
- one of the beam portions 16 enters unit 20 and strikes dichroic mirror 28, being reflected upwardly as a beam portion 16a.
- Dichroic mirror 28 is a commercially available mirror having the characteristic of being reflective to light at some wavelengths and transmissive to light at other wavelengths.
- first light beam portion 16 is selected to be of a wavelength that is reflected by dichroic mirror 28.
- Light beam 16a passes through objective 30, which generally functions as a microscope, focusing the light beam to a focal point 32 residing within microwell 22 and within the sample contained therein.
- the volume at focal point 32 can cover a very small volume of material, on the order of a one femtoliter volume approximating the volume of a bacterium.
- the laser intensity is adjusted so that photo bleaching of the sample is avoided, resulting from excessive beam intensity.
- the optimum beam intensity depends upon the sample concentration plus the sample quantum yield, which is the number of photons emitted by the sample divided by the number of photons passed into the sample. Some fluorophores may have a very low quantum yield, which naturally will then require a larger laser beam intensity.
- the fluorescent response may take place from one or more of the molecules within the tiny, focused volume 32, the fluorescence being at a characteristic wavelength that is typically different from the wavelength of the laser beam 16, 16a. Some of this fluorescence passes back through objective lens 30 and through dichroic mirror 28 without much reflection, since it is of a different wavelength.
- the dichroic mirror is of a type selected to be transparent to the particular fluorescent wavelength. It is desirable for the fluorescence to pass back through the same objective lens 30 that the irradiating radiation passes through in the other direction, since when a second objective lens is used, it would be difficult for the second objective lens to align and focus upon the same volume 32 that the first objective lens 30 is focusing on.
- filter 34 After passing through the dichroic mirror 28, filter 34 blocks light of wavelengths other than the desired wavelengths.
- the fluorescent light is focused by lens 36, so that it passes through a pinhole 38 in an opaque partition 40 at or very near the focal point of lens 36 under the particular conditions.
- the amount of the volume of sample probed by the instrument (typically at the femtoliter range) is determined by the optics of the system, plus the diameter of pin hole 38. If desired, an instrument incorporating this invention may carry a series of different pinholes which may be alternatively placed into the position shown in Fig. 3, to provide a variation of the volume of sample 22 thus probed by spectrometer unit 20.
- a light detector 42 of conventional design is monitoring pinhole 38 from the other side of partition 40. When light is detected, it will be typically only fluorescence from the sample, since other wavelengths of light are removed by filter 34. Signals from the light detector 42 pass through cable or wire 44 to preamplifier discriminator 46, and the signals from discriminator 46 pass through cable or wire 48 to computer 50. In the computer, the fluorescent signal, measured as a function of time, is processed to obtain a temporal autocorrelation of the fluorescence fluctuations, which is a measurement of the average temporal duration of the fluorescence fluctuations. Using the well-known normalized autocorrelation function, it becomes possible to directly measure fluorescence characteristics of single molecules, and the kinetics involved over a time scale extending from hundreds of nanoseconds to seconds or hours.
- the data is processed by means of the above technique as follows: the measurement 60 is acquired on a well 22 in the manner previously described.
- the data passes as a data stream into computer 50 as at 62.
- a math algorithm 64 examines the raw data for the presence of large signal variations indicating contaminants. If present, large variations in the signal are removed by a software filter 66, and the data passes through math algorithm 64 again. If no large signal variations are found, a math algorithm 68 calculates the autocorrelation function of the acquired data. Parameters of interest are determined, such as diffusion, coefficients, concentrations, binding constants, etc. through software 70.
- results are either accepted in accordance with predetermined criteria of algorithm 73. If the criteria are not achieved, the math algorithm 74 calculates higher order correlation functions through the computer software. Again a decision point 76 is reached. If the results are now in compliance with the criteria of the algorithm 78, the results are accepted and provided to the user. Otherwise, the algorithm may be predetermined to provide another analysis model 80 for the acquired data. This recursive loop of decisions including decision point 72, 76, 82 may continue for as long as may be desired, until the results fit the desired criteria or there are no other algorithms or analysis techniques available in the program to process the data.
- HTS high throughput screening
- PCH photon count histograms
- the apparatus we assembled allows the simultaneous measurement of the fluorescence signals using two light detectors. Therefore, it is possible in principle to measure two separate spectroscopic properties such as differential wavelength emission and polarization of a molecule.
- the principles described below can very well adapt to a multiple detector system
- Fluctuation experiments observe a physical process that is stochastic in nature.
- the time series of such a random signal can be rather complex. Consequently, an analysis based on statistical methods is required to examine stochastic processes (Gardiner, 1985).
- FCS experiments determine the autocorrelation function g ⁇ from the sequence of photon counts in order to examine the statistics of the time-dependent decay of the fluorescence intensity fluctuations to their equilibrium value.
- the determination of the autocorrelation function from the raw data is a data reduction technique. Hence, some information encoded in the time series of the photon counts is lost.
- Fluorescence fluctuation experiments are typically performed using single photon counting techniques. Each detected photon gives rise to an electric pulse, which is sent to the data acquisition system. Thus, the fluorescence intensity reaching the photodetector is converted into photon counts.
- Shot noise is a random Poisson point process, and reflects the discreteness and statistical independence of the photoelectric detection process (Snyder, 1975).
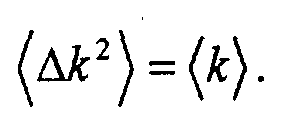
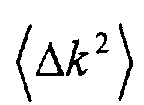
- the variance of a distribution serves as an indicator of its width. For the Poisson distribution, the mean and the variance are equal,
- a Poisson distribution describes the photon count statistics for light of constant intensity. Fluctuations in the light intensity change the photon counting statistics and the corresponding distribution of photon counts was first described by Mandel (Mandel, 1958),
- Mandel's formula (eq. 2) essentially describes a superposition of Poissonian distributions scaled by the respective probability of the intensity distribution function p( I D ).
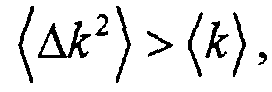
- the photon count distribution p( k ) is now characterized by a variance greater than its mean value, which is classified as super-Poissonian (Teich and Saleh, 1988).
- super-Poissonian Teich and Saleh, 1988.
- intensity fluctuations lead to a broadening of the photon count distribution with respect to a pure Poisson distribution (fig. 1).
- the variance of the intensity distribution p( I D ) determines the variance of the photon counts (Mehta, 1970).
- the strength of the intensity fluctuations increases, so does the broadening of the photon counting histogram.
- the changes in the shape of the histogram from a Poisson distribution are characteristic for the intensity distribution p( I D ) and it is possible to infer some characteristic properties of the light source from the photon counting histogram.
- This approach has been used in the past to investigate the scattering of light (Bertolotti, 1973), the twinkling of stars (Jakeman et al., 1978) and the fluctuations of laser light (Risken, 1970).
- the experimental setup typically involves a microscope and an objective, that is used to focus the excitation light in order to achieve a small spatial volume.
- a detector collects the fluorescent light emerging from the excitation volume.
- the effect of the microscope optics and the detector on the shape of the observation volume is characterized by the point-spread function (PSF) of the instrument.
- PSF point-spread function
- the shape of the PSF influences the photon count distribution and will be considered for a few PSF conventionally used in confocal and two-photon detection (Qian and Elson, 1991; Berland et al., 1995).
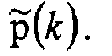
- the average photon counts are thus determined by the product of ⁇ and the probability to find the molecule within the volume of the point spread function V PSF . Therefore ⁇ describes the molecular brightness, which determines the average number of photon counts received during the sampling time ⁇ t s for a particle within the observation volume V PSF .
- the parameter ⁇ sec expresses the molecular brightness in photon counts per second per molecule (cpsm) and allows a more convenient comparison between different experiments.
- the PCH function p and( k ; V 0 , N , ⁇ ) describes the probability to observe k photon counts per sampling time for an open system with an average of N particles inside the reference volume V 0 .
- the particular choice of the reference volume for an open system is irrelevant. It is intuitively clear, that the properties of an open system have to be independent of the arbitrary reference volume V 0 (Chen et al., 1999). Thus, the photon count distribution should be either referenced to an intensive quantity, like the particle concentration, or to some standard volume.
- FCS where the volume of the PSF, V PSF , connects the g 0 value of the autocorrelation function to the average number of molecules N PSF (Thompson, 1991).
- the photon count distribution depends on the PSF.
- PCH the PCH of a single particle for a few PSF of interest.
- Gaussian-Lorentzian squared PSF has been used to describe the two-photon excitation beam profile for our experimental conditions (Berland et al., 1995),
- the PSF is expressed in cylindrical coordinates and the excitation profile has a beam waist ⁇ 0 .
- the inverse of the Lorentzian along the optical axis for an excitation wavelength of ⁇ is given by,
- the integral which contains the incomplete gamma function ⁇ (Abramowitz and Stegun, 1965), can be evaluated numerically.
- a second important PSF is the three dimensional Gaussian PSF, which is used extensively to describe confocal detection (Qian and Elson, 1991; Rigler et al., 1993a), with an effective beam waist z 0 in the axial direction.
- the PCH of a single particle is determined in the same way as for the other PSF and we derive for k > 0 an expression in the form of a one-dimensional integral,
- the PSF is typically approximated by a two-dimensional Gaussian, and the corresponding PCH is given by,
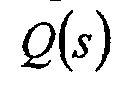
- the Laplace transform F s of the probability function f ( x ) is also its moment generating function (Saleh, 1978),
- the Poisson transform can be expressed in terms of the Laplace transform F( s ) through the following relationship (Saleh, 1978),
- the photon counting histogram can now be determined from the moment generating function according to eq. 21, using the analytical form of the derivatives of the generalized hypergeometric function and the notation a k for the Pochhammer function,
- a second example for the use of the moment generating function is illustrated for the homogeneous PSF.
- a Poisson distribution determines the PCH of a single particle.
- the PCH for an open system is described by a compound Poisson distribution,
- the moment generating function Q ( s ) allows us to calculate the PCH of the open system analytically by using the following relationship,
- the photon count distribution characterizes the amplitude fluctuations of the detected photons, but lacks kinetic information.
- the photon count distribution considered so far describes the number of detected photons in a single time interval.
- time-dependence to the photon count statistics (Saleh, 1978).
- the conditional probability that a particle at position r 0 at time t 0 will be found at a later time t 1 at position r 1 is given by the solution of the diffusion equation (see for example (Chandrasekhar, 1943)), where D is the diffusion coefficient of the particle and ⁇ the time difference t 1 - t 0 .
- D the diffusion coefficient of the particle
- ⁇ the time difference t 1 - t 0 .
- the proportionality constant ⁇ describes the detection efficiency and is set to 1 for simplicity.
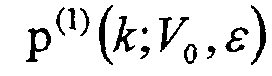
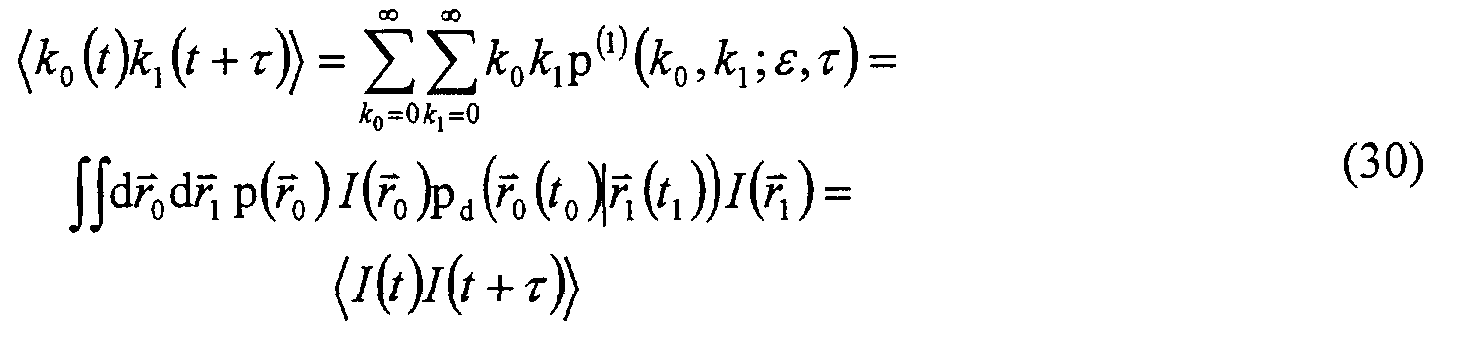
- the probability p (1) k 0 , k 1 ; ⁇ , ⁇ to observe k 0 photon counts at time t 0 and k 1 photon counts at a later time t 1 for a diffusing particle with brightness ⁇ is then determined by (Qian, 1990), where p r 0 describes the probability to find the particle at position r 0 .
- the correlation function of the photon counts for a diffusing particle is equal to the correlation function of the fluorescence intensity
- the experimental photon counts range from a minimum value k min , which is typically 0 for most experiments, to a maximum number k max , and the number of fitting parameters is given by d.
- the normalized residuals of the fit are determined by
- the photon count distribution of a fluorescein solution was measured at three different concentrations (fig. 3). We performed a global fit of all three histograms with ⁇ linked, while the average number of particles was allowed to vary. The data and the fitted histograms in fig. 3 are in good agreement. The residuals between data and fit for each histogram are displayed in units of standard deviation ⁇ . The residuals vary randomly and yield a reduced ⁇ 2 close to 1, indicating a good description of the data by the theoretical model. The recovered number of molecules N scales with the concentration of the sample. The dashed lines in fig. 3 represent the corresponding Poisson distributions with a mean equal to the average photon counts ⁇ k ⁇ of the sample.
- the photon counting histogram approaches a Poisson distribution with increasing fluorophore concentration. This behavior can be readily understood by considering the influence of the molecule concentration on the intensity fluctuations.
- the relative strength of the number fluctuations is given by the ratio between the standard deviation ⁇ and the mean ⁇ of the particle number distribution,
- the number of molecules inside a small, open volume is Poisson distributed, and the relative strength of the particle fluctuations decreases with the inverse square root of the average number of particles N .
- the number distribution approaches a delta function ⁇ ( N - N ). Consequently, the fluctuations in intensity become negligible, when compared to the average intensity.
- the second contribution to the intensity fluctuations which is due to the diffusion in an inhomogeneous excitation profile, also vanishes at high particle concentrations. Any vacancy created by a molecule leaving a position is practically always filled by another molecule moving to that position, so that no net change in the fluorescence intensity occurs.
- a constant fluorescence intensity dictates a Poissonian photon count distribution.
- fractional deviation Q a measure of the deviation between the PCH and the Poisson distribution (Mandel, 1979), where and ⁇ k ⁇ are the variance and the expectation value of the photon counts, respectively, and ⁇ is the shape factor of the PSF (Thompson, 1991).
- the fractional deviation Q and the g 0 value of the intensity autocorrelation function (Thompson, 1991), are closely related.
- the g (0) value is the ratio of the shape factor y to the average number of molecules N inside the PSF.
- the relationship between the intensity moments and the factorial moments of the photon counts (Teich and Saleh, 1988) allows us to express g 0 by the variance and the average of the photon counts.
- the ratio of Q to g 0 determines the average photon counts ⁇ k ⁇ , according to eq. 10.
- the molecular brightness largely determines the super-Poissonian character of the PCH, since Q is directly proportional to the parameter ⁇ , which depends on the excitation power, the detection efficiency and the molecular species.
- ⁇ 2 / Poi ( M ⁇ ( k , ⁇ , N )(1- ⁇ ( k , ⁇ , N ))) 1 ⁇ 2 .
- the function ⁇ 2 / Poi describes the statistical significance of the deviation of the PCH from a Poisson distribution. If the value of ⁇ 2 / Poi is less than or equal to 1 then the statistics are not sufficient to distinguish the data from a Poisson distribution. The larger the value of ⁇ 2 / Poi, the stronger the deviation between the PCH and the Poisson distribution.
- the value of the ⁇ 2 / Poi function is directly proportional to the number of data points M taken, and therefore directly proportional to the data acquisition time. If we formally define the square root of the ⁇ 2 / Poi function to be a measure of the signal to noise ratio (SNR), then we find, that the SNR of PCH is proportional to the square root of the data acquisition time, and close to linear for the molecular brightness. These conclusions are similar to those by Koppel, where the SNR was derived for the autocorrelation function under the simplifying condition of Gaussian statistic (Koppel, 1974).
- the histogram of photon counts is sensitive to the molecular brightness and was discussed in detail for a single species. If two species differ in their molecular brightness, then a molecule of the brighter species entering the observation volume will produce a stronger fluorescent intensity change than the other species. By considering the statistics of these intensity changes, one can deduce the brightness and the average number of molecules of each species. Shot noise caused by the photodetection process is added to these intensity fluctuations. It was shown that the resulting photon counting statistics for multiple species is given by the consecutive convolution of the single species photon counting histograms.
- a reduced ⁇ 2 value of one or less indicates, that the data statistics is not sufficient to resolve the species, while a ⁇ 2 greater than one indicates that more than one species is present.
- the brightness for a given species is kept constant during the calculation of the histograms, but the concentration is varied in a systematic manner.
- the results are best represented graphically in the form of a contour plot of the ⁇ 2 surface as a function of the logarithmic concentration of both species.
- the concentration of each species is expressed in number of molecules within the PSF.
Landscapes
- Health & Medical Sciences (AREA)
- Nuclear Medicine, Radiotherapy & Molecular Imaging (AREA)
- Physics & Mathematics (AREA)
- Life Sciences & Earth Sciences (AREA)
- Chemical & Material Sciences (AREA)
- Analytical Chemistry (AREA)
- Biochemistry (AREA)
- General Health & Medical Sciences (AREA)
- General Physics & Mathematics (AREA)
- Immunology (AREA)
- Pathology (AREA)
- Investigating, Analyzing Materials By Fluorescence Or Luminescence (AREA)
- Optical Measuring Cells (AREA)
- Spectrometry And Color Measurement (AREA)
Abstract
Description




































Claims (19)
- A fluorescence spectrometer which comprises:
a laser; at least one beam splitter positioned to receive a light beam from the laser and to divide said beam into a plurality of separate, first light beam portions; dichroic mirrors positioned to separately receive said first light beam portions and to reflect said beam portions at an angle to said first light beam portions; a plurality of transparent chambers for holding samples; objective lens systems respectively positioned in the path of said reflected beam portions to respectively focus each reflected beam portion to a point within one of said separate, transparent chambers; lenses respectively positioned to receive fluorescence from a sample for testing within said transparent chambers and to respectively focus said fluorescence at pinholes in opaque partitions, said lenses being positioned to receive said fluorescence which passes back through said objective lens system and said dichroic mirror; light detectors each respectively positioned adjacent to one of said partitions with one said partitions respectively positioned between each of said lenses and said light detectors, to permit each light detector to sense fluorescence through said pinhole; and electronics to receive and process signals from each light detector. - The spectrometer of Claim 1 in which a plate comprises said transparent chambers and a plurality of other transparent chambers for holding samples; and an x-y movement device which carries said plate and permits a first group of said chambers to be simultaneously respectively exposed to said first light beam portions for spectrometric analysis, followed by movement of the x-y device for exposure of another group of chambers to the first light beam portions for their spectrometric analysis.
- The spectrometer of Claim 2 in which a plurality of beam splitters divide said light beam into at least four first light beam portions which are spaced from each other for simultaneous irradiation of at least four of said transparent chambers, each separate first light beam portion irradiating only one of said transparent chambers.
- The spectrometer of Claim 3 in which said first light beam portions extend parallel to each other.
- The spectrometer of Claim 4 in which the chambers of said plate comprise open top wells, and the first light beam portions pass into said chambers through the bottoms of said wells.
- The spectrometer of Claim 5 in which fluorescence from each sample in each chamber passes in a straight path through said objective lens system, said dichroic mirror, said lens, and said pinhole to said light detector.
- The spectrometer of Claim 3 in which fluorescence from each sample in each chamber passes in a straight path through said objective lens system, said dichroic mirror, said lens, said pinhole to said light detector.
- The spectrometer of Claim 1 in which a plurality of dichroic mirrors divide said light beam into at least four first light beam portions which are spaced from each other for simultaneous irradiation of at least four transparent chambers, each separate first light beam portion irradiating only one of said transparent chambers.
- The spectrometer of Claim 8 in which said first light beam portions extend parallel to each other.
- The spectrometer of Claim 1 in which fluorescence from each sample in each chamber passes in a straight path through said objective lens system, said dichroic mirror, said lens, and said pinhole to said light detector.
- The method of performing fluorescence correlation spectroscopy, which comprises:
acquiring a fluorescence measurement over time from a sample in the form of electronic raw data; electronically storing said raw data; and processing said raw data using a first algorithm without erasing said electronically stored raw data. - The method of Claim 11 which comprises subsequently reprocessing said stored raw data using a second algorithm different from said first algorithm.
- The method of Claim 12 in which said raw data is acquired using a photon-mode technique.
- The method of Claim 11 in which said raw data is acquired using a photon-mode technique.
- The method of performing fluorescence correlation spectroscopy, which comprises:
acquiring a fluorescence measurement from a sample over time to obtain a histogram of photon counts; deriving the molecular brightness of at least one molecular species in said sample; and determining the concentration of said species. - The method of Claim 15, in which the molecular brightness of a plurality of said species is determined from said fluorescence measurement.
- The method of Claim 15 in which the fluorescence measurement is taken from a sample volume of no more than 10 femtoliters.
- The method of Claim 17 in which the molecular brightness of a plurality of said species is determined from said fluorescence measurement.
- Fluorescence spectrometer which comprises:a laser;a dichroic mirror positioned to receive said light beam and to reflect a light beam portion at an angle to said light beam;a plate comprising a plurality of transparent chambers for holding samples, and an x y movement device which carries said plate and permits said chamber to be sequentially exposed to said light beam portion for spectrometeric analysis, followed by movement of the x-y device for exposure of another chamber to the light beam portion for their spectrometeric analysis, an objective lens system positioned in the path of said beam portion to focus said beam portion to appoint within said separate transparent chamber;a lens system positioned to receive fluorescence from a sample for testing within said transparent chamber and to respectively focus said fluorescence at a pin hole in an opaque partition, said lens system being positioned to receive said fluorescence which passes back through said objective lens system and said dichroic mirror;a light detector positioned adjacent to said partition, with said partition being positioned between said lens and said light detector, to permit said light detector to sense fluorescence through said pin hole; andelectronics to receive and process signals from each light detector.
Priority Applications (1)
| Application Number | Priority Date | Filing Date | Title |
|---|---|---|---|
| EP05077523A EP1630547A1 (en) | 2000-07-21 | 2001-07-18 | Fluorescence fluctuation spectroscopy method using the photon counting histogram |
Applications Claiming Priority (2)
| Application Number | Priority Date | Filing Date | Title |
|---|---|---|---|
| US621248 | 1984-06-15 | ||
| US09/621,248 US6603546B1 (en) | 2000-07-21 | 2000-07-21 | Rapid high throughput spectrometer and method |
Related Child Applications (1)
| Application Number | Title | Priority Date | Filing Date |
|---|---|---|---|
| EP05077523A Division EP1630547A1 (en) | 2000-07-21 | 2001-07-18 | Fluorescence fluctuation spectroscopy method using the photon counting histogram |
Publications (2)
| Publication Number | Publication Date |
|---|---|
| EP1174706A2 true EP1174706A2 (en) | 2002-01-23 |
| EP1174706A3 EP1174706A3 (en) | 2004-07-07 |
Family
ID=24489376
Family Applications (2)
| Application Number | Title | Priority Date | Filing Date |
|---|---|---|---|
| EP05077523A Withdrawn EP1630547A1 (en) | 2000-07-21 | 2001-07-18 | Fluorescence fluctuation spectroscopy method using the photon counting histogram |
| EP01306195A Withdrawn EP1174706A3 (en) | 2000-07-21 | 2001-07-18 | Rapid high throughput spectrometer and method |
Family Applications Before (1)
| Application Number | Title | Priority Date | Filing Date |
|---|---|---|---|
| EP05077523A Withdrawn EP1630547A1 (en) | 2000-07-21 | 2001-07-18 | Fluorescence fluctuation spectroscopy method using the photon counting histogram |
Country Status (4)
| Country | Link |
|---|---|
| US (2) | US6603546B1 (en) |
| EP (2) | EP1630547A1 (en) |
| JP (1) | JP2002071567A (en) |
| CA (1) | CA2353221A1 (en) |
Cited By (6)
| Publication number | Priority date | Publication date | Assignee | Title |
|---|---|---|---|---|
| WO2005012857A1 (en) * | 2003-08-01 | 2005-02-10 | Consejo Superior De Investigaciones Científicas | Apparatus for simultaneous or consecutive characterization of multiple solid material samples by photoluminescence |
| EP1593957A4 (en) * | 2003-02-13 | 2006-04-26 | Hamamatsu Photonics Kk | Fluorescent correlated spectrometric analysis device |
| WO2015004046A1 (en) * | 2013-07-08 | 2015-01-15 | Fraunhofer-Gesellschaft zur Förderung der angewandten Forschung e.V. | Method for identifying and quantifying emitting particles in systems |
| CN104597020A (en) * | 2015-02-02 | 2015-05-06 | 中国科学院光电研究院 | Multifunctional optical material testing device |
| CN107607505A (en) * | 2017-09-05 | 2018-01-19 | 重庆民泰香料化工有限责任公司 | A kind of method of testing of AFS detection circuit |
| CN112782131A (en) * | 2019-11-11 | 2021-05-11 | 成都辰显光电有限公司 | Spectrum detection system and spectrum detection method |
Families Citing this family (42)
| Publication number | Priority date | Publication date | Assignee | Title |
|---|---|---|---|---|
| EP1351048A4 (en) * | 2000-12-14 | 2007-02-28 | Olympus Corp | Fluorometric analyzer and fluorometric analysis |
| EP1386139A2 (en) * | 2001-05-07 | 2004-02-04 | Deutsches Krebsforschungszentrum Stiftung des öffentlichen Rechts | Fluorescence fluctuation microscope analytical module or scanning module, method for measurement of fluorescence fluctuation and method and device for adjustment of a fluorescence fluctuation microscope |
| US6924490B2 (en) * | 2002-01-10 | 2005-08-02 | Olympus Optical Co., Ltd. | Microscope system |
| US6768122B2 (en) * | 2002-06-04 | 2004-07-27 | National Taiwan University | Multiphoton excitation microscope for biochip fluorescence assay |
| WO2004013610A2 (en) * | 2002-08-01 | 2004-02-12 | Sensor Technologies Llc | Method of measuring molecular interactions |
| WO2004040295A1 (en) * | 2002-10-31 | 2004-05-13 | Nanostream, Inc. | Parallel detection chromatography systems |
| JP3727026B2 (en) * | 2003-04-10 | 2005-12-14 | 博行 野地 | Micro chamber used for detecting single-molecule enzyme activity and method for preparing droplets of 1000 fL or less |
| WO2004095008A1 (en) * | 2003-04-23 | 2004-11-04 | Olympus Corporation | Method for analyzing molecular fluorescence using evanescent illumination |
| WO2004101151A1 (en) * | 2003-05-08 | 2004-11-25 | Nanostream, Inc. | Sample preparation for parallel chromatography |
| TWI267629B (en) * | 2004-01-30 | 2006-12-01 | Asia Optical Co Inc | Laser level device |
| JP4624083B2 (en) * | 2004-11-19 | 2011-02-02 | オリンパス株式会社 | Container holding mechanism |
| MX2007009124A (en) * | 2005-01-31 | 2007-10-08 | Univ Illinois | Methods and devices for characterizing particles in clear and turbid media. |
| US8263414B2 (en) * | 2005-05-23 | 2012-09-11 | Siemens Healthcare Diagnostics Inc. | Dispensing of a diagnostic liquid onto a diagnostic reagent |
| US7242009B1 (en) * | 2005-06-22 | 2007-07-10 | Hach Ultra Analytics, Inc. | Methods and systems for signal processing in particle detection systems |
| US20070103686A1 (en) * | 2005-11-08 | 2007-05-10 | Niklas Tornkvist | Apparatus for non-invasive analysis of gas compositions in insulated glass panes |
| WO2007060045A1 (en) * | 2005-11-25 | 2007-05-31 | Foss Analytical Ab | Optical analyzer |
| WO2007092699A2 (en) * | 2006-02-02 | 2007-08-16 | Life Settlements Funds, Ltd. | Method of valuation of life settlements and optimizing premium financing |
| US20090204442A1 (en) * | 2006-02-02 | 2009-08-13 | Logsdon Leslie W | Method of valuation of life settlements and optimizing premium financing |
| WO2008080417A1 (en) * | 2006-12-28 | 2008-07-10 | Flult Biosystems Gmbh | A method of determining characteristic properties of a sample containing particles |
| JP2008249433A (en) * | 2007-03-29 | 2008-10-16 | Kansai Bunri Sogo Gakuen | Method for measuring bonding affinity of probe to test material, and its utilization |
| DE102007033737A1 (en) * | 2007-07-18 | 2009-01-22 | MAX-PLANCK-Gesellschaft zur Förderung der Wissenschaften e.V. | A method for determining a measurement based on single molecule events |
| JP5020118B2 (en) * | 2008-02-18 | 2012-09-05 | 浜松ホトニクス株式会社 | Fluorescence analyzer and analysis method |
| DE102008018475A1 (en) * | 2008-04-11 | 2009-10-15 | Carl Zeiss Ag | Apparatus and method for luminescence measurement |
| US8512975B2 (en) * | 2008-07-24 | 2013-08-20 | Biomerieux, Inc. | Method for detection and characterization of a microorganism in a sample using time dependent spectroscopic measurements |
| WO2010062350A1 (en) * | 2008-10-31 | 2010-06-03 | Biomerieux, Inc. | Methods for detection, characterization and/or identification of microorganisms in a sealed container |
| DE102009005953A1 (en) * | 2009-01-19 | 2010-07-22 | Universität Tübingen | Method and system for characterizing a sample by means of imaging fluorescence microscopy |
| WO2010090872A2 (en) * | 2009-01-21 | 2010-08-12 | Rare Light, Inc. | Correlation interferometric methods, devices and systems for low cost and rugged spectroscopy |
| AU2011323310A1 (en) | 2010-11-03 | 2013-06-13 | University Of Washington Through Its Center For Commercialization | Determination of tissue oxygenation in vivo |
| WO2013116760A1 (en) * | 2012-02-03 | 2013-08-08 | The Trustees Of Columbia University In The City Of New York | Optical analysis of emissions from stimulated liquids |
| WO2013133725A1 (en) | 2012-03-09 | 2013-09-12 | Rawle Christopher Bruce | Portable device for detecting molecule(s) |
| JP6159391B2 (en) | 2012-04-03 | 2017-07-05 | イラミーナ インコーポレーテッド | Integrated read head and fluid cartridge useful for nucleic acid sequencing |
| DE102015112628A1 (en) * | 2015-07-31 | 2017-02-02 | Carl Zeiss Microscopy Gmbh | Method for generating a digital fluorescence image |
| WO2017051149A1 (en) | 2015-09-23 | 2017-03-30 | Malvern Instruments Limited | Particle characterisation |
| US11002655B2 (en) | 2015-09-23 | 2021-05-11 | Malvern Panalytical Limited | Cuvette carrier |
| GB201604460D0 (en) * | 2016-03-16 | 2016-04-27 | Malvern Instr Ltd | Dynamic light scattering |
| US10502830B2 (en) | 2016-10-13 | 2019-12-10 | Waymo Llc | Limitation of noise on light detectors using an aperture |
| EP3379232A1 (en) | 2017-03-23 | 2018-09-26 | Malvern Panalytical Limited | Particle characterisation |
| EP3807623B1 (en) * | 2018-06-18 | 2023-03-01 | Calico Life Sciences LLC | System and method for inferring protein binding |
| DE102019000066B4 (en) * | 2019-01-09 | 2020-10-08 | Becker & Hickl Gmbh | Process for the visualization of fluorescence lifetime imaging data |
| AU2020361681A1 (en) | 2019-10-10 | 2022-05-05 | 1859, Inc. | Methods and systems for microfluidic screening |
| WO2022047101A1 (en) * | 2020-08-27 | 2022-03-03 | The Research Foundation For The State University Of New York | System and method for embedded diffuse correlation spectroscopy |
| WO2026003151A1 (en) * | 2024-06-28 | 2026-01-02 | Merck Patent Gmbh | Advanced signal extraction for single-molecule-detection |
Family Cites Families (6)
| Publication number | Priority date | Publication date | Assignee | Title |
|---|---|---|---|---|
| US5091652A (en) * | 1990-01-12 | 1992-02-25 | The Regents Of The University Of California | Laser excited confocal microscope fluorescence scanner and method |
| US5355215A (en) * | 1992-09-30 | 1994-10-11 | Environmental Research Institute Of Michigan | Method and apparatus for quantitative fluorescence measurements |
| AU5884394A (en) * | 1993-01-18 | 1994-08-15 | Evotec Biosystems Gmbh | Method and device for assessing the suitability of biopolymers |
| DE19707226A1 (en) * | 1997-02-24 | 1998-08-27 | Bodenseewerk Perkin Elmer Co | Light scanner |
| DE59805338D1 (en) * | 1997-09-19 | 2002-10-02 | Evotec Ag | METHOD FOR MEASURING THE ASSOCIATION OF SUBSTRUCTURES OF PATHOLOGICAL PROTEIN DEPOSITS |
| US6455861B1 (en) * | 1998-11-24 | 2002-09-24 | Cambridge Research & Instrumentation, Inc. | Fluorescence polarization assay system and method |
-
2000
- 2000-07-21 US US09/621,248 patent/US6603546B1/en not_active Expired - Lifetime
-
2001
- 2001-07-17 CA CA002353221A patent/CA2353221A1/en not_active Abandoned
- 2001-07-18 EP EP05077523A patent/EP1630547A1/en not_active Withdrawn
- 2001-07-18 EP EP01306195A patent/EP1174706A3/en not_active Withdrawn
- 2001-07-23 JP JP2001221252A patent/JP2002071567A/en active Pending
-
2003
- 2003-06-04 US US10/454,875 patent/US6794659B2/en not_active Expired - Lifetime
Cited By (15)
| Publication number | Priority date | Publication date | Assignee | Title |
|---|---|---|---|---|
| EP1593957A4 (en) * | 2003-02-13 | 2006-04-26 | Hamamatsu Photonics Kk | Fluorescent correlated spectrometric analysis device |
| US7400396B2 (en) | 2003-02-13 | 2008-07-15 | Hamanatsu Photonics K.K. | Fluorescent correalated spectrometric analysis device |
| US7737389B2 (en) | 2003-02-13 | 2010-06-15 | Hamamatsu Photonics K.K. | Image pickup device including photodetection surface and transfer control arrangement |
| WO2005012857A1 (en) * | 2003-08-01 | 2005-02-10 | Consejo Superior De Investigaciones Científicas | Apparatus for simultaneous or consecutive characterization of multiple solid material samples by photoluminescence |
| ES2223296A1 (en) * | 2003-08-01 | 2005-02-16 | Universidad Politecnica De Valencia | Apparatus for simultaneous or consecutive characterization of multiple solid material samples by photoluminescence |
| ES2223296B1 (en) * | 2003-08-01 | 2005-12-16 | Universidad Politecnica De Valencia | AN APPLIANCE FOR THE SIMULTANEOUS OR CONSECUTIVE CHARACTERIZATION OF MULTIPLE SAMPLES OF SOLID MATERIALS BY PHOTOLUMINISCENCE. |
| WO2015004046A1 (en) * | 2013-07-08 | 2015-01-15 | Fraunhofer-Gesellschaft zur Förderung der angewandten Forschung e.V. | Method for identifying and quantifying emitting particles in systems |
| CN105518438A (en) * | 2013-07-08 | 2016-04-20 | 弗劳恩霍弗应用技术研究院 | Method and apparatus for producing bulk silicon carbide from a silicon carbide precursor |
| CN105518438B (en) * | 2013-07-08 | 2019-01-15 | 弗劳恩霍弗应用技术研究院 | For identification with the method for the radion in quantization system |
| US10928294B2 (en) | 2013-07-08 | 2021-02-23 | Fraunhofer-Gesellschaft | Method for identifying and quantifying of emitting particles in systems |
| CN104597020A (en) * | 2015-02-02 | 2015-05-06 | 中国科学院光电研究院 | Multifunctional optical material testing device |
| CN104597020B (en) * | 2015-02-02 | 2018-04-27 | 中国科学院光电研究院 | A kind of multifunctional optical material test device |
| CN107607505A (en) * | 2017-09-05 | 2018-01-19 | 重庆民泰香料化工有限责任公司 | A kind of method of testing of AFS detection circuit |
| CN107607505B (en) * | 2017-09-05 | 2020-06-02 | 重庆民泰香料化工有限责任公司 | Test method of atomic fluorescence spectrometer detection circuit |
| CN112782131A (en) * | 2019-11-11 | 2021-05-11 | 成都辰显光电有限公司 | Spectrum detection system and spectrum detection method |
Also Published As
| Publication number | Publication date |
|---|---|
| US20030206297A1 (en) | 2003-11-06 |
| US6603546B1 (en) | 2003-08-05 |
| CA2353221A1 (en) | 2002-01-21 |
| EP1174706A3 (en) | 2004-07-07 |
| US6794659B2 (en) | 2004-09-21 |
| EP1630547A1 (en) | 2006-03-01 |
| JP2002071567A (en) | 2002-03-08 |
Similar Documents
| Publication | Publication Date | Title |
|---|---|---|
| US6794659B2 (en) | Rapid high throughput spectrometer and method | |
| Eggeling et al. | Data registration and selective single-molecule analysis using multi-parameter fluorescence detection | |
| US6376843B1 (en) | Method of characterizing fluorescent molecules or other particles using generating functions | |
| Müller et al. | [4] Fluorescence correlation spectroscopy | |
| EP1254362B1 (en) | Fluorescence intensity and lifetime distribution analysis | |
| US6965113B2 (en) | Fluorescence intensity multiple distributions analysis: concurrent determination of diffusion times and molecular brightness | |
| US5815262A (en) | Apparatus for parallelized two-photon fluorescence correlation spectroscopy (TPA-FCS), and the use thereof for screening active compounds | |
| US11181480B2 (en) | Raman spectroscopy for minerals identification | |
| Periasamy et al. | FLIM microscopy in biology and medicine | |
| EP0836090A1 (en) | Method of analysis of samples by determination of the distribution of specific brightnesses of particles | |
| US5422719A (en) | Multi-wave-length spectrofluorometer | |
| US10942120B2 (en) | High throughput method and apparatus for measuring multiple optical properties of a liquid sample | |
| US20040099813A1 (en) | Method for characterizing samples of secondary light emitting particles | |
| US9759659B2 (en) | Method for detecting the impacts of interfering effects on experimental data | |
| JPH0915156A (en) | Spectroscopic measuring method and measuring apparatus | |
| US20080192249A1 (en) | Portable Device and Method for On-Site Detection and Quantification of Drugs | |
| EP1019687B1 (en) | A method for characterizing samples by determination of a function of at least one specific physical property of particles of said sample | |
| EP1254353B1 (en) | Fluorescence intensity multiple distributions analysis: concurrent determination of diffusion times and molecular brightness | |
| Chen | Analysis and applications of fluorescence fluctuation spectroscopy | |
| CLEGG | Fluorescence Lifetime-Resolved Image: What, Why, How-A Prologue | |
| EP1481236B1 (en) | A method for detecting the impacts of interfering effects on experimental data | |
| Martin-Fernandez et al. | Subnanosecond polarized microfluorimetry in the time domain: An instrument for studying receptor trafficking in live cells | |
| EP1063502A1 (en) | A method of characterizing fluorescent molecules or other particles using generating functions | |
| JPH09145619A (en) | Spectroscopic measurement method and device for scattered light, etc. | |
| Buehler et al. | The Integration of Single Molecule Detection Technologies into Miniaturized Drug Screening: Current Status and Future Perspectives |
Legal Events
| Date | Code | Title | Description |
|---|---|---|---|
| PUAI | Public reference made under article 153(3) epc to a published international application that has entered the european phase |
Free format text: ORIGINAL CODE: 0009012 |
|
| 17P | Request for examination filed |
Effective date: 20010803 |
|
| AK | Designated contracting states |
Kind code of ref document: A2 Designated state(s): AT BE CH CY DE DK ES FI FR GB GR IE IT LI LU MC NL PT SE TR |
|
| AX | Request for extension of the european patent |
Free format text: AL;LT;LV;MK;RO;SI |
|
| RIC1 | Information provided on ipc code assigned before grant |
Ipc: 7G 01N 21/25 B Ipc: 7G 01N 21/64 A |
|
| PUAL | Search report despatched |
Free format text: ORIGINAL CODE: 0009013 |
|
| AK | Designated contracting states |
Kind code of ref document: A3 Designated state(s): AT BE CH CY DE DK ES FI FR GB GR IE IT LI LU MC NL PT SE TR |
|
| AX | Request for extension of the european patent |
Extension state: AL LT LV MK RO SI |
|
| AKX | Designation fees paid |
Designated state(s): AT BE CH CY DE DK ES FI FR GB GR IE IT LI LU MC NL PT SE TR |
|
| 17Q | First examination report despatched |
Effective date: 20050506 |
|
| STAA | Information on the status of an ep patent application or granted ep patent |
Free format text: STATUS: THE APPLICATION IS DEEMED TO BE WITHDRAWN |
|
| 18D | Application deemed to be withdrawn |
Effective date: 20051117 |