EP1162572A2 - Method and system for evaluating orientation of molecular array - Google Patents
Method and system for evaluating orientation of molecular array Download PDFInfo
- Publication number
- EP1162572A2 EP1162572A2 EP01304956A EP01304956A EP1162572A2 EP 1162572 A2 EP1162572 A2 EP 1162572A2 EP 01304956 A EP01304956 A EP 01304956A EP 01304956 A EP01304956 A EP 01304956A EP 1162572 A2 EP1162572 A2 EP 1162572A2
- Authority
- EP
- European Patent Office
- Prior art keywords
- features
- molecular array
- array
- images
- feature
- Prior art date
- Legal status (The legal status is an assumption and is not a legal conclusion. Google has not performed a legal analysis and makes no representation as to the accuracy of the status listed.)
- Granted
Links
Images













Classifications
-
- G—PHYSICS
- G06—COMPUTING OR CALCULATING; COUNTING
- G06V—IMAGE OR VIDEO RECOGNITION OR UNDERSTANDING
- G06V10/00—Arrangements for image or video recognition or understanding
- G06V10/70—Arrangements for image or video recognition or understanding using pattern recognition or machine learning
- G06V10/74—Image or video pattern matching; Proximity measures in feature spaces
- G06V10/75—Organisation of the matching processes, e.g. simultaneous or sequential comparisons of image or video features; Coarse-fine approaches, e.g. multi-scale approaches; using context analysis; Selection of dictionaries
- G06V10/751—Comparing pixel values or logical combinations thereof, or feature values having positional relevance, e.g. template matching
-
- G—PHYSICS
- G06—COMPUTING OR CALCULATING; COUNTING
- G06T—IMAGE DATA PROCESSING OR GENERATION, IN GENERAL
- G06T7/00—Image analysis
- G06T7/70—Determining position or orientation of objects or cameras
- G06T7/73—Determining position or orientation of objects or cameras using feature-based methods
-
- G—PHYSICS
- G06—COMPUTING OR CALCULATING; COUNTING
- G06V—IMAGE OR VIDEO RECOGNITION OR UNDERSTANDING
- G06V20/00—Scenes; Scene-specific elements
- G06V20/50—Context or environment of the image
-
- G—PHYSICS
- G06—COMPUTING OR CALCULATING; COUNTING
- G06T—IMAGE DATA PROCESSING OR GENERATION, IN GENERAL
- G06T2207/00—Indexing scheme for image analysis or image enhancement
- G06T2207/20—Special algorithmic details
- G06T2207/20068—Projection on vertical or horizontal image axis
-
- G—PHYSICS
- G06—COMPUTING OR CALCULATING; COUNTING
- G06T—IMAGE DATA PROCESSING OR GENERATION, IN GENERAL
- G06T2207/00—Indexing scheme for image analysis or image enhancement
- G06T2207/30—Subject of image; Context of image processing
- G06T2207/30004—Biomedical image processing
- G06T2207/30072—Microarray; Biochip, DNA array; Well plate
-
- G—PHYSICS
- G06—COMPUTING OR CALCULATING; COUNTING
- G06V—IMAGE OR VIDEO RECOGNITION OR UNDERSTANDING
- G06V2201/00—Indexing scheme relating to image or video recognition or understanding
- G06V2201/04—Recognition of patterns in DNA microarrays
Definitions
- radiometric or optical analysis of the molecular array produces a scanned image consisting of a two-dimensional matrix, or grid, of pixels, each pixel having one or more intensity values corresponding to one or more signals.
- Scanned images are commonly produced electronically by optical or radiometric scanners and the resulting two-dimensional matrix of pixels is stored in computer memory or on a non-volatile storage device.
- analog methods of analysis such as photography, can be used to produce continuous images of a molecular array that can be then digitized by a scanning device and stored in computer memory or in a computer storage device.
- Figure 1 shows a generalized representation of a molecular array.
- Disk-shaped features of the molecular array such as feature 101, are arranged on the surface of the molecular array in rows and columns that together comprise a two-dimensional matrix, or grid.
- Features in alternative types of molecular arrays may be arranged to cover the surface of the molecular array at higher densities, as, for example, by offsetting the features in adjacent rows to produce a more closely packed arrangement of features.
- Radiometric or optical analysis of a molecular array, following a hybridization experiment results in a two-dimensional matrix, or grid, of pixels.
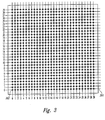
- Figure 2 illustrates the two-dimensional grid of pixels in a square area of a scanned image encompassing feature 101 of Figure 1.
- This actual result is compared with an expected result which would be obtained if the second pattern had a predetermined orientation on the array (for example, superimposed over at least part of the array).
- An actual array orientation may be evaluated based upon the results of the comparison. For example, if there is more than a predetermined difference (a "tolerance") between the actual and expected results, this could be taken as an indication that the array does not have the expected orientation in a scanner.
- a predetermined difference a "tolerance”
- the orientation of the second pattern on the array can be altered and the comparison step repeated, and these comparison and second pattern re-orientation steps repeated in further iterations as often as necessary until the actual and expected results are within the predetermined difference (at which point the actual and expected orientations should be the same, within the predetermined tolerance ).
- the greater the points on the second pattern the greater the accuracy of the orientation information that can generally be obtained from the comparison.
- the second pattern may be a rectilinear grid of rows and columns which would lie on the rows and columns of the rectilinear grid of the array when the second pattern and array are superimposed.
- the calculation may be a function executed along the rows and columns of the second pattern (for example, to obtain row and column vectors). The actual result may be compared to the expected result quantitatively or only qualitatively.
- the refined coordinate system is employed to locate the positions of weak features and the positions of the background regions local to each feature.
- a process is used to analyze various different signals generated by different analytical methods in order to select the most reliable portions of each feature and the local background surrounding the feature for subsequent signal extraction and signal variability determinations.
- the fluorescence of hybridized labeled molecules may be measured at green light wavelengths and at red light wavelengths, with the intensities produced at each position of the surface of the molecular array at red and green wavelengths corresponding to two different signals.
- signal data and variability of signal data are extracted from the reliable regions of each feature and each local background region of the scanned image.
- a weighted summation could be used at those locations on the second pattern which will be superimposed on reference marks or features with expected stronger signals (such as control features) relative to other features, when the second pattern and array are superimposed.
- reference marks can be detected and an orientation of the array (such as rotational orientation) can be evaluated based on the detected positions of the reference marks.
- an approximate indication of array orientation can be based on the detected positions of the reference marks followed by further evaluating a refined array orientation using the above described comparison and re-orientation procedure, such that fewer iterations of the comparison and second pattern re-orientation procedure may be required.
- Automated feature extraction includes: (1) a determination of the approximate positions of the features, for example by determining the positions of corner features within the scanned image; (2) generation of an initial coordinate system for the scanned image, for example, by using the positions of corner features, or by alternative means, including using mechanically precise positioning of features on the molecular array and of the molecular on the detection device and by using fiducial reference marks incorporated in the molecular array and detected independently, but in spatial alignment with detection of chemical features, and refinement of the initial coordinate system to produce a refined coordinate system; (3) determination of reliable regions of the scanned image from which to extract signal data; (4) and extraction of signal data from the features and local background regions of the scanned image of the molecular array.
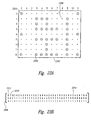
- Figure 4 illustrates an initial step in the determination of the positions of corner features of a scanned image of a molecular array.
- the scanned image of the molecular array 402 is represented in Figure 4 as a grid of pixels, with the higher-intensity pixels corresponding to features illustrated as dark circles, such as the disk-shaped group of pixels 404 corresponding to a corner feature.
- the intensity values of the pixels are projected horizontally to form a row vector 406 and are projected vertically to produce a column vector 408.
- the row vector 406 is illustrated as a two-dimensional graph, where the total projected intensity value is plotted in the vertical direction 409 and the position of each row of pixels is plotted in the horizontal direction 410.
- Figure 5 illustrates a numerical calculation of a portion of the column vector corresponding to a single feature.
- a column vector is calculated for all features, as described in the above paragraph, and contains a number of peaks.
- Figure 5 shows pixel intensity values for a single feature, and the method of column vector calculation will therefore produce a single peak corresponding to the single feature.
- Figure 5 shows a grid of pixels 502 representing a square region of a scanned image encompassing a single feature. The intensity values of all the pixels in each column of the grid of pixels 502 are summed, and the sums are entered into the linear array 504.
- column 506 includes four non-zero pixels having intensity values of: 1,1,2, and 1.
- the different signals for each feature are processed in order to select strong features and to then refine the initial feature coordinate grid based on the positions of the strong features.
- blob analysis is conducted, as discussed above with reference to Figures 16-20, to produce refined pixel coordinates for the center of the feature for each signal along with the size of the blob used to produce the refined coordinates.
- the initial position of the feature is estimated from the initial feature coordinate grid. If, based on the original feature coordinate grid, the refined position for the feature is less than some constant distance from the estimated feature position and the size of the blob determined by blob analysis is greater than a minimum threshold value and less than a maximum threshold value, then the feature is considered to be a strong feature.
- the transformation may be applied to any set of features, such as G, the index matrix for the set of all features in the grid.
- G the index matrix for the set of all features in the grid.
- Selection of a set of pixels for signal extraction for a feature may be accomplished by removing, or disregarding, outlier pixels from the initial set of pixels within the selected region.
- Removal of outlier pixels from a feature occurs through the following process: (1) construction of an initial inlier binary mask in which pixels of the feature have corresponding values of either 1 or 0, and all pixels within the selected region are initialized to have value 1, while all other pixels are initialized to have the value 0; (2) for each signal, identification of any outlier pixels within the selected region having intensity values outside of an acceptable range and setting of the corresponding values for those outlier pixels to 0 in the inlier mask; (3) for each possible pair of signals, identification of any pixels within the selected region for which the ratio of the intensity values for the signals of the pair of signals fall outside of an acceptable range and setting of the corresponding values in the inlier binary mask to 0; and (4) selection of those pixels whose corresponding values in the inlier mask have the value 1 as the signal extraction pixels for the feature.
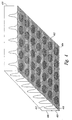
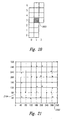
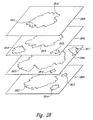
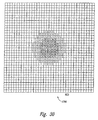
- Figure 28 illustrates the above-described technique for outlier rejection.
- plane 2802 represents the green signal intensity values for a region of interest surrounding a feature
- plane 2804 represents the red signal intensity values for the same region of interest
- plane 2806 represents the ratio of the green to red signal intensity values
- plane 2808 represents the inlier mask corresponding to the region of interest.
- the process of outlier rejection can be considered as a process of setting the value of a pixel in the inlier mask 2808 to "1," if that pixel falls within acceptable ranges of intensity values in the green signal plane 2802 and red signal plane 2804 as well as within acceptable range of values of green to red signal ratios in the green to red signal ratio plane 2806. Acceptable ranges can be based on the standard deviation of the pixels comprising the feature.
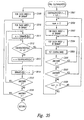
- Figure 35 illustrates the routine "find equivalences.” This routine transforms the partially partitioned binmap into a fully partitioned binmap. Essentially, the routine "find equivalences" identifies pairs of contiguous blobs and coalesces them into a single blob having a blob number equal to the lowest of the blob numbers of the two blobs of the pair. Contiguous blobs may arise for irregularly shaped blobs having, for example, arms separated by elements of 0 value within the map "binmap.”
- step 3502 the routine " find equivalences” sets the variable "num” to the value "0.” If, following execution of the for -loop comprising steps 3503-3507, the variable “num” still has the value "0,” as detected in step 3508, then all pairs of equivalent blobs have been identified and resolved.
- the for -loop comprising steps 3503-3507 sets the indices "i” and “j” to all possible index pairs "(i,j)" for elements in binmap , and the routine "set equivalence,” to be described below with reference to Figure 36, is called in step 3505 for each binmap element.
- Figure 36 is a flow-control diagram for the routine "set equivalence,” called in step 3505 of Figure 35.
- This routine comprises a complex Boolean expression that detects whether a binmap element is adjacent either to a previous element in its row or a previous element in its column, and, if so, sets an equivalence relationship in the array " equivalences" to reflect the fact that the blobs to which the two considered binmap elements belong are equivalent. If an equivalence is detected, then the variable "num” is incremented, in step 3610, in order to cause an additional iteration of the nested for -loops comprising steps 3503-3507 of Figure 35.
- step 3606 the routine " set equivalence” determines whether a previous, adjacent binmap element in the same row as the currently considered binmap element has a different non-zero value than the currently considered binmap element and, if so, sets an element of the array "equivalences" to reflect the equivalence of the two blobs to which the two elements belong in steps 3607-3609.
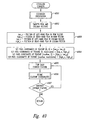
- Figure 37 is a flow-control diagram for the routine " find blob.”
- the routine "find blob” finds the closest blob to the unrefined coordinates of the center of the feature that is greater than a threshold size, and then refines the feature coordinates to correspond to the coordinates of the centroid of the blob by calling the routine "set feature coordinates" in step 3709.
- the routine "find blob” counts the number of pixels, or binmap elements, in each blob and stores the counts in the array "groups” in steps 3701-3704.
- the routine " find blob” selects a threshold value from one of the values stored in the array "groups” in step 3705. The selection of the threshold value may be based on any number of different criteria, as discussed above.
- the routine "set feature coordinates” makes the determination in step 3801 and, if the blob is not acceptable, sets an indication to indicate that the feature is weak in step 3802 and then returns. Otherwise, in steps 3803-3806, the routine "set feature coordinates” accumulates the x and y coordinates of each element of the blob in the variables "mx" and "my” and then, in step 3807, calculates the refined coordinates of the center of the feature as the coordinates of the centroid of the blob. In step 3808, the routine "set feature coordinates” sets an indication that the feature is strong, and then returns. In either the case that the strong or weak feature, the return value passed back by the routine " set feature coordinates" is the number of pixels or binmap element in the blob. The value is passed back through the routine " find blob” to the routine "refine feature coordinates," from which it is passed back to the code calling the routine " find feature coordinates.”
- such information may be information on genes which are associated with one or more polynucleotide features on an array (for example, an identification of genes potentially responsible for an observed signal pattern from array features).
- error information or "error maps” being replaced with any one or more of "array layout information", "second pattern information” or "genetic information associated with a set of one or more features”.
Landscapes
- Engineering & Computer Science (AREA)
- Theoretical Computer Science (AREA)
- Physics & Mathematics (AREA)
- General Physics & Mathematics (AREA)
- Computer Vision & Pattern Recognition (AREA)
- Multimedia (AREA)
- Computing Systems (AREA)
- Artificial Intelligence (AREA)
- Health & Medical Sciences (AREA)
- Databases & Information Systems (AREA)
- Evolutionary Computation (AREA)
- General Health & Medical Sciences (AREA)
- Medical Informatics (AREA)
- Software Systems (AREA)
- Image Analysis (AREA)
- Testing Or Measuring Of Semiconductors Or The Like (AREA)
Abstract
Description

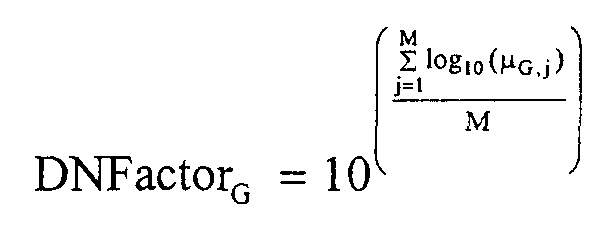
there are matrices:


Thus,
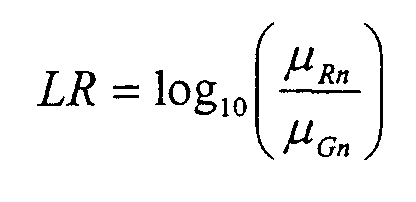


Claims (25)
- A method, embodied in a computer program, for automated extraction of data from a molecular array having features arranged in a regular pattern, the method comprising:receiving a number of images of the molecular array, each produced by scanning the molecular array to determine intensities of data signals emanating from discrete positions on a surface of the molecular array;estimating initial positions of selected marker features within an image of the molecular array;calculating refined positions of the selected marker features within the image of the molecular array;using the refined positions of the selected marker features to computer an initial coordinate system for locating features of the molecular array in the number of images of the molecular array;using the initial coordinate system to locate positions of strong features within one or more images of the molecular array;refining the positions of strong features within the one or more images of the molecular array by analyzing data signal intensity values in regions of the one or more images of the molecular array that contain the strong features;using the refined positions of strong features in the one or more images of the molecular array to calculate a refined coordinate system to locate positions of weak features within the number of images of the molecular array;using the refined positions of strong features in the one or more images of the molecular array to calculate a refined coordinate system to locate positions of local background regions surrounding all strong and weak features within the number of images of the molecular array; andextracting data from strong features, and their respective local background regions, within the number of images of the molecular array using the refined positions of strong features within the number of images of the molecular array and extracting data from work features, and their respective local background regions, within the number of images of the molecular array using locations for the weak features calculated from the refined coordinate system.
- The method of claim 1 wherein data signals emanating from discrete positions on the surface of the molecular array include:fluorescent emission from fluorophores incorporated into molecules bound to features of the molecular array;radiation emitted by radioisotopes incorporated into molecules bound to features of the molecular array; andlight emission from chemoluminescent moieties incorporated into molecules bound to features of the molecular array.
- The method of claim 1 wherein each image of the number of images comprises an array of pixels, each pixel having a data signal intensity value.
- The method of claim 3 wherein the features of the molecular array are arranged in a rectilinear grid, wherein corner features are selected as marker features, and wherein estimating initial positions of selected marker features within an image of the molecular array includes:calculating row and column vectors by considering the values of pixels in rows and columns of the image;determining a first and last peak in the row and column vectors; andusing pixel coordinates of the first and last peaks in the row vector to determine horizontal coordinates of the corner features and using pixel coordinates of the first and last peaks in the column vector to determine vertical coordinates of the corner features.
- The method of claim 4 wherein row and column vectors are calculated for various orientations of an image produced by scanning the molecular array, and the orientation at which the column and row vectors have sharpest and most distinct peaks is selected as the orientation for subsequent calculations.
- The method of claim 3 wherein calculating refined positions of the selected marker features within the image of the molecular array includes:
for each selected marker feature,creating a binary image of the selected marker feature; andusing blob analysis to determine refined pixel coordinates for the feature. - The method of claim 6 wherein the binary image is generated by:creating a histogram of intensity values within an inner region of interest that contains pixels corresponding to the feature;selecting an intensity value as a threshold value from the histogram based on a ratio of a number of pixels having an intensity value greater than the threshold value divided by a total number of pixels within the inner region of interest; andfor each pixel in the binary image, setting the value of the pixel to 1 if the intensity value of a corresponding pixel in the image is greater than or equal to the threshold value, and setting the value of the pixel to 0 if the intensity value of the corresponding pixel in the image is less than the threshold value.
- The method of claim 6 wherein the binary image is generated by:determining a median intensity value and standard deviation of intensity values of pixels within an outer region of interest that contains the pixels corresponding to the feature;selecting as a threshold value an intensity value that is a number of standard deviations greater than the median intensity value;for each pixel in the binary image, setting the value of the pixel to 1 if the intensity value of a corresponding pixel in the image is greater than or equal to the threshold value, and setting the value of the pixel to 0 if the intensity value of the corresponding pixel in the image is less than the threshold value.
- The method of claim 3 wherein a strong feature is a feature for which a largest blob produced during blob analysis of the feature is greater than or equal to a minimal size and less than a maximum size and located within a threshold distance from a center position of the feature estimated from the initial coordinate system.
- The method of claim 9 wherein blob analysis is used to refine the positions of strong features and their respective local background regions within the one or more images of the molecular array by analyzing data signal values in regions of the one or more images of the molecular array that contain the strong features.
- The method of claim 3 wherein linear regression analysis is used to calculate a refined coordinate system to locate positions of weak features and their respective local background regions within the number of images of the molecular array.
- The method of claim 11 wherein the linear regression analysis is carried out using two matrix multiplication steps, in a first step calculating a coefficient matrix by multiplying together a transpose of a pseudo-inverse of a strong matrix containing indices of strong features with a centroid matrix containing coordinates of centroids of strong features, and in the second step calculating a fit positions matrix by multiplying together a transposed feature indices matrix and the coefficient matrix calculated in the first step.
- The method of claim 1 wherein extracting data from strong features, and their respective local background regions, within the number of images of the molecular array using the refined positions of strong features within the number of images of the molecular array and extracting data from weak features, and their respective local background regions, within the number of images of the molecular array using locations for the weak features calculated from the refined coordinate system includes:determining which pixels are included in the extraction of signal from each feature or local background region using statistical methods for pixel outlier identification;determining averages and variances of data signal intensities for features of the molecular array and covariances for one or more pairs of data signal intensities;determining averages and variances for background data signal intensities;determining background-subtracted averages and variances of data signal intensities for features of the molecular array and background-subtracted covariances for one or more pairs of data signal intensities;normalizing the data signal intensities, averages, and variances; andcalculating ratios and variances of ratios of pairs of normalized data intensity signals.
- A system for automated extraction of data from a molecular array having features arranged in a regular pattern, the system comprising:a scanning component that produces images of the molecular array representing intensities of data signals emitted from discrete positions on a surface of the molecular array;a computer program that processes the images of the molecular array produced by the scanning component to index features in the images of the molecular array corresponding to molecules bound to features of the molecular array and that extracts data from the indexed features within images of the molecular array; anda computer for executing the computer program.
- The system of claim 14 wherein data signal intensities emanating from discrete positions on the surface of the molecular array include:radiation emitted by radioisotopes incorporated into molecules bound to features of the molecular array;fluorescent emission from fluorophores incorporated into molecules bound to features of the molecular array; and/orlight emission from chemoluminescent moieties incorporated into molecules bound to features of the molecular array.
- The system of claim 14 wherein the computer program processes the images of the molecular array and extracts data from indexed features within images of the molecular array by:receiving a number of images of the molecular array produced by the scanning component;estimating initial positions of selected marker features within an image of the molecular array;calculating refined positions of the selected marker features within the image of the molecular array;using the refined positions of the selected marker features to compute an initial coordinate system for locating features of the moleular array in the number of images of the molecular array;using the initial coordinate system to locate positions of strong features within one or more images of the molecular array;refining the positions of strong features within the one or more images of the molecular array by analyzing data signal intensity values in regions of the one or more images of the molecular array that contain the strong features;using the refined positions of strong features in the one or more images of the molecular array to calculate a refined coordinate system to locate positions of weak features within the number of images of the molecular array;using the refined positions of strong features in the one or more images of the molecular array to calculate a refined coordinate system to locate positions of local background regions surrounding all strong and weak features within the number of images of the molecular array; andextracting data from strong features, and their respective local background regions, within the number of images of the molecular array using the refined positions of strong features within the number of images of the molecular array and extracting data from weak features, and their respective local background regions, within the number of images of the molecular array using locations for the weak features calculated from the refined coordinate system.
- The system of claim 16 wherein the computer program calculates background-subtracted averages, background-subtracted variances, and background-subtracted confidence intervals for data signal intensities integrated over features in the images corresponding to features of the molecular array.
- The system of claim 16 wherein the computer program calculates background-subtracted averages, background-subtracted variances, and background-subtracted confidence intervals for ratios of pairs of data signal intensities integrated over features in the images corresponding to features of the molecular array.
- A method of evaluating an orientation of a molecular array having features arranged in a pattern, including the steps of:(a) receiving an image of the molecular array produced by scanning the molecular array to determine data signals emanating from discrete positions on a surface of the molecular array;(b) calculating an actual result of a function on pixels of the image lying in a second pattern; and(c) comparing the result of step (b) with an expected result which would be obtained if the second pattern had a predetermined orientation on the array.
- A method according to claim 19, wherein:the features of the molecular array are arranged in a rectilinear grid and the pattern comprises a rectilinear grid of rows and columns; andstep (b) comprises calculating row and column vectors by summing pixels in the rows and columns.
- A method according to claim 19 or 20, including, when the results of the comparison in step (c) are outside a predetermined difference, the steps of altering the orientation of the second pattern on the array and repeating steps (b) and (c) until the results of the comparison are within the predetermined difference.
- A method according to claim 19, 20 or 21, including the steps of:
obtaining information on the array layout using a code associated with the array and constructing the second pattern based on the obtained array layout information. - A method according to claim 22, wherein the array layout information is obtained from a remote location.
- A method according to any of claims 19 to 23, wherein the orientation comprises rotational orientation.
- A system for evaluating an orientation of a molecular array having features arranged in a pattern, including:(a) means for receiving an image of the molecular array produced by scanning the molecular array to determine data signals emanating from discrete positions on a surface of the molecular array;(b) calculating means for calculating an actual result of a function on pixels of the image lying in a second pattern; and(c) comparing means for comparing the calculated result with an expected result which would be obtained if the second pattern had a predetermined orientation on the array.
Priority Applications (1)
| Application Number | Priority Date | Filing Date | Title |
|---|---|---|---|
| EP04014456A EP1494171B1 (en) | 2000-06-06 | 2001-06-06 | Method and system for evaluating orientation of molecular array |
Applications Claiming Priority (4)
| Application Number | Priority Date | Filing Date | Title |
|---|---|---|---|
| US09/589,046 US6591196B1 (en) | 2000-06-06 | 2000-06-06 | Method and system for extracting data from surface array deposited features |
| US589046 | 2000-06-06 | ||
| US09/659,415 US6768820B1 (en) | 2000-06-06 | 2000-09-11 | Method and system for extracting data from surface array deposited features |
| US659415 | 2000-09-11 |
Related Child Applications (1)
| Application Number | Title | Priority Date | Filing Date |
|---|---|---|---|
| EP04014456A Division EP1494171B1 (en) | 2000-06-06 | 2001-06-06 | Method and system for evaluating orientation of molecular array |
Publications (3)
| Publication Number | Publication Date |
|---|---|
| EP1162572A2 true EP1162572A2 (en) | 2001-12-12 |
| EP1162572A3 EP1162572A3 (en) | 2003-02-05 |
| EP1162572B1 EP1162572B1 (en) | 2006-03-15 |
Family
ID=27080435
Family Applications (1)
| Application Number | Title | Priority Date | Filing Date |
|---|---|---|---|
| EP01304956A Expired - Lifetime EP1162572B1 (en) | 2000-06-06 | 2001-06-06 | Method and system for automated extraction of data from a molecular array |
Country Status (3)
| Country | Link |
|---|---|
| US (1) | US7330606B2 (en) |
| EP (1) | EP1162572B1 (en) |
| DE (2) | DE60117930T2 (en) |
Cited By (10)
| Publication number | Priority date | Publication date | Assignee | Title |
|---|---|---|---|---|
| WO2003093810A1 (en) * | 2002-05-03 | 2003-11-13 | Vialogy Corporation | System and method for characterizing microarray output data |
| EP1450304A1 (en) * | 2003-02-21 | 2004-08-25 | City University of Hong Kong | Image processing apparatus and method |
| EP1473080A2 (en) * | 2003-04-30 | 2004-11-03 | Agilent Technologies, Inc. | Chemical array reading |
| US6993172B2 (en) | 2001-06-29 | 2006-01-31 | Agilent Technologies, Inc. | Method and system for automated outlying feature and outlying feature background detection during processing of data scanned from a molecular array |
| US7221785B2 (en) | 2002-05-21 | 2007-05-22 | Agilent Technologies, Inc. | Method and system for measuring a molecular array background signal from a continuous background region of specified size |
| US7302348B2 (en) | 2004-06-02 | 2007-11-27 | Agilent Technologies, Inc. | Method and system for quantifying and removing spatial-intensity trends in microarray data |
| US7353116B2 (en) | 2003-07-31 | 2008-04-01 | Agilent Technologies, Inc. | Chemical array with test dependent signal reading or processing |
| WO2008065634A1 (en) * | 2006-12-01 | 2008-06-05 | Koninklijke Philips Electronics N.V. | Method to automatically decode microarray images |
| EP1769424A4 (en) * | 2004-07-16 | 2011-01-26 | Bioarray Solutions Ltd | IMAGE PROCESSING AND ANALYSIS OF MATRIX DATA |
| US8009889B2 (en) | 2006-06-27 | 2011-08-30 | Affymetrix, Inc. | Feature intensity reconstruction of biological probe array |
Families Citing this family (18)
| Publication number | Priority date | Publication date | Assignee | Title |
|---|---|---|---|---|
| US5631734A (en) * | 1994-02-10 | 1997-05-20 | Affymetrix, Inc. | Method and apparatus for detection of fluorescently labeled materials |
| US7146062B2 (en) * | 2001-03-08 | 2006-12-05 | Clarient, Inc. | Apparatus and method for labeling rows and columns in an irregular array |
| DE10256114A1 (en) * | 2002-11-29 | 2004-06-09 | Giesecke & Devrient Gmbh | Method and device for checking documents of value |
| DE10346636A1 (en) * | 2003-10-08 | 2005-05-12 | Giesecke & Devrient Gmbh | Device and method for checking value documents |
| US9445025B2 (en) | 2006-01-27 | 2016-09-13 | Affymetrix, Inc. | System, method, and product for imaging probe arrays with small feature sizes |
| US8055098B2 (en) | 2006-01-27 | 2011-11-08 | Affymetrix, Inc. | System, method, and product for imaging probe arrays with small feature sizes |
| US7533313B1 (en) * | 2006-03-09 | 2009-05-12 | Advanced Micro Devices, Inc. | Method and apparatus for identifying outlier data |
| JP4241751B2 (en) * | 2006-03-30 | 2009-03-18 | 村田機械株式会社 | Scanner control device and scanner device |
| JP4143101B2 (en) * | 2006-08-10 | 2008-09-03 | アドバンスド・マスク・インスペクション・テクノロジー株式会社 | Specimen inspection apparatus, image alignment method, misregistration amount estimation method, and program |
| US8077951B2 (en) * | 2006-10-12 | 2011-12-13 | Agilent Technologies, Inc. | Method and system for dynamic, automated detection of outlying feature and feature background regions during processing of data scanned from a chemical array |
| US8446463B2 (en) | 2008-08-22 | 2013-05-21 | Genprime, Inc. | Apparatus, method and article to perform assays using assay strips |
| US8254724B2 (en) * | 2008-11-06 | 2012-08-28 | Bausch & Lomb Incorporated | Method and apparatus for making and processing aberration measurements |
| US8774494B2 (en) * | 2010-04-30 | 2014-07-08 | Complete Genomics, Inc. | Method and system for accurate alignment and registration of array for DNA sequencing |
| US8571306B2 (en) | 2011-08-10 | 2013-10-29 | Qualcomm Incorporated | Coding of feature location information |
| US9477890B2 (en) * | 2013-11-06 | 2016-10-25 | International Business Machines Corporation | Object detection using limited learned attribute ranges |
| US10576475B2 (en) | 2016-09-15 | 2020-03-03 | Genprime, Inc. | Diagnostic assay strip cassette |
| US10540562B1 (en) * | 2016-12-14 | 2020-01-21 | Revenue Management Solutions, Llc | System and method for dynamic thresholding for multiple result image cross correlation |
| EP4430380A4 (en) * | 2021-11-08 | 2026-01-07 | Eb Bio Consulting Inc | AUTOMATIC AND PARALLEL MICRONETRY IMAGE ANALYSIS |
Family Cites Families (15)
| Publication number | Priority date | Publication date | Assignee | Title |
|---|---|---|---|---|
| EP0380659A4 (en) * | 1987-10-02 | 1992-07-15 | Kabushiki Kaisha Komatsu Seisakusho | Method of recognizing linear pattern |
| US5001766A (en) * | 1988-05-16 | 1991-03-19 | At&T Bell Laboratories | Apparatus and method for skew control of document images |
| US5487115A (en) * | 1992-05-14 | 1996-01-23 | United Parcel Service | Method and apparatus for determining the fine angular orientation of bar code symbols in two-dimensional CCD images |
| JP2851023B2 (en) * | 1992-06-29 | 1999-01-27 | 株式会社鷹山 | IC tilt inspection method |
| US5916747A (en) | 1995-06-30 | 1999-06-29 | Visible Genetics Inc. | Method and apparatus for alignment of signals for use in DNA based-calling |
| US5837475A (en) | 1997-01-30 | 1998-11-17 | Hewlett-Packard Co. | Apparatus and method for scanning a chemical array |
| EP1002297A1 (en) * | 1997-08-07 | 2000-05-24 | Imaging Research, Inc. | A digital imaging system for assays in well plates, gels and blots |
| US6349144B1 (en) | 1998-02-07 | 2002-02-19 | Biodiscovery, Inc. | Automated DNA array segmentation and analysis |
| US6754375B1 (en) | 1999-07-16 | 2004-06-22 | Packard Bioscience Company | Method and system for interactively developing at least one grid pattern and computer-readable storage medium having a program for executing the method |
| US6362832B1 (en) | 1999-09-01 | 2002-03-26 | Packard Bioscience Company | Method and system for overlaying at least three microarray images to obtain a multicolor composite image |
| US6731781B1 (en) * | 1999-09-30 | 2004-05-04 | Biodiscovery, Inc. | System and method for automatically processing microarrays |
| US6571005B1 (en) | 2000-04-21 | 2003-05-27 | The Regents Of The University Of California | Feature extraction and normalization algorithms for high-density oligonucleotide gene expression array data |
| US6591196B1 (en) * | 2000-06-06 | 2003-07-08 | Agilent Technologies Inc. | Method and system for extracting data from surface array deposited features |
| US6498863B1 (en) | 2000-09-20 | 2002-12-24 | Media Cybernetics Inc. | Method, system, and product for analyzing a digitized image of an array to create an image of a grid overlay |
| US6993172B2 (en) * | 2001-06-29 | 2006-01-31 | Agilent Technologies, Inc. | Method and system for automated outlying feature and outlying feature background detection during processing of data scanned from a molecular array |
-
2001
- 2001-06-06 DE DE60117930T patent/DE60117930T2/en not_active Expired - Fee Related
- 2001-06-06 DE DE60124598T patent/DE60124598T2/en not_active Expired - Fee Related
- 2001-06-06 EP EP01304956A patent/EP1162572B1/en not_active Expired - Lifetime
-
2004
- 2004-07-19 US US10/894,943 patent/US7330606B2/en not_active Expired - Fee Related
Cited By (14)
| Publication number | Priority date | Publication date | Assignee | Title |
|---|---|---|---|---|
| US6993172B2 (en) | 2001-06-29 | 2006-01-31 | Agilent Technologies, Inc. | Method and system for automated outlying feature and outlying feature background detection during processing of data scanned from a molecular array |
| US7466851B2 (en) | 2002-05-03 | 2008-12-16 | Vialogy Llc | Technique for extracting arrayed data |
| US7006680B2 (en) * | 2002-05-03 | 2006-02-28 | Vialogy Corp. | System and method for characterizing microarray output data |
| WO2003093810A1 (en) * | 2002-05-03 | 2003-11-13 | Vialogy Corporation | System and method for characterizing microarray output data |
| US7221785B2 (en) | 2002-05-21 | 2007-05-22 | Agilent Technologies, Inc. | Method and system for measuring a molecular array background signal from a continuous background region of specified size |
| EP1450304A1 (en) * | 2003-02-21 | 2004-08-25 | City University of Hong Kong | Image processing apparatus and method |
| EP1473080A2 (en) * | 2003-04-30 | 2004-11-03 | Agilent Technologies, Inc. | Chemical array reading |
| US7353116B2 (en) | 2003-07-31 | 2008-04-01 | Agilent Technologies, Inc. | Chemical array with test dependent signal reading or processing |
| US7302348B2 (en) | 2004-06-02 | 2007-11-27 | Agilent Technologies, Inc. | Method and system for quantifying and removing spatial-intensity trends in microarray data |
| EP1769424A4 (en) * | 2004-07-16 | 2011-01-26 | Bioarray Solutions Ltd | IMAGE PROCESSING AND ANALYSIS OF MATRIX DATA |
| US8009889B2 (en) | 2006-06-27 | 2011-08-30 | Affymetrix, Inc. | Feature intensity reconstruction of biological probe array |
| US9147103B2 (en) | 2006-06-27 | 2015-09-29 | Affymetrix, Inc. | Feature intensity reconstruction of biological probe array |
| WO2008065634A1 (en) * | 2006-12-01 | 2008-06-05 | Koninklijke Philips Electronics N.V. | Method to automatically decode microarray images |
| US8199991B2 (en) | 2006-12-01 | 2012-06-12 | Koninklijke Philips Electronics N.V. | Method to automatically decode microarray images |
Also Published As
| Publication number | Publication date |
|---|---|
| DE60124598D1 (en) | 2006-12-28 |
| DE60117930T2 (en) | 2006-10-05 |
| DE60124598T2 (en) | 2007-09-06 |
| US7330606B2 (en) | 2008-02-12 |
| US20040264807A1 (en) | 2004-12-30 |
| DE60117930D1 (en) | 2006-05-11 |
| EP1162572B1 (en) | 2006-03-15 |
| EP1162572A3 (en) | 2003-02-05 |
Similar Documents
| Publication | Publication Date | Title |
|---|---|---|
| US6768820B1 (en) | Method and system for extracting data from surface array deposited features | |
| EP1162572B1 (en) | Method and system for automated extraction of data from a molecular array | |
| US7006927B2 (en) | Method and system for extracting data from surface array deposited features | |
| US7317820B2 (en) | System and method for automatically identifying sub-grids in a microarray | |
| US8180154B2 (en) | Method and apparatus for region-based segmentation image processing using region mapping | |
| US6731781B1 (en) | System and method for automatically processing microarrays | |
| Brändle et al. | Robust DNA microarray image analysis | |
| US6633659B1 (en) | System and method for automatically analyzing gene expression spots in a microarray | |
| EP1450304A1 (en) | Image processing apparatus and method | |
| US7099502B2 (en) | System and method for automatically processing microarrays | |
| CN109872308B (en) | Method for correcting droplet position between droplet type digital PCR channels | |
| US20020150935A1 (en) | Dotted micro-array data extraction method | |
| EP2089831B1 (en) | Method to automatically decode microarray images | |
| EP2761593B1 (en) | Methods and systems for background subtraction in an image | |
| Braendle et al. | Generic and robust approach for the analysis of spot array images | |
| EP1224612B1 (en) | Centroid integration | |
| US20080123898A1 (en) | System and Method for Automatically Analyzing Gene Expression Spots in a Microarray | |
| US20040241670A1 (en) | Method and system for partitioning pixels in a scanned image of a microarray into a set of feature pixels and a set of background pixels | |
| Brändle et al. | Automatic grid fitting for genetic spot array images containing guide spots | |
| Demirkaya et al. | Segmentation of microarray cDNA spots using MRF-based method | |
| Larese et al. | Automatic spot addressing in cDNA microarray images | |
| WO2024200285A1 (en) | Method for providing an analysis of partition image data | |
| Sterpone | A novel dual-core architecture for the analysis of DNA microarray images | |
| US20050281462A1 (en) | System and method of automated processing of multiple microarray images | |
| Brändle et al. | Fully automatic grid fitting for genetic spot array images containing guide spots |
Legal Events
| Date | Code | Title | Description |
|---|---|---|---|
| PUAI | Public reference made under article 153(3) epc to a published international application that has entered the european phase |
Free format text: ORIGINAL CODE: 0009012 |
|
| AK | Designated contracting states |
Kind code of ref document: A2 Designated state(s): AT BE CH CY DE DK ES FI FR GB GR IE IT LI LU MC NL PT SE TR |
|
| AX | Request for extension of the european patent |
Free format text: AL;LT;LV;MK;RO;SI |
|
| PUAL | Search report despatched |
Free format text: ORIGINAL CODE: 0009013 |
|
| AK | Designated contracting states |
Designated state(s): AT BE CH CY DE DK ES FI FR GB GR IE IT LI LU MC NL PT SE TR |
|
| AX | Request for extension of the european patent |
Extension state: AL LT LV MK RO SI |
|
| 17P | Request for examination filed |
Effective date: 20030805 |
|
| AKX | Designation fees paid |
Designated state(s): DE FR GB |
|
| 17Q | First examination report despatched |
Effective date: 20040510 |
|
| GRAP | Despatch of communication of intention to grant a patent |
Free format text: ORIGINAL CODE: EPIDOSNIGR1 |
|
| RTI1 | Title (correction) |
Free format text: METHOD AND SYSTEM FOR AUTOMATED EXTRACTION OF DATA FROM A MOLECULAR ARRAY |
|
| GRAS | Grant fee paid |
Free format text: ORIGINAL CODE: EPIDOSNIGR3 |
|
| GRAA | (expected) grant |
Free format text: ORIGINAL CODE: 0009210 |
|
| AK | Designated contracting states |
Kind code of ref document: B1 Designated state(s): DE FR GB |
|
| REG | Reference to a national code |
Ref country code: GB Ref legal event code: FG4D |
|
| REF | Corresponds to: |
Ref document number: 60117930 Country of ref document: DE Date of ref document: 20060511 Kind code of ref document: P |
|
| ET | Fr: translation filed | ||
| PLBE | No opposition filed within time limit |
Free format text: ORIGINAL CODE: 0009261 |
|
| STAA | Information on the status of an ep patent application or granted ep patent |
Free format text: STATUS: NO OPPOSITION FILED WITHIN TIME LIMIT |
|
| RAP2 | Party data changed (patent owner data changed or rights of a patent transferred) |
Owner name: AGILENT TECHNOLOGIES, INC. |
|
| 26N | No opposition filed |
Effective date: 20061218 |
|
| PGFP | Annual fee paid to national office [announced via postgrant information from national office to epo] |
Ref country code: DE Payment date: 20070731 Year of fee payment: 7 |
|
| PGFP | Annual fee paid to national office [announced via postgrant information from national office to epo] |
Ref country code: GB Payment date: 20070628 Year of fee payment: 7 |
|
| PGFP | Annual fee paid to national office [announced via postgrant information from national office to epo] |
Ref country code: FR Payment date: 20070618 Year of fee payment: 7 |
|
| GBPC | Gb: european patent ceased through non-payment of renewal fee |
Effective date: 20080606 |
|
| REG | Reference to a national code |
Ref country code: FR Ref legal event code: ST Effective date: 20090228 |
|
| PG25 | Lapsed in a contracting state [announced via postgrant information from national office to epo] |
Ref country code: DE Free format text: LAPSE BECAUSE OF NON-PAYMENT OF DUE FEES Effective date: 20090101 |
|
| PG25 | Lapsed in a contracting state [announced via postgrant information from national office to epo] |
Ref country code: GB Free format text: LAPSE BECAUSE OF NON-PAYMENT OF DUE FEES Effective date: 20080606 |
|
| PG25 | Lapsed in a contracting state [announced via postgrant information from national office to epo] |
Ref country code: FR Free format text: LAPSE BECAUSE OF NON-PAYMENT OF DUE FEES Effective date: 20080630 |