EP1152336A1 - User interface for making compiler tradeoffs - Google Patents
User interface for making compiler tradeoffs Download PDFInfo
- Publication number
- EP1152336A1 EP1152336A1 EP01000024A EP01000024A EP1152336A1 EP 1152336 A1 EP1152336 A1 EP 1152336A1 EP 01000024 A EP01000024 A EP 01000024A EP 01000024 A EP01000024 A EP 01000024A EP 1152336 A1 EP1152336 A1 EP 1152336A1
- Authority
- EP
- European Patent Office
- Prior art keywords
- solution
- function
- user interface
- compiler
- application program
- Prior art date
- Legal status (The legal status is an assumption and is not a legal conclusion. Google has not performed a legal analysis and makes no representation as to the accuracy of the status listed.)
- Withdrawn
Links
Images


Classifications
-
- G—PHYSICS
- G06—COMPUTING OR CALCULATING; COUNTING
- G06F—ELECTRIC DIGITAL DATA PROCESSING
- G06F8/00—Arrangements for software engineering
- G06F8/40—Transformation of program code
- G06F8/41—Compilation
- G06F8/44—Encoding
- G06F8/443—Optimisation
-
- G—PHYSICS
- G06—COMPUTING OR CALCULATING; COUNTING
- G06F—ELECTRIC DIGITAL DATA PROCESSING
- G06F11/00—Error detection; Error correction; Monitoring
- G06F11/30—Monitoring
- G06F11/32—Monitoring with visual or acoustical indication of the functioning of the machine
Definitions
- the present invention relates to a user interface for a compiler, and more particularly, to a user interface for making compiler tradeoffs.
- An application program may be built (compiled and linked) in a number of different ways. For example, as part of a compiler compiling an application program, different compiler options may be used and different memory maps or layouts (on chip vs off chip) may be used. For convenience herein, a specific way of building an application program (compiling and linking a program with specific choices for compiler options and other options like memory maps/layouts) will be termed a "method".
- An application program typically consists of several different functions that are used to perform the activities an application program is to perform. If the method changes at the function level (from function to function), the term "solution" will be used to represent a specific assignment of methods to each function of the compiled application.
- Each method of building an application can result in an executable version of the program application (version) that exhibits different results, such as, for example, code size and processor cycle count behavior.
- version an executable version of the program application
- results such as, for example, code size and processor cycle count behavior.
- each resulting version of the application can be profiled at the function level for its results over a consistent input set, for example, collecting compiled code size and execution cycles for the functions in the application program.
- the resulting set of profile information describes the effects that each method has on each profilable function; for the example previously employed, this is in terms of code size and number of cycles executed for each function of an application program.
- a solution engine uses this profiling information to evaluate the permutations of varying methods at the function level to compute all of the useful solutions.
- a solution is "useful", if no other solution results in a version of the application that is better optimized for a specific result, such as, for example, either faster and smaller in code size than it.
- What is needed is a user interface that can be used to display the set of useful solutions and allow a user to effectively understand, inspect, and manipulate result tradeoffs.
- the present invention provides a user interface that allows a user to visually understand, inspect, and manipulate a set of useful solutions as a function of compiler options and other options, such as for example, but not limited to, code size and speed tradeoffs for an application program.
- a user interface for displaying and controlling the results of compiling an application program with a compiler having a preselected number of compiling options comprising of a module for displaying at least a portion of solution information as a function of said selected compiling options and for selecting at least one displayed solution, and a module for outputting, for a selected solution, compiler information to allow for said application program to be compiled in a manner consistent with said selected solution.
- the present invention provides a user interface that allows a user to visually understand, inspect, and manipulate a set of useful solutions as a function of selected performance metrics. More particularly, the user interface of the present invention is preferably composed of four different modules or windows. These four modules are a solution space module, a solution point module, a solution point override module, and an extended solution point module. Each module is described below.
- metric may be for example, but not limited to, power consumed by a processor while executing the compiled application program.
- Figure 1 shows the complete compilation flow.
- a source program is fed to the compiler, using different optimization options each time, to generate several executables.
- Each executable is run through the profiler to generate a set of profile data for each executable.
- the profiler may be a standalone simulator that records run-time information.
- the solution generator or solver analyses all the profile data, guided by constraints supplied by the user, and generates compiler directives.
- a final compilation of the application program uses those directives to guide its optimizations and produces a profile - optimized executable, which should provide the best performance and size for the given constraints.
- Profile data collected by running the program and recording the time spent in each function, can indicate which parts of the program deserve more effort. The program must remain the same in all profile runs, and the profile runs must all do the same thing on all the same data.
- Each point represents a solution; the fastest one is at the lower right, the smallest at the upper left.
- This plot shows that the curve is concave, but also that it is not completely smooth.
- the concavity represents the advantage to be gained through profile-based optimization.
- the irregularity offers additional local opportunities.
- the user interface presents the entire graph to the user and allows the user to select the appropriate solution.
- the initial steps for generating the information used by the user interface is providing said application program, and an associated database for exercising said program, providing a compiler, for compiling said application program, having compiling options, providing a profiler for extracting information related to said compiled application program from different compiling options, but using the same associated database, creating a profiler database based upon said extracted information, providing a solution solver for generating estimated solutions from said profiler database for points not provided by said extracted information, and creating a solution database based upon solutions from said solver on said extracted information and from extracted information.
- the solution space module receives a list of useful solutions from a solution solver.
- Each solution contains a list of all profilable functions, and for each function, its resulting performance metric (such as code size and number of processor cycles) and what method of compiling the function was used to obtain those results.
- An overall performance for an application program is computed by summing up the performance of each function and then adding in any unprofiled performance. Unprofiled performance for a function may be estimated based upon the unprofiled performance of the original application executables initially profiled. The unprofiled performance of the original executables may differ slightly due to effects from alignment, for example, and in this case, the average is taken.
- the overall performance of each useful solution may then be graphed.
- the main window of the solution space module of the user interface is the "solution space” window depicted in Figure 2. It is presently preferred to be a 2 dimensional graph with the results for one performance metric option, such as a code size, increasing along the X axis and the results for a second performance metric, such as cycle count, increasing along the Y axis.
- the upper left corner represents the smallest code size solution for an application and the lower right represents the fastest (fewest processor cycles) solution.
- Useful solutions are plotted in between and will form a solution space curve. Since it is a curve, plotting it and displaying the solution space curve allows the user to visualize and therefore understand what performance metric tradeoffs, such as code size and speed, are possible for that application.
- a zoom facility may be provided to allow the user to zoom in on an area of the curve of interest. This zoom facility allows the user to see the individual solution points.
- a solution point may be selected by highlighting any plotted point with the cursor, using the mouse.
- the user can input a maximum cycle count or maximum code size, and the smallest or fastest, respectively, solution that meets that constraint will be chosen.
- a solution point module is provided to allow for the presentation of a single solution point from the solver. Once a solution point is found that meets the user's code size and speed requirements, a module is provided to view the details of the selected solution point.
- the window for this module displays each function of the application along with its performance (code size and cycles) and the method used to build it, preferably in tabular form.
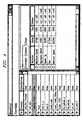
- the "solution point" window of Figure 3 contains this information. For each function, there are columns for the function's size, cycle count, and method used to build the function. The data within each column can be sorted. This allows the user the flexibility to see what functions have the greatest cycle count or code size.
- the solution point module also exports the necessary information to compile the application program to achieve the results similar to those of the selected solution, via a makefile, preferably on a function by function basis.
- the override rule is useful if the profiling training set isn't perfectly representative and it is known that a particular function either is or is not speed critical.
- the binding of a method to function is useful if the function isn't invoked during profiling and so no cycle count information is available from which to choose the best method.
- Figure 4 depicts one such screen.
- the useful solutions set database generated by the solution engine are only estimations, based upon the profiling information obtained from the different versions of the application actually built. They are not actually built or profiled. Rather, it is assumed that each function will behave identically regardless of it surrounding code, and "projects" the performance of a solution point based upon the performance of each function from the profile information. This assumption isn't precisely correct because of alignment padding, NOPs between fetch packets, etc. Therefore, the solution points are estimates and can differ from the actual performance.
- the user interface of the present invention preferably allows the user the ability to actually build the solution point selected and compare actual results vs what was graphed.
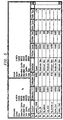
- An "extended solution point" window depicted in Figure 5 will compare the actual vs estimated performance.
- it will also display a function table containing columns for actual code size, actual cycle counts, estimated code size, estimated cycle counts, delta code size (between actual and estimate) and delta cycle counts.
- a solution point override module provides the user a way to display and control what method is employed on a function by function basis.
- the override window removes from the solver's data all of the methods for that function except the bound one.
- the solver always chooses that one and only one method of building that function.
- Flexibility is also provided by allowing the user to "override" the method used to build any function.
- the user may override a function by selecting a particular method that should always be used in building the function or by giving a rule that tells the solution engine how to pick the method.
- a typical rule is to pick the method of building the function that results in the fastest version or the smallest version.
- a rule is dynamically applied each time the solution solver engine is used and therefore can select a different method of building the function, if the profile data changes.
- the profile data is a set of inputs and conditions supplied to the application program to simulate its actual operation.
- the extended solution point module takes the "makefile” generated by choosing a solution point and feeds it to the compiler to actually build the solution selected.
- the profiler then profiles the resulting executable, collecting the same profile information as for the original executables. It then presents an overall view and a function level view.
- the overall performance of the built solution is computed in the same manner as described in the solution space module. This overall performance result may be textually compared to the overall performance of the point chosen in a solution space module.
- each function may be listed and along with it, both the actual (profiled) and estimated (plotted) performance of that function listed in a tabular format, along with columns that contain the difference between the actual and estimated results.
- a user interface for displaying and controlling the results of compiling an application program with a compiler having a preselected number of compiling options comprising a module for displaying at least a portion of information as a function of selected performance metrics and for selecting at least one displayed solution, and a module for outputting, for a selected solution, compiler information to allow for said application program to be compiled in a manner consistent with said selected solution.
Landscapes
- Engineering & Computer Science (AREA)
- General Engineering & Computer Science (AREA)
- Theoretical Computer Science (AREA)
- Software Systems (AREA)
- Physics & Mathematics (AREA)
- General Physics & Mathematics (AREA)
- Devices For Executing Special Programs (AREA)
- Debugging And Monitoring (AREA)
Abstract
Description
- The present invention relates to a user interface for a compiler, and more particularly, to a user interface for making compiler tradeoffs.
- An application program may be built (compiled and linked) in a number of different ways. For example, as part of a compiler compiling an application program, different compiler options may be used and different memory maps or layouts (on chip vs off chip) may be used. For convenience herein, a specific way of building an application program (compiling and linking a program with specific choices for compiler options and other options like memory maps/layouts) will be termed a "method". An application program typically consists of several different functions that are used to perform the activities an application program is to perform. If the method changes at the function level (from function to function), the term "solution" will be used to represent a specific assignment of methods to each function of the compiled application.
- Each method of building an application can result in an executable version of the program application (version) that exhibits different results, such as, for example, code size and processor cycle count behavior. If an application is built using several different methods, each resulting version of the application can be profiled at the function level for its results over a consistent input set, for example, collecting compiled code size and execution cycles for the functions in the application program. The resulting set of profile information describes the effects that each method has on each profilable function; for the example previously employed, this is in terms of code size and number of cycles executed for each function of an application program.
- A solution engine uses this profiling information to evaluate the permutations of varying methods at the function level to compute all of the useful solutions. A solution is "useful", if no other solution results in a version of the application that is better optimized for a specific result, such as, for example, either faster and smaller in code size than it.
- What is needed is a user interface that can be used to display the set of useful solutions and allow a user to effectively understand, inspect, and manipulate result tradeoffs.
- The present invention provides a user interface that allows a user to visually understand, inspect, and manipulate a set of useful solutions as a function of compiler options and other options, such as for example, but not limited to, code size and speed tradeoffs for an application program.
- A user interface for displaying and controlling the results of compiling an application program with a compiler having a preselected number of compiling options, comprising of a module for displaying at least a portion of solution information as a function of said selected compiling options and for selecting at least one displayed solution, and a module for outputting, for a selected solution, compiler information to allow for said application program to be compiled in a manner consistent with said selected solution.
- Other device, system and method forms of the invention are also disclosed and claimed herein. Other features of the invention are disclosed and still other features will be apparent from the disclosure herein.
- Embodiments of the invention will now be described in detail, by way of example only, with reference to the figures illustrated in the accompanying drawings in which:
- Figure 1 depicts a pictorial diagram of components for compiling an application program employing a user interface;
- Figure 2 depicts a typical solution curve;
- Figure 3 depicts a point window;
- Figure 4 depicts an override window; and
- Figure 5 depicts an extended solution point window;
-
- Corresponding numerals and symbols in the different figures refer to corresponding parts unless otherwise indicated.
- The present invention provides a user interface that allows a user to visually understand, inspect, and manipulate a set of useful solutions as a function of selected performance metrics. More particularly, the user interface of the present invention is preferably composed of four different modules or windows. These four modules are a solution space module, a solution point module, a solution point override module, and an extended solution point module. Each module is described below.
- Although the examples hereinbelow refer to code size and speed of execution as selected performance metrics, other metrics may be selected in place of or in addition to these two exemplary metrics. Another metric may be for example, but not limited to, power consumed by a processor while executing the compiled application program.
- The general process of profile-based optimization involves three tools: a compiler, a profiler, and a solution generator. Figure 1 shows the complete compilation flow. A source program is fed to the compiler, using different optimization options each time, to generate several executables. Each executable is run through the profiler to generate a set of profile data for each executable. The profiler may be a standalone simulator that records run-time information. The solution generator or solver analyses all the profile data, guided by constraints supplied by the user, and generates compiler directives. A final compilation of the application program uses those directives to guide its optimizations and produces a profile - optimized executable, which should provide the best performance and size for the given constraints.
- Profile data, collected by running the program and recording the time spent in each function, can indicate which parts of the program deserve more effort. The program must remain the same in all profile runs, and the profile runs must all do the same thing on all the same data.
- Every individual function trade-off can be considered to produce a solution. If all possible permutations of trade-offs over the whole set of profile runs are saved, a set of solutions is created that can be plotted on a graph of size vs. speed, bytes vs. cycles. The lower contour of this set of points is the set of useful solutions -- no other solutions are both faster and smaller -- and defines the solution curve. This curve tends to be concave, not a straight line from fastest to smallest, and thus offers ample possibilities for improving size at little cost in speed, or vice versa. Figure 2 shows a typical solution curve. The vertical scale is execution time of the program, in cycles. The horizontal scale is code size, in bytes. Each point represents a solution; the fastest one is at the lower right, the smallest at the upper left. This plot shows that the curve is concave, but also that it is not completely smooth. The concavity represents the advantage to be gained through profile-based optimization. The irregularity offers additional local opportunities. The user interface presents the entire graph to the user and allows the user to select the appropriate solution.
- Thus, the initial steps for generating the information used by the user interface is providing said application program, and an associated database for exercising said program, providing a compiler, for compiling said application program, having compiling options, providing a profiler for extracting information related to said compiled application program from different compiling options, but using the same associated database, creating a profiler database based upon said extracted information, providing a solution solver for generating estimated solutions from said profiler database for points not provided by said extracted information, and creating a solution database based upon solutions from said solver on said extracted information and from extracted information.
- The solution space module receives a list of useful solutions from a solution solver. Each solution contains a list of all profilable functions, and for each function, its resulting performance metric (such as code size and number of processor cycles) and what method of compiling the function was used to obtain those results. An overall performance for an application program is computed by summing up the performance of each function and then adding in any unprofiled performance. Unprofiled performance for a function may be estimated based upon the unprofiled performance of the original application executables initially profiled. The unprofiled performance of the original executables may differ slightly due to effects from alignment, for example, and in this case, the average is taken. The overall performance of each useful solution may then be graphed.
- The main window of the solution space module of the user interface is the "solution space" window depicted in Figure 2. It is presently preferred to be a 2 dimensional graph with the results for one performance metric option, such as a code size, increasing along the X axis and the results for a second performance metric, such as cycle count, increasing along the Y axis. Thus, for example, the upper left corner represents the smallest code size solution for an application and the lower right represents the fastest (fewest processor cycles) solution. Useful solutions are plotted in between and will form a solution space curve. Since it is a curve, plotting it and displaying the solution space curve allows the user to visualize and therefore understand what performance metric tradeoffs, such as code size and speed, are possible for that application.
- Holding the mouse pointer over any solution point in the graph will display the exact code size and speed characteristics for that solution. The original versions of the application that were built to generate the profiling information may also be plotted, but in some unique representation, such as, in a different color. This helps the user understand the improvements that this process can bring to an application.
- If the solution space contains many useful solutions, the curve will not look like a series of points, but rather like a continuous line. A zoom facility may be provided to allow the user to zoom in on an area of the curve of interest. This zoom facility allows the user to see the individual solution points.
- A solution point may be selected by highlighting any plotted point with the cursor, using the mouse. Alternatively, the user can input a maximum cycle count or maximum code size, and the smallest or fastest, respectively, solution that meets that constraint will be chosen.
- A solution point module is provided to allow for the presentation of a single solution point from the solver. Once a solution point is found that meets the user's code size and speed requirements, a module is provided to view the details of the selected solution point. The window for this module displays each function of the application along with its performance (code size and cycles) and the method used to build it, preferably in tabular form. The "solution point" window of Figure 3 contains this information. For each function, there are columns for the function's size, cycle count, and method used to build the function. The data within each column can be sorted. This allows the user the flexibility to see what functions have the greatest cycle count or code size.
- Once a solution point is selected, the solution point module also exports the necessary information to compile the application program to achieve the results similar to those of the selected solution, via a makefile, preferably on a function by function basis.
- The override rule is useful if the profiling training set isn't perfectly representative and it is known that a particular function either is or is not speed critical. The binding of a method to function is useful if the function isn't invoked during profiling and so no cycle count information is available from which to choose the best method. Figure 4 depicts one such screen.
- The useful solutions set database generated by the solution engine are only estimations, based upon the profiling information obtained from the different versions of the application actually built. They are not actually built or profiled. Rather, it is assumed that each function will behave identically regardless of it surrounding code, and "projects" the performance of a solution point based upon the performance of each function from the profile information. This assumption isn't precisely correct because of alignment padding, NOPs between fetch packets, etc. Therefore, the solution points are estimates and can differ from the actual performance. The user interface of the present invention preferably allows the user the ability to actually build the solution point selected and compare actual results vs what was graphed. An "extended solution point" window depicted in Figure 5 will compare the actual vs estimated performance. Optionally, it will also display a function table containing columns for actual code size, actual cycle counts, estimated code size, estimated cycle counts, delta code size (between actual and estimate) and delta cycle counts.
- From the original methods used to build and profile the application, the solution solver obtains data on how each method affects the performance of each function. A solution point override module provides the user a way to display and control what method is employed on a function by function basis. When a method is bound to a function via a user selection, the override window removes from the solver's data all of the methods for that function except the bound one. Thus, the solver always chooses that one and only one method of building that function. When an override "rule" is applied to a function by a user, the override window does the same thing as above, but will reevaluate which method to keep each time the solver is invoked.
- Flexibility is also provided by allowing the user to "override" the method used to build any function. The user may override a function by selecting a particular method that should always be used in building the function or by giving a rule that tells the solution engine how to pick the method. A typical rule is to pick the method of building the function that results in the fastest version or the smallest version. A rule is dynamically applied each time the solution solver engine is used and therefore can select a different method of building the function, if the profile data changes. The profile data is a set of inputs and conditions supplied to the application program to simulate its actual operation.
- The extended solution point module takes the "makefile" generated by choosing a solution point and feeds it to the compiler to actually build the solution selected. The profiler then profiles the resulting executable, collecting the same profile information as for the original executables. It then presents an overall view and a function level view. The overall performance of the built solution is computed in the same manner as described in the solution space module. This overall performance result may be textually compared to the overall performance of the point chosen in a solution space module. In addition, each function may be listed and along with it, both the actual (profiled) and estimated (plotted) performance of that function listed in a tabular format, along with columns that contain the difference between the actual and estimated results.
- A user interface for displaying and controlling the results of compiling an application program with a compiler having a preselected number of compiling options, comprising a module for displaying at least a portion of information as a function of selected performance metrics and for selecting at least one displayed solution, and a module for outputting, for a selected solution, compiler information to allow for said application program to be compiled in a manner consistent with said selected solution.
- While this invention has been described with reference to illustrative embodiments, this description is not intended to be construed in a limiting sense. Various modifications and combinations of the illustrative embodiments, as well as other embodiments of the invention, will be apparent to persons skilled in the art upon reference to the description.
Claims (3)
- A user interface for displaying and controlling the results of compiling an application program with a compiler having a preselected number of compiling options, which interface comprising:a module for displaying at least a portion of solution information as a function of said selected compiling options and for selecting at least one displayed solution, anda module for outputting, for a selected solution, compiler information to allow for said application program to be compiled in a manner consistent with said selected solution.
- The user interface of claim 1, further comprising:
a module for selecting and fixing instructions for a solver that generates said solutions information. - The user interface of claim 2, further comprising:
a module for compiling said application program in a manner consistent with said selected solution and for comparing the results with said selected solution.
Applications Claiming Priority (2)
| Application Number | Priority Date | Filing Date | Title |
|---|---|---|---|
| US09/510,217 US6718544B1 (en) | 2000-02-22 | 2000-02-22 | User interface for making compiler tradeoffs |
| US510217 | 2009-07-27 |
Publications (1)
| Publication Number | Publication Date |
|---|---|
| EP1152336A1 true EP1152336A1 (en) | 2001-11-07 |
Family
ID=24029836
Family Applications (1)
| Application Number | Title | Priority Date | Filing Date |
|---|---|---|---|
| EP01000024A Withdrawn EP1152336A1 (en) | 2000-02-22 | 2001-02-21 | User interface for making compiler tradeoffs |
Country Status (3)
| Country | Link |
|---|---|
| US (1) | US6718544B1 (en) |
| EP (1) | EP1152336A1 (en) |
| JP (1) | JP2001256083A (en) |
Cited By (1)
| Publication number | Priority date | Publication date | Assignee | Title |
|---|---|---|---|---|
| CN106033382A (en) * | 2015-03-12 | 2016-10-19 | 阿里巴巴集团控股有限公司 | A terminal state prompting method and a related apparatus and system |
Families Citing this family (9)
| Publication number | Priority date | Publication date | Assignee | Title |
|---|---|---|---|---|
| US20040088690A1 (en) * | 2002-08-27 | 2004-05-06 | Hayim Shaul | Method for accelerating a computer application by recompilation and hardware customization |
| WO2005050372A2 (en) * | 2003-11-13 | 2005-06-02 | The Board Of Governors For Higher Education State Of Rhode Island : Providence Plantation | Hardware environment for low-overhead profiling |
| US8559605B2 (en) * | 2005-02-07 | 2013-10-15 | Avaya Inc. | Extensible diagnostic tool |
| US7982739B2 (en) | 2005-08-18 | 2011-07-19 | Realnetworks, Inc. | System and/or method for adjusting for input latency in a handheld device |
| US20070174818A1 (en) * | 2005-08-18 | 2007-07-26 | Pasula Markus I | Method and apparatus for generating application programs for multiple hardware and/or software platforms |
| US20070061785A1 (en) * | 2005-09-09 | 2007-03-15 | Sun Microsystems, Inc. | Web-based code tuning service |
| US7895585B2 (en) * | 2005-09-09 | 2011-02-22 | Oracle America, Inc. | Automatic code tuning |
| US8136101B2 (en) * | 2005-11-04 | 2012-03-13 | Oracle America, Inc. | Threshold search failure analysis |
| JP5576605B2 (en) | 2008-12-25 | 2014-08-20 | パナソニック株式会社 | Program conversion apparatus and program conversion method |
Family Cites Families (8)
| Publication number | Priority date | Publication date | Assignee | Title |
|---|---|---|---|---|
| US6311324B1 (en) * | 1995-06-07 | 2001-10-30 | Intel Corporation | Software profiler which has the ability to display performance data on a computer screen |
| US5862381A (en) * | 1996-11-26 | 1999-01-19 | International Business Machines Corporation | Visualization tool for graphically displaying trace data |
| US5946493A (en) * | 1997-03-28 | 1999-08-31 | International Business Machines Corporation | Method and system in a data processing system for association of source code instructions with an optimized listing of object code instructions |
| US5966537A (en) * | 1997-05-28 | 1999-10-12 | Sun Microsystems, Inc. | Method and apparatus for dynamically optimizing an executable computer program using input data |
| US6332212B1 (en) * | 1997-10-02 | 2001-12-18 | Ltx Corporation | Capturing and displaying computer program execution timing |
| US5966538A (en) * | 1997-10-31 | 1999-10-12 | Hewlett-Packard Company | Method and apparatus for automatically determining which compiler options should be used when compiling a computer program |
| JPH11232147A (en) * | 1998-02-16 | 1999-08-27 | Toshiba Corp | Power estimation apparatus, power estimation method, and machine-readable recording medium recording power estimation program |
| US6199199B1 (en) * | 1998-09-16 | 2001-03-06 | International Business Machines Corporation | Presentation of visual program performance data |
-
2000
- 2000-02-22 US US09/510,217 patent/US6718544B1/en not_active Expired - Lifetime
-
2001
- 2001-02-21 EP EP01000024A patent/EP1152336A1/en not_active Withdrawn
- 2001-02-22 JP JP2001097387A patent/JP2001256083A/en not_active Abandoned
Non-Patent Citations (4)
| Title |
|---|
| "OPTIMIZING COMPILERS ADDRESS DEBUGGING AND USER CONTROL CONSTRAINTS", COMPUTER DESIGN, PENNWELL PUBL. LITTLETON, MASSACHUSETTS, US, vol. 27, no. 13, 1 July 1988 (1988-07-01), pages 48,50,52 - 55, XP000048116, ISSN: 0010-4566 * |
| DEODHAR R: "OPTIMIZING COMPILER TECHNOLOGY STREAMLINES COMPLEX SYSTEMS", ELECTRONIC DESIGN, PENTON PUBLISHING, CLEVELAND, OH, US, vol. 45, no. 9, 1 May 1997 (1997-05-01), pages 153 - 154,156,158, XP000728926, ISSN: 0013-4872 * |
| GREEN HILLS SOFTWARE: "Optimizing Speed vs. Size - Using The CodeBalance Utility For ARM/Thumb and MIPS16 Architectures", WHITE PAPER, November 1998 (1998-11-01), XP002174188 * |
| WILLIAMS T: "PROFILING COMPILER AUTOMATES CODE OPTIMIZATION PROCESS", ELECTRONIC DESIGN, PENTON PUBLISHING, CLEVELAND, OH, US, vol. 45, no. 8, 14 April 1997 (1997-04-14), pages 108, XP000730019, ISSN: 0013-4872 * |
Cited By (1)
| Publication number | Priority date | Publication date | Assignee | Title |
|---|---|---|---|---|
| CN106033382A (en) * | 2015-03-12 | 2016-10-19 | 阿里巴巴集团控股有限公司 | A terminal state prompting method and a related apparatus and system |
Also Published As
| Publication number | Publication date |
|---|---|
| JP2001256083A (en) | 2001-09-21 |
| US6718544B1 (en) | 2004-04-06 |
Similar Documents
| Publication | Publication Date | Title |
|---|---|---|
| US6922829B2 (en) | Method of generating profile-optimized code | |
| US7168059B2 (en) | Graphical loop profile analysis | |
| US7237234B2 (en) | Method for selective solicitation of user assistance in the performance tuning process | |
| Golany | An interactive MOLP procedure for the extension of DEA to effectiveness analysis | |
| US8359586B1 (en) | Code generation | |
| US5966538A (en) | Method and apparatus for automatically determining which compiler options should be used when compiling a computer program | |
| CN102207901B (en) | Method and apparatus for analyzing software | |
| US20040034847A1 (en) | Programmatically analyzing and modifying a graphical program | |
| US8448135B2 (en) | Race structure for a graphical program | |
| Saviankou et al. | Cube v4: From performance report explorer to performance analysis tool | |
| KR100921514B1 (en) | A Software Development Apparatus for Providing Performance Prediction and A method thereof | |
| US6718544B1 (en) | User interface for making compiler tradeoffs | |
| US6360360B1 (en) | Object-oriented compiler mechanism for automatically selecting among multiple implementations of objects | |
| CN101960419A (en) | Building operating system images based on applications | |
| US7714864B2 (en) | Visual resource profiler for graphical applications | |
| US20070044075A1 (en) | Method for analysis of source code and display of corresponding output through a marking scheme | |
| CN102207902A (en) | Method and apparatus for analyzing software including a calibrated value | |
| Passerone et al. | Fast hardware/software co-simulation for virtual prototyping and trade-off analysis | |
| US8850404B2 (en) | Relational modeling for performance analysis of multi-core processors using virtual tasks | |
| Fischer et al. | Efficient architecture/compiler co-exploration for ASIPs | |
| Hashemi et al. | Procedure mapping using static call graph estimation | |
| Hahn et al. | Thread city: Combined visualization of structure and activity for the exploration of multi-threaded software systems | |
| Marin et al. | Application insight through performance modeling | |
| Fahringer et al. | Execution-driven performance analysis for distributed and parallel systems | |
| WO1985005204A1 (en) | Automated application program development system and method |
Legal Events
| Date | Code | Title | Description |
|---|---|---|---|
| PUAI | Public reference made under article 153(3) epc to a published international application that has entered the european phase |
Free format text: ORIGINAL CODE: 0009012 |
|
| AK | Designated contracting states |
Kind code of ref document: A1 Designated state(s): AT BE CH CY DE DK ES FI FR GB GR IE IT LI LU MC NL PT SE TR |
|
| AX | Request for extension of the european patent |
Free format text: AL;LT;LV;MK;RO;SI |
|
| RIN1 | Information on inventor provided before grant (corrected) |
Inventor name: WARD, ALAN S. Inventor name: TATGE, REID E. Inventor name: HUMPHREYS, JONATHAN F. Inventor name: BARTLEY, DAVID H. Inventor name: FUQUA, PAUL C. |
|
| 17P | Request for examination filed |
Effective date: 20020507 |
|
| AKX | Designation fees paid |
Free format text: AT BE CH CY DE DK ES FI FR GB GR IE IT LI LU MC NL PT SE TR |
|
| 17Q | First examination report despatched |
Effective date: 20061229 |
|
| STAA | Information on the status of an ep patent application or granted ep patent |
Free format text: STATUS: THE APPLICATION IS DEEMED TO BE WITHDRAWN |
|
| 18D | Application deemed to be withdrawn |
Effective date: 20090225 |