EP1133899B1 - Binaural signal processing techniques - Google Patents
Binaural signal processing techniques Download PDFInfo
- Publication number
- EP1133899B1 EP1133899B1 EP99958975A EP99958975A EP1133899B1 EP 1133899 B1 EP1133899 B1 EP 1133899B1 EP 99958975 A EP99958975 A EP 99958975A EP 99958975 A EP99958975 A EP 99958975A EP 1133899 B1 EP1133899 B1 EP 1133899B1
- Authority
- EP
- European Patent Office
- Prior art keywords
- signal
- signals
- sources
- frequency
- source
- Prior art date
- Legal status (The legal status is an assumption and is not a legal conclusion. Google has not performed a legal analysis and makes no representation as to the accuracy of the status listed.)
- Expired - Lifetime
Links
Images









Classifications
-
- H—ELECTRICITY
- H04—ELECTRIC COMMUNICATION TECHNIQUE
- H04R—LOUDSPEAKERS, MICROPHONES, GRAMOPHONE PICK-UPS OR LIKE ACOUSTIC ELECTROMECHANICAL TRANSDUCERS; ELECTRIC HEARING AIDS; PUBLIC ADDRESS SYSTEMS
- H04R25/00—Electric hearing aids
- H04R25/40—Arrangements for obtaining a desired directivity characteristic
- H04R25/407—Circuits for combining signals of a plurality of transducers
-
- H—ELECTRICITY
- H04—ELECTRIC COMMUNICATION TECHNIQUE
- H04R—LOUDSPEAKERS, MICROPHONES, GRAMOPHONE PICK-UPS OR LIKE ACOUSTIC ELECTROMECHANICAL TRANSDUCERS; ELECTRIC HEARING AIDS; PUBLIC ADDRESS SYSTEMS
- H04R25/00—Electric hearing aids
- H04R25/55—Electric hearing aids using an external connection, either wireless or wired
- H04R25/552—Binaural
Definitions
- the present invention is directed to the processing of acoustic signals, and more particularly, but not exclusively, relates to the localization and extraction of acoustic signals emanating from different sources.
- the difficulty of extracting a desired signal in the presence of interfering signals is a long-standing problem confronted by acoustic engineers.
- This problem impacts the design and construction of many kinds of devices such as systems for voice recognition and intelligence gathering.
- hearing aid devices do not permit selective amplification of a desired sound when contaminated by noise from a nearby source - - particularly when the noise is more intense.
- This problem is even more severe when the desired sound is a speech signal and the nearby noise is also a speech signal produced by multiple talkers (e.g. babble).
- noise refers to random or nondeterministic signals and alternatively or additionally refers to any undesired signals and/or any signals interfering with the perception of a desired signal.
- Still another approach has been the application of two microphones displaced from one another to provide two signals to emulate certain aspects of the binaural hearing system common to humans and many types of animals.
- biologic binaural hearing Although certain aspects of biologic binaural hearing are not fully understood, it is believed that the ability to localize sound sources is based on evaluation by the auditory system of binaural time delays and sound levels across different frequency bands associated with each of the two sound signals. The localization of sound sources with systems based on these interaural time and intensity differences is discussed in W. Lindemann, Extension of a Binaural Cross-Correlation Model by Contralateral Inhibition - I. Simulation of Lateralization for Stationary Signals, 80 Journal of the Acoustical Society of America 1608 (December 1986 ).
- the localization of multiple acoustic sources based on input from two microphones presents several significant challenges, as does the separation of a desired signal once the sound sources are localized.
- the system set forth in Markus Bodden, Modeling Human Sound-Source Localization and the Cocktail-Party-Effect, 1 Acta Acustica 43 employs a Wiener filter including a windowing process in an attempt to derive a desired signal from binaural input signals once the location of the desired signal has been established.
- this approach results in significant deterioration of desired speech fidelity.
- the system has only been demonstrated to suppress noise of equal intensity to the desired signal at an azimuthal separation of at least 30 degrees.
- the present invention relates to the processing of acoustic signals.
- Various aspects of the invention are novel, nonobvious, and provide various advantages. While the actual nature of the invention covered herein can only be determined with reference to the claims appended hereto, selected forms and features of the preferred embodiments as disclosed herein are described briefly as follows.
- One form of the present invention includes a method having the features of claim 1, which follows.
- a further form of the present invention is a system having the features of claim 9, which follows.
- An additional object is to provide a system for the localization and extraction of acoustic signals by detecting a combination of these signals with two differently located sensors.
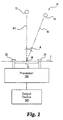
- Fig. 1 illustrates an acoustic signal processing system 10 of one embodiment of the present invention.
- System 10 is configured to extract a desired acoustic signal from source 12 despite interference or noise emanating from nearby source 14.
- System 10 includes a pair of acoustic sensors 22, 24 configured to detect acoustic excitation that includes signals from sources 12, 14.
- Sensors 22, 24 are operatively coupled to processor 30 to process signals received therefrom.
- processor 30 is operatively coupled to output device 90 to provide a signal representative of a desired signal from source 12 with reduced interference from source 14 as compared to composite acoustic signals presented to sensors 22, 24 from sources 12, 14.
- Sensors 22, 24 are spaced apart from one another by distance D along lateral axis T.
- Midpoint M represents the half way point along distance D from sensor 22 to sensor 24.
- Reference axis R1 is aligned with source 12 and intersects axis T perpendicularly through midpoint M.
- Axis N is aligned with source 14 and also intersects midpoint M.
- Axis N is positioned to form angle A with reference axis R1.
- Fig. 1 depicts an angle A of about 20 degrees.
- reference axis R1 may be selected to define a reference azimuthal position of zero degrees in an azimuthal plane intersecting sources 12, 14; sensors 22, 24; and containing axes T, N, R1.
- source 12 is "on-axis" and source 14, as aligned with axis N, is “off-axis.”
- Source 14 is illustrated at about a 20 degree azimuth relative to source 12.
- sensors 22, 24 are fixed relative to each other and configured to move in tandem to selectively position reference axis R1 relative to a desired acoustic signal source. It is also preferred that sensors 22, 24 be microphones of a conventional variety, such as omnidirectional dynamic microphones. In other embodiments, a different sensor type may be utilized as would occur to one skilled in the art.
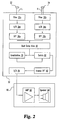
- a signal flow diagram illustrates various processing stages for the embodiment shown in FIG. 1 .
- Sensors 22, 24 provide analog signals Lp(t) and Rp(t) corresponding to the left sensor 22, and right sensor 24, respectively.
- Signals Lp(t) and Rp(t) are initially input to processor 30 in separate processing channels L and R.
- signals Lp(t) and Rp(t) are conditioned and filtered in stages 32a, 32b to reduce aliasing, respectively.
- the conditioned signals Lp(t), Rp(t) are input to corresponding Analog to Digital (A/D) converters 34a, 34b to provide discrete signals Lp(k), Rp(k), where k indexes discrete sampling events.
- A/D stages 34a, 34b sample signals Lp(t) and Rp(t) at a rate of at least twice the frequency of the upper end of the audio frequency range to assure a high fidelity representation of the input signals.
- Discrete signals Lp(k) and Rp(k) are transformed from the time domain to the frequency domain by a short-term Discrete Fourier Transform (DFT) algorithm in stages 36a, 36b to provide complex-valued signals XLp(m) and XRp(m).
- frequencies M encompass the audible frequency range and the number of samples employed in the short-term analysis is selected to strike an optimum balance between processing speed limitations and desired resolution of resulting output signals.
- an audio range of 0.1 to 6 kHz is sampled in A/D stages 34a, 34b at a rate of at least 12.5 kHz with 512 samples per short-term spectral analysis time frame.
- the frequency domain analysis may be provided by an analog filter bank employed before A/D stages 34a, 34b. It should be understood that the spectral signals XLp(m) and XRp(m) may be represented as arrays each having a 1xM dimension corresponding to the different frequencies f m .
- Spectral signals XLp(m) and XRp(m) are input to dual delay line 40 as further detailed in FIG. 3.
- FIG. 3 depicts two delay lines 42, 44 each having N number of delay stages. Each delay line 42, 44 is sequentially configured with delay stages D 1 through D N .
- Delay lines 42, 44 are configured to delay corresponding input signals in opposing directions from one delay stage to the next, and generally correspond to the dual hearing channels associated with a natural binaural hearing process.
- Delay stages D 1 , D 2 , D 3 , ..., D N-2 , D N-1 , and D N each delay an input signal by corresponding time delay increments ⁇ 1 , ⁇ 2 , ⁇ 3 ,..., ⁇ N-2 , ⁇ N-1 , and ⁇ N , (collectively designated ⁇ i ), where index i goes from left to right.
- XLp(m) is alternatively designated XLp 1 (m).
- XLp 1 (m) is sequentially delayed by time delay increments ⁇ 1 , ⁇ 2 , ⁇ 3 , ..., ⁇ N-2 , ⁇ N-1 , and ⁇ N to produce delayed outputs at the taps of delay line 42 which are respectively designated XLp 2 (m), XLp 3 (m), Xlp 4 (m), ..., XLp N-1 (m), XLp N (m), and XLp N+1 (m); (collectively designated XLp i (m)).
- XRp(m) is alternatively designated XRp N+1 (m).
- XRp N+1 (m) is sequentially delayed by time delay increments increments ⁇ 1 , ⁇ 2 , ⁇ 3 , ..., ⁇ N-2 , ⁇ N-1 , and ⁇ N to produce delayed outputs at the taps of delay line 44 which are respectively designated: XRp N (m), XRp N-1 (m), XRp N-2 (m), ..., XLp 3 (m), XLp 2 (m), and Xlp 1 (m); (collectively designated XRp i (m)).
- the input spectral signals and the signals from delay line 42, 44 taps are arranged as input pairs to operation array 46. A pair of taps from delay lines 42, 44 is illustrated as input pair P in FIG. 3 .
- Operation array 46 has operation units (OP) numbered from 1 to N+1, depicted as OP1, OP2, OP3, OP4,..., OPN-2, OPN-1, OPN, OPN+1 and collectively designated operations OPi.
- Input pairs from delay lines 42, 44 correspond to the operations of array 46 as follows: OP1[XLp 1 (m), XRp 1 (m)], OP2[XLp 2 (m), XRp 2 (m)], OP3[XLp 3 (m), XRp 3 (m)], OP4[XLp 4 (m), XRp 4 (m)],..., OPN-2[XLp (N-2) (m), XRp (N-2) (m)], OPN-1[XLp (N-1) (m), XRp (N-1) (m)], OPN[XLp N (m), XRp N (m)], and OPN+1[XLp (N+1 )(m), XRp (
- the outputs of operation array 46 are Xp 1 (m), Xp 2 (m), Xp 3 (m), Xp 4 (m), ..., Xp (N-2) (m), Xp (N-1) (m), Xp N (m), and Xp (N+1) (m) (collectively designated Xp i (m)).
- each OPi of operation array 46 is defined to be representative of a different azimuthal position relative to reference axis R.
- This arrangement is analogous to the different interaural time differences associated with a natural binaural hearing system. In these natural systems, there is a relative position in each sound passageway within the ear that corresponds to a maximum "in phase" peak for a given sound source.
- each operation of array 46 represents a position corresponding to a potential azimuthal or angular position range for a sound source, with the center operation representing a source at the zero azimuth -- a source aligned with reference axis R.
- dual delay line 40 provides a two dimensional matrix of outputs with N+1 columns corresponding to Xp i (m), and M rows corresponding to each discrete frequency f m of Xp i (m). This (N+1)xM matrix is determined for each short-term spectral analysis interval p. Furthermore, by subtracting XRp i (m) from XLp i (m), the denominator of each expression CE1, CE2 is arranged to provide a minimum value of Xp i (m) when the signal pair is "in-phase" at the given frequency f m . Localization stage 70 uses this aspect of expressions CE1, CE2 to evaluate the location of source 14 relative to source 12.
- Localization stage 70 accumulates P number of these matrices to determine the Xp i (m) representative of the position of source 14. For each column i, localization stage 70 performs a summation of the amplitude of
- the X i are analyzed to determine the minimum value, min(X i ).
- the index i of min(X i ), designated "I,” estimates the column representing the azimuthal location of source 14 relative to source 12.
- the spectral content of a desired signal from source 12 when approximately aligned with reference axis R1, can be estimated from Xp I (m).
- the spectral signal output by array 46 which most closely corresponds to the relative location of the "off-axis" source 14 contemporaneously provides a spectral representation of a signal emanating from source 12.
- the signal processing of dual delay line 40 not only facilitates localization of source 14, but also provides a spectral estimate of the desired signal with only minimal post-localization processing to produce a representative output.
- Post-localization processing includes provision of a designation signal by localization stage 70 to conceptual "switch" 80 to select the output column Xp I (m) of the dual delay line 40.
- the Xp I (m) is routed by switch 80 to an inverse Discrete Fourier Transform algorithm (Inverse DFT) in stage 82 for conversion from a frequency domain signal representation to a discrete time domain signal representation denoted as s(k).
- the signal estimate s(k) is then converted by Digital to Analog (D/A) converter 84 to provide an output signal to output device 90.
- D/A Digital to Analog
- Output device 90 amplifies the output signal from processor 30 with amplifier 92 and supplies the amplified signal to speaker 94 to provide the extracted signal from a source 12.
- the present invention provides for the extraction of desired signals even when the interfering or noise signal is of equal or greater relative intensity.
- the localization algorithm is configured to dynamically respond to relative positioning as well as relative strength, using automated learning techniques.
- the present invention is adapted for use with highly directional microphones, more than two sensors to simultaneously extract multiple signals, and various adaptive amplification and filtering techniques known to those skilled in the art.
- the present invention greatly improves computational efficiency compared to conventional systems by determining a spectral signal representative of the desired signal as part of the localization processing.
- an output signal characteristic of a desired signal from source 12 is determined as a function of the signal pair XLp I (m), XRp I (m) corresponding to the separation of source 14 from source 12.
- the exponents in the denominator of CE1, CE2 correspond to phase difference of frequencies f m resulting from the separation of source 12 from 14.
- ⁇ i be selected to provide generally equal azimuthal positions relative to reference axis R. In one embodiment, this arrangement corresponds to the values of ⁇ i changing about 20% from the smallest to the largest value. In other embodiments, ⁇ i are all generally equal to one another, simplifying the operations of array 46. Notably, the pair of time increments in the numerator of CE1, CE2 corresponding to the separation of the sources 12 and 14 become approximately equal when all values ⁇ i are generally the same.
- Processor 30 may be comprised of one or more components or pieces of equipment.
- the processor may include digital circuits, analog circuits, or a combination of these circuit types.
- Processor 30 may be programmable, an integrated state machine, or utilize a combination of these techniques.
- processor 30 is a solid state integrated digital signal processor circuit customized to perform the process of the present invention with a minimum of external components and connections.
- the extraction process of the present invention may be performed on variously arranged processing equipment configured to provide the corresponding functionality with one or more hardware modules, firmware modules, software modules, or a combination thereof.
- signal includes, but is not limited to, software, firmware, hardware, programming variable, communication channel, and memory location representations.
- System 110 includes eyeglasses G with microphones 122 and 124 fixed to glasses G and displaced from one another.
- Microphones 122, 124 are operatively coupled to hearing aid processor 130.
- Processor 130 is operatively coupled to output device 190.
- Output device 190 is positioned in ear E to provide an audio signal to the wearer.
- Microphones 122, 124 are utilized in a manner similar to sensors 22, 24 of the embodiment depicted by FIGS 1-3 .
- processor 130 is configured with the signal extraction process depicted in of FIGS. 1-3 .
- Processor 130 provides the extracted signal to output device 190 to provide an audio output to the wearer.
- the wearer of system 110 may position glasses G to align with a desired sound source, such as a speech signal, to reduce interference from a nearby noise source off axis from the midpoint between microphones 122, 124.
- the wearer may select a different signal by realigning with another desired sound source to reduce interference from a noisy environment.
- Processor 130 and output device 190 may be separate units (as depicted) or included in a common unit worn in the ear.
- the coupling between processor 130 and output device 190 may be an electrical cable or a wireless transmission.
- sensors 122, 124 and processor 130 are remotely located and are configured to broadcast to one or more output devices 190 situated in the ear E via a radio frequency transmission or other conventional telecommunication method.
- FIG. 4B shows a voice recognition system 210 employing the present invention as a front end speech enhancement device.
- System 210 includes personal computer C with two microphones 222, 224 spaced apart from each other in a predetermined relationship. Microphones 222, 224 are operatively coupled to a processor 230 within computer C. Processor 230 provides an output signal for internal use or responsive reply via speakers 294a, 294b or visual display 296. An operator aligns in a predetermined relationship with microphones 222, 224 of computer C to deliver voice commands. Computer C is configured to receive these voice commands, extracting the desired voice command from a noisy environment in accordance with the process system of FIGS. 1-3 .
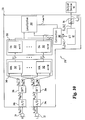
- FIG. 10 depicts left “ L " and right “ R " input channels for signal processor 330 of system 310.
- Channels L, R each include an acoustic sensor 22, 24 that provides an input signal x Ln (t), x Rn (t), respectively.
- Input signals x Ln (t) and x Rn (t) correspond to composites of sounds from multiple acoustic sources located within the detection range of sensors 22, 24.
- sensors 22, 24 be standard microphones spaced apart from each other at a predetermined distance D. In other embodiments a different sensor type or arrangement may be employed as would occur to those skilled in the art.
- Sensors 22, 24 are operatively coupled to processor 330 of system 310 to provide input signals x Ln (t) and x Rn (t) to A/D converters 34a, 34b.
- A/D converters 34a, 34b of processor 330 convert input signals x Ln (t) and x Rn (t) from an analog form to a discrete form as represented as x Ln (k) and x Rn (k), respectively; where "t” is the familiar continuous time domain variable and "k” is the familiar discrete sample index variable.
- a corresponding pair of preconditioning filters may also be included in processor 330 as described in connection with system 10.
- Delay operator 340 receives spectral signals X Ln (m) and X Rn (m) from stages 36a, 36b, respectively.
- delay operator 340 may be described as a single dual delay line that simultaneously operates on M frequencies like dual delay line 40 of system 10.
- the pair of frequency components from DFT stages 36a, 36b corresponding to a given value of m are inputs into a corresponding one of dual delay lines 342.
- Each dual delay line 342 includes a left channel delay line 342a receiving a corresponding frequency component input from DFT stage 36a and right channel delay line 342b receiving a corresponding frequency component input from DFT stage 36b.
- the I number of delayed signal pairs are provided on outputs 345 of delay stages 344 and are correspondingly sent to complex multipliers 346.
- Multipliers 346 provide equalization weighting for the corresponding outputs of delay stages 344.
- Each delayed signal pair from corresponding outputs 345 has one member from a delay stage 344 of left delay line 342a and the other member from a delay stage 344 of right delay line 342b.
- Complex multipliers 346 of each dual delay line 342 output corresponding products of the I number of delayed signal pairs along taps 347.
- the I number of signal pairs from taps 347 for each dual delay line 342 of operator 340 are input to signal operator 350.
- the I number of pairs of multiplier taps 347 are each input to a different Operation Array (OA) 352 of operator 350.
- Each pair of taps 347 is provided to a different operation stage 354 within a corresponding operation array 352.
- OA Operation Array
- Fig. 11 only a portion of delay stages 344, multipliers 346, and operation stages 354 are shown corresponding to the two stages at either end of delay lines 342a, 342b and the middle stages of delay lines 342a, 342b.
- the intervening stages follow the pattern of the illustrated stages and are represented by ellipses to preserve clarity.
- ITD max D/c is the maximum Intermicrophone Time Difference
- D is the distance between sensors 22, 24
- c is the speed of sound.
- the dual delay-line structure is similar to the embodiment of system 10, except that a different dual delay line is represented for each value of m and multipliers 346 have been included to multiply each corresponding delay stage 344 by an appropriate one of equalization factors ⁇ i ( m ); where i is the delay stage index previously described.
- elements ⁇ i ( m ) are selected to compensate for differences in the noise intensity at sensors 22, 24 as a function of both azimuth and frequency.
- ⁇ i ( m ) One preferred embodiment for determining equalization factors ⁇ i ( m ) assumes amplitude compensation is independent of frequency, regarding any departure from this model as being negligible.
- Fig. 12 depicts sensors 22, 24 and a representative acoustic source S 1 within the range of reception to provide input signals x Ln (t) and x Rn (t). According to the geometry illustrated in Fig.
- Equation (A7) K ⁇ l 2 - lD ⁇ sin ⁇ i + D 2 / 4 , where, K is in units of inverse length and is chosen to provide a convenient amplitude level
- equations (7) and (8) further define certain terms of equations (5) and (6) as follows:
- X Ln i m X Ln m ⁇ exp - j ⁇ 2 ⁇ ⁇ ⁇ f m ⁇ ⁇ i
- X Rn i m X Rn m ⁇ exp - j ⁇ 2 ⁇ ⁇ ⁇ f m ⁇ ⁇ I - i + 1
- Each signal pair ⁇ i ( m ) X Ln (i) ( m ) and ⁇ l-i+ 1 ( m ) X Rn (i) ( m ) is input to a corresponding operation stage 354 of a corresponding one of operation arrays 352 for all m; where each operator array 352 corresponds to a different value of m as in the case of dual delay lines 342.
- g i m ⁇ i / ⁇ g ⁇ exp j ⁇ ⁇ m ( ⁇ g - ⁇ i ) - ⁇ I - i + 1 / ⁇ I - g + 1 ⁇ exp - j ⁇ ⁇ m ( ⁇ g - ⁇ i ) ⁇ i / ⁇ s ⁇ exp j ⁇ ⁇ m ( ⁇ s - ⁇ i ) - ⁇ I - i + 1 / ⁇ I - s + 1 ⁇ exp - j ⁇ ⁇ m ( ⁇ s - ⁇ i ) , i ⁇ s .
- T denotes transposition.
- 2 , i 1 , ... , I .
- Equation (14) is a double summation over time and frequency that approximates a double integration in a continuous time domain representation.
- s ( S 1 1 , S 1 2 , ... , S 1 M , S 2 1 , ... , S 2 M , ... , S N 1 , ... , S N M ⁇ ) T
- g i ( G 1 1 ⁇ ⁇ s . g i 1 , G 1 2 ⁇ ⁇ s . g i 2 , ... , G 1 M ⁇ ⁇ s . g i , G 2 1 ⁇ ⁇ s . g i , ... , G 2 M ⁇ ⁇ s . g i M , ... , G N 1 ⁇ ⁇ s .
- the localization procedure includes finding the position i noise along the operation array 352 for each of the delay lines 342 that produces the minimum value of ⁇ x i ⁇ 2 2 .
- the azimuth position of the noise source may be determined with equation (3).
- the estimated noise location i noise may be utilized for noise cancellation or extraction of the desired signal as further described hereinafter.
- Localization operator 360 embodies the localization technique of system 310.
- summation operators 362 and 364 perform the operation corresponding to equation (14) to generate ⁇ x i ⁇ 2 2 for each value of i.
- IFT Inverse Fourier Transform
- extraction operator 380 preferably includes a multiplexer or matrix switch that has IxM complex inputs and M complex outputs; where a different set of M inputs is routed to the outputs for each different value of the index I in response to the output from stage 366 of localization operator 360.
- Stage 82 converts the M spectral components received from extraction unit 380 to transform the spectral approximation of the desired signal, S ⁇ n m , from the frequency domain to the time domain as represented by signal S ⁇ n k .
- Stage 82 is operatively coupled to digital-to-analog (D/A) converter 84.
- D/A converter 84 receives signal S ⁇ n k for conversion from a discrete form to an analog form represented by S ⁇ n t .
- Signal S ⁇ n t is input to output device 90 to provide an auditory representation of the desired signal or other indicia as would occur to those skilled in the art.
- Stage 82, converter 84, and device 90 are further described in connection with system 10.
- the terms w Ln and w Rn are equivalent to beamforming weights for the left and right channels, respectively.
- the operation of equation (9) may be equivalently modeled as a beamforming procedure that places a null at the location corresponding to the predominant noise source, while steering to the desired output signal S ⁇ n t .
- Fig. 14 depicts system 410 of still another embodiment of the present invention.
- System 410 is depicted with several reference numerals that are the same as those used in connection with systems 10 and 310 and are intended to designate like features.
- a number of acoustic sources 412, 414, 416, 418 are depicted in Fig. 14 within the reception range of acoustic sensors 22, 24 of system 410.
- the positions of sources 412, 414, 416, 418 are also represented by the azimuth angles relative to axis AZ that are designated with reference numerals 412a, 414a, 416a, 418a.
- angles 412a, 414a, 416a, 418a correspond to about 0°, +20°, +75°, and -75°, respectively.
- Sensors 22, 24 are operatively coupled to signal processor 430 with axis AZ extending about midway therebetween.
- Processor 430 receives input signals x Ln (t), x Rn (t) from sensors 22, 24 corresponding to left channel L and right channel R as described in connection with system 310.
- Processor 430 processes signals x Ln (t), x Rn (t) and provides corresponding output signals to output devices 90, 490 operatively coupled thereto.
- System 410 includes D/A converters 34a, 34b and DFT stages 36a, 36b to provide the same left and right channel processing as described in connection with system 310.
- localization operator 460 of system 410 directly receives the output signals of delay operator 340 instead of the output signals of signal operator 350, unlike system 310.
- the localization technique embodied in operator 460 begins by establishing two-dimensional (2-D) plots of coincidence loci in terms of frequency versus azimuth position.
- the coincidence points of each loci represent a minimum difference between the left and right channels for each frequency as indexed by m. This minimum difference may be expressed as the minimum magnitude difference ⁇ X n (i) ( m ) between the frequency domain representations X Lp (i) ( m ) and X Lp (i) ( m ), at each discrete frequency m, yielding M/2 potentially different loci. If the acoustic sources are spatially coherent, then these loci will be the same across all frequencies.
- phase difference technique detects the minimum angle between two complex vectors, there is also no need to compensate for the inter-sensor intensity difference.
- Fig. 17 illustrates a 2-D coincidence plot 500 in terms of frequency in Hertz (Hz) along the vertical axis and azimuth position in degrees along the horizontal axis.
- Plot 500 indicates two sources corresponding to the generally vertically aligned locus 512a at about -20 degrees and the vertically aligned locus 512b at about + 40 degrees.
- Plot 500 also includes misidentified or phantom source points 514a, 514b, 514c, 514d, 514e at other azimuths positions that correspond to frequencies where both sources have significant energy. For more than two differently located competing acoustic sources, an even more complex plot generally results.
- localization operator 460 integrates over time and frequency.
- the signals are not correlated at each frequency, the mutual interference between the signals can be gradually attenuated by the temporal integration.
- This approach averages the locations of the coincidences, not the value of the function used to determine the minima, which is equivalent to applying a Kronecker delta function, ⁇ ( i-i n ( m )) to ⁇ X n (i) ( m ) and averaging the ⁇ ( i-i n ( m )) over time.
- the coincidence loci corresponding to the true position of the sources are enhanced.
- ⁇ 0 is an empirically determined threshold. While this approach assumes the inter-sensor delays are independent of frequency, it has been found that departures from this assumption may generally be considered negligible.
- the peaks in H n ( ⁇ d ) represent the source azimuth positions. If there are Q sources, Q peaks in H N ( ⁇ d ) may generally be expected. When compared with the patterns ⁇ ( i-i n ( m )) at each frequency, not only is the accuracy of localization enhanced when more than one sound source is present, but also almost immediate localization of multiple sources for the current frame is possible. Furthermore, although a dominant source usually has a higher peak in H N ( ⁇ d ) than do weaker sources, the height of a peak in H N ( ⁇ d ) only indirectly reflects the energy of the sound source.
- the height is influenced by several factors such as the energy of the signal component corresponding to ⁇ d relative to the energy of the other signal components for each frequency band, the number of frequency bands, and the duration over which the signal is dominant.
- each frequency is weighted equally in equation (28).
- equation (28) As a result, masking of weaker sources by a dominant source is reduced.
- existing time-domain cross-correlation methods incorporate the signal intensity, more heavily biasing sensitivity to the dominant source.
- the interaural time difference is ambiguous for high frequency sounds where the acoustic wavelengths are less than the separation distance D between sensors 22, 24.
- This ambiguity arises from the occurrence of phase multiples above this inter-sensor distance related frequency, such that a particular phase difference ⁇ cannot be distinguished from ⁇ +2 ⁇ .
- the graph 600 of Fig. 18 illustrates a number of representative coincidence patterns 612, 614, 616, 618 determined in accordance with equations (31) and (32); where the vertical axis represents frequency in Hz and the horizontal axis represents azimuth position in degrees. Pattern 612 corresponds to the azimuth position of 0°. Pattern 612 has a primary relationship corresponding to the generally straight, solid vertical line 612a and a number of secondary relationships corresponding to curved solid line segments 612b.
- patterns 614, 616, 618 correspond to azimuth positions of -75°, 20°, and 75° and have primary relationships shown as straight vertical lines 614a, 616a, 618a and secondary relationships shown as curved line segments 614b, 616b, 618b, in correspondingly different broken line formats.
- the vertical lines are designated primary contours and the curved line segments are designated secondary contours.
- Coincidence patterns for other azimuth positions may be determined with equations (31) and (32) as would occur to those skilled in the art.
- each stencil is a predictive pattern of the coincidence points attributable to an acoustic source at the azimuth position of the primary contour, including phantom loci corresponding to other azimuth positions as a factor of frequency.
- the stencil pattern may be used to filter the data at different values of m.
- a ( ⁇ d ) denotes the number of points involved in the summation.
- equation (33) is used in place of equation (30) when the second technique of integration over frequency is desired.
- both variables ⁇ i and ⁇ i are equivalent and represent the position in the dual delay-line.
- ⁇ d the range of valid ⁇ m,d is given by equation (35) as follows: - ITD max / 2 + ⁇ d ⁇ f m ⁇ ⁇ m . d ⁇ ITD max / 2 - ⁇ d ⁇ f m , ⁇ m , d is an integer . Changing value of ⁇ d only shifts the coincidence pattern (or stencil pattern) along the ⁇ i -axis without changing its shape.
- equations (34) and (35) may be utilized as an alternative to separate patterns for each azimuth position of interest; however, because the scaling of the delay units ⁇ i is uniform along the dual delay-line, azimuthal partitioning by the dual delay-line is not uniform, with the regions close to the median plane having higher azimuthal resolution. On the other hand, in order to obtain an equivalent resolution in azimuth, using a uniform ⁇ i would require a much larger I of delay units than using a uniform ⁇ i .
- the signal flow diagram of Fig. 16 further illustrates selected details concerning localization operator 460.
- equalization factors ⁇ i ( m ) set to unity, the delayed signal of pairs of delay stages 344 are sent to coincidence detection operators 462 for each frequency indexed to m to determine the coincidence points.
- Detection operators 462 determine the minima in accordance with equation (22) or (26).
- Each coincidence detection operator 462 sends the results i n ( m ) to a corresponding pattern generator 464 for the given m.
- Generators 464 build a 2-D coincidence plot for each frequency indexed to m and pass the results to a corresponding summation operator 466 to perform the operation expressed in equation (28) for that given frequency.
- Summation operators 466 approximate integration over time.
- Summation operators 466 pass results to summation operator 468 to approximate integration over frequency.
- Operators 468 may be configured in accordance with equation (30) if artifacts resulting from the secondary relationships at high frequencies are not present or may be ignored.
- stencil filtering with predictive coincidence patterns that include the secondary relationships may be performed by applying equation (33) with summation operator 468.
- Operator 468 outputs H N ( ⁇ d ) to output device 490 to map corresponding acoustic source positional information.
- Device 490 preferably includes a display or printer capable of providing a map representative of the spatial arrangement of the acoustic sources relative to the predetermined azimuth positions.
- the acoustic sources may be localized and tracked dynamically as they move in space. Movement trajectories may be estimated from the sets of locations ⁇ ( i - i n ( m )) computed at each sample window n.
- output device 490 is preferably not included. In still other embodiments, output device 90 may not be included.
- the localization techniques of localization operator 460 are particularly suited to localize more than two acoustic sources of comparable sound pressure levels and frequency ranges, and need not specify an on-axis desired source. As such, the localization techniques of system 410 provide independent capabilities to localize and map more than two acoustic sources relative to a number of positions as defined with respect to sensors 22, 24. However, in other embodiments, the localization capability of localization operator 460 may also be utilized in conjunction with a designated reference source to perform extraction and noise suppression. Indeed, extraction operator 480 of the illustrated embodiment incorporates such features as more fully described hereinafter.
- These signals include a component of the desired signal at frequency m as well as components from sources other than the one to be canceled.
- the equalization factors ⁇ i ( m ) need not be set to unity once localization has taken place.
- X n i noise ⁇ 2 m
- X n i noiseQ m
- the original signal ⁇ s ( m ) X Ln (s) (m) is included.
- the resulting beam pattern may at times amplify other less intense noise sources.
- the amount of noise amplification is larger than the amount of cancellation of the most intense noise source, further conditions may be included in operator 480 to prevent changing the input signal for that frequency at that moment.
- Processors 30, 330, 430 include one or more components that embody the corresponding algorithms, stages, operators, converters, generators, arrays, procedures, processes, and techniques described in the respective equations and signal flow diagrams in software, hardware, or both utilizing techniques known to those skilled in the art.
- Processors 30, 330, 430 may be of any type as would occur to those skilled in the art; however, it is preferred that processors 30, 330, 430 each be based on a solid-state, integrated digital signal processor with dedicated hardware to perform the necessary operations with a minimum of other components.
- Systems 310, 410 may be sized and adapted for application as a hearing aide of the type described in connection with Fig. 4A .
- sensors application 22, 24 are sized and shaped to fit in the pinnae of a listener, and the processor algorithms are adjusted to account for shadowing caused by the head and torso. This adjustment may be provided by deriving a Head-Related-Transfer-Function (HRTF) specific to the listener or from a population average using techniques known to those skilled in the art. This function is then used to provide appropriate weightings of the dual delay stage output signals that compensate for shadowing.
- HRTF Head-Related-Transfer-Function
- system 310, 410 are adapted to voice recognition systems of the type described in connection with Fig. 4B .
- systems 310, 410 may be utilized in sound source mapping applications, or as would otherwise occur to those skilled in the art.
- a signal processing system includes a first sensor configured to provide a first signal corresponding to an acoustic excitation; where this excitation includes a first acoustic signal from a first source and a second acoustic signal from a second source displaced from the first source.
- the system also includes a second sensor displaced from the first sensor that is configured to provide a second signal corresponding to the excitation.
- a processor responsive to the first and second sensor signals that has means for generating a desired signal with a spectrum representative of the first acoustic signal.
- This means includes a first delay line having a number of first taps to provide a number of delayed first signals and a second delay line having a number of second taps to provide a number of delayed second signals.
- the system also includes output means for generating a sensory output representative of the desired signal.
- a method of signal processing includes detecting an acoustic excitation at both a first location to provide a corresponding first signal and at a second location to provide a corresponding second signal.
- the excitation is a composite of a desired acoustic signal from a first source and an interfering acoustic signal from a second source that is spaced apart from the first source.
- This method also includes spatially localizing the second source relative to the first source as a function of the first and second signals and generating a characteristic signal representative of the desired acoustic signal during performance of this localization.
- a Sun Sparc-20 workstation was programmed to emulate the signal extraction process of the present invention.
- One loudspeaker (L1) was used to emit a speech signal and another loudspeaker (L2) was used to emit babble noise in a semi-anechoic room.
- Two microphones of a conventional type were positioned in the room and operatively coupled to the workstation. The microphones had an inter-microphone distance of about 15 centimeters and were positioned about 3 feet from L1.
- L1 was aligned with the midpoint between the microphones to define a zero degree azimuth.
- L2 was placed at different azimuths relative to L1 approximately equidistant to the midpoint between L1 and L2.
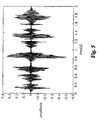
- FIG. 5 a clean speech of a sentence about two seconds long is depicted, emanating from L1 without interference from L2.
- FIG. 6 depicts a composite signal from L1 and L2.
- the composite signal includes babble noise from L2 combined with the speech signal depicted in FIG. 5 .
- the babble noise and speech signal are of generally equal intensity (0dB) with L2 placed at a 60 degree azimuth relative to L1.
- FIG. 7 depicts the signal recovered from the composite signal of FIG. 6 . This signal is nearly the same as the signal of FIG. 5 .
- FIG. 8 depicts another composite signal where the babble noise is 30dB more intense than the desired signal of FIG. 5 . Furthermore, L2 is placed at only a 2 degree azimuth relative to L1.
- FIG. 9 depicts the signal recovered from the composite signal of FIG. 8 , providing a clearly intelligible representation of the signal of FIG. 5 despite the greater intensity of the babble noise from L2 and the nearby location.
- the experimental set-up for the tests utilized two microphones for sensors 22, 24 with an inter-microphone distance of about 144mm. No diffraction or shadowing effect existed between the two microphones, and the inter-microphone intensity difference was set to zero for the tests.
- the signals were low-pass filtered at 6 kHz and sampled at a 12.8-kHz rate with 16-bit quantization.
- a Wintel-based computer was programmed to receive the quantized signals for processing in accordance with the present invention and output the test results described hereinafter.
- a 20-ms segment of signal was weighted by a Hamming window and then padded with zeros to 2048 points for DFT, and thus the frequency resolution was about 6Hz.
- the dual delay-line used in the tests was azimuth-uniform.
- the coincidence detection method was based on minimum magnitude differences.
- Each of the five tests consisted of four subtests in which a different talker was taken as the desired source.
- the speech materials four equally-intense spondaic words
- the speech material was presented in free-field.
- the localization of the talkers was done using both the equation (30) and equation (33) techniques.
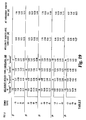
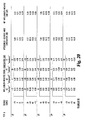
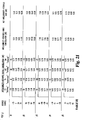
- the experimental results are presented in Tables I, II, III, and IV of FIGs. 19-22 , respectively.
- the five tests described in Table I of FIG. 19 approximate integration over frequency by utilizing equation (30); and includes two male speakers M1, M2 and two female speakers F1, F2.
- the five tests described in Table II of FIG. 20 are the same as Table I, except that integration over frequency was approximated by equation (33).
- the five tests described in Table III of FIG. 21 approximate integration over frequency by utilizing equation (30); and includes two different male speakers M3, M4 and two different female speakers F3, F4.
- the five tests described in Table IV of FIG. 22 are the same as Table III. except that integration over frequency was approximated by equation (33).
- the data was arranged in a matrix with the numbers on the diagonal line representing the degree of noise cancellation in dB of the desired source (ideally 0 dB) and the numbers elsewhere representing the degree of noise cancellation for each noise source.
- the next to the last column shows a degree of cancellation of all the noise sources lumped together, while the last column gives the net intelligibility-weighted improvement (which considers both noise cancellation and loss in the desired signal).
- the results generally show cancellation in the intelligibility-weighted measure in a range of about 3-11 dB, while degradation of the desired source was generally less than about 0.1 dB).
- the total noise cancellation was in the range of about 8-12 dB.
- Comparison of the various Tables suggests very little dependence on the talker or the speech materials used in the tests. Similar results were obtained from six-talker experiments. Generally, a 7-10 dB enhancement in the intelligibility-weighted signal-to-noise ratio resulted when there were six equally loud, temporally aligned speech sounds originating from six different loudspeakers.
Landscapes
- Engineering & Computer Science (AREA)
- Physics & Mathematics (AREA)
- Health & Medical Sciences (AREA)
- General Health & Medical Sciences (AREA)
- Neurosurgery (AREA)
- Otolaryngology (AREA)
- Acoustics & Sound (AREA)
- Signal Processing (AREA)
- Computer Networks & Wireless Communication (AREA)
- Circuit For Audible Band Transducer (AREA)
- Measurement Of Velocity Or Position Using Acoustic Or Ultrasonic Waves (AREA)
- Stereophonic Arrangements (AREA)
- Stereophonic System (AREA)
- Measurement Of Mechanical Vibrations Or Ultrasonic Waves (AREA)
Abstract
Description
- This application is a continuation-in-part of commonly owned, co-pending United States Patent Application Serial No.
08/666,757, filed on June 19, 1996 to Feng et al. , and entitled BINAURAL SIGNAL PROCESSING SYSTEM AND METHOD. - The present invention is directed to the processing of acoustic signals, and more particularly, but not exclusively, relates to the localization and extraction of acoustic signals emanating from different sources.
- The difficulty of extracting a desired signal in the presence of interfering signals is a long-standing problem confronted by acoustic engineers. This problem impacts the design and construction of many kinds of devices such as systems for voice recognition and intelligence gathering. Especially troublesome is the separation of desired sound from unwanted sound with hearing aid devices. Generally, hearing aid devices do not permit selective amplification of a desired sound when contaminated by noise from a nearby source - - particularly when the noise is more intense. This problem is even more severe when the desired sound is a speech signal and the nearby noise is also a speech signal produced by multiple talkers (e.g. babble). As used herein, "noise" refers to random or nondeterministic signals and alternatively or additionally refers to any undesired signals and/or any signals interfering with the perception of a desired signal.
- One attempted solution to this problem has been the application of a single, highly directional microphone to enhance directionality of the hearing aid receiver. This approach has only a very limited capability. As a result, spectral subtraction, comb filtering, and speech-production modeling have been explored to enhance single microphone performance. Nonetheless, these approaches still generally fail to improve intelligibility of a desired speech signal, particularly when the signal and noise sources are in close proximity.
- Another approach has been to arrange a number of microphones in a selected spatial relationship to form a type of directional detection beam. Unfortunately, when limited to a size practical for hearing aids, beam forming arrays also have limited capacity to separate signals that are close together -- especially if the noise is more intense than the desired speech signal. In addition, in the case of one noise source in a less reverberant environment, the noise cancellation provided by the beam-former varies with the location of the noise source in relation to the microphone array. R.W. Stadler and W.M. Rabinowitz, On the Potential of Fixed Arrays for Hearing Aids, 94 Journal Acoustical Society of America 1332 (September 1993), and W. Soede et al., Development of a Directional Hearing Instrument Based on Array Technology, 94 Journal of Acoustical Society of America 785 (August 1993) are cited as additional background concerning the beamforming approach.
- Still another approach has been the application of two microphones displaced from one another to provide two signals to emulate certain aspects of the binaural hearing system common to humans and many types of animals. Although certain aspects of biologic binaural hearing are not fully understood, it is believed that the ability to localize sound sources is based on evaluation by the auditory system of binaural time delays and sound levels across different frequency bands associated with each of the two sound signals. The localization of sound sources with systems based on these interaural time and intensity differences is discussed in W. Lindemann, Extension of a Binaural Cross-Correlation Model by Contralateral Inhibition - I. Simulation of Lateralization for Stationary Signals, 80 Journal of the Acoustical Society of America 1608 (December 1986).
- The localization of multiple acoustic sources based on input from two microphones presents several significant challenges, as does the separation of a desired signal once the sound sources are localized. For example, the system set forth in Markus Bodden, Modeling Human Sound-Source Localization and the Cocktail-Party-Effect, 1 Acta Acustica 43 (February/April 1993) employs a Wiener filter including a windowing process in an attempt to derive a desired signal from binaural input signals once the location of the desired signal has been established. Unfortunately, this approach results in significant deterioration of desired speech fidelity. Also, the system has only been demonstrated to suppress noise of equal intensity to the desired signal at an azimuthal separation of at least 30 degrees. A more intense noise emanating from a source spaced closer than 30 degrees from the desired source continues to present a problem. Moreover, the proposed algorithm of the Bodden system is computationally intense -- posing a serious question of whether it can be practically embodied in a hearing aid device.
- Another example of a two microphone system is found in D. Banks, Localisation and Separation of Simultaneous Voices with Two Microphones, IEE Proceedings-I, 140 (1993). This system employs a windowing technique to estimate the location of a sound source when there are nonoverlapping gaps in its spectrum compared to the spectrum of interfering noise. This system cannot perform localization when wide-band signals lacking such gaps are involved. In addition, the Banks article fails to provide details of the algorithm for reconstructing the desired signal.
U.S. Patent Nos. 5.479,522 to Lindemann et al. ;5,325,436 to Soli et al. ;5,289,544 to Franklin ; and4,773,095 to Zwicker et al . are cited as sources of additional background concerning dual microphone hearing aid systems. Another example of the separation of a sound source is given inEP 0 851 458 A2claim 1. - Effective localization is also often hampered by ambiguous positional information that results above certain frequencies related to the spacing of the input microphones. This problem was recognized in Stern, R. M., Zeiberg, A. S., and Trahiotis, C. "Lateralization of complex binaural stimuli: A weighted-image model." J. Acoust. Soc. Am. 84, 156-165 (1988).
- Thus, a need remains for more effective localization and extraction techniques - especially for use with binaural systems. The present invention meets these needs and offers other significant benefits and advantages.
- The present invention relates to the processing of acoustic signals. Various aspects of the invention are novel, nonobvious, and provide various advantages. While the actual nature of the invention covered herein can only be determined with reference to the claims appended hereto, selected forms and features of the preferred embodiments as disclosed herein are described briefly as follows.
- One form of the present invention includes a method having the features of
claim 1, which follows. - A further form of the present invention is a system having the features of claim 9, which follows.
- Accordingly, it is one object of the present invention to provide for the enhanced localization of multiple acoustic sources.
- It is another object to extract a desired acoustic signal from a noisy environment caused by a number of interfering sources.
- An additional object is to provide a system for the localization and extraction of acoustic signals by detecting a combination of these signals with two differently located sensors.
- Further embodiments, objects, features, aspects, benefits, forms, and advantages of the present invention shall become apparent from the detailed drawings and descriptions provided herein.
-
-
FIG. 1 is a diagrammatic view of a system of one embodiment of the present invention. -
FIG. 2 is a signal flow diagram further depicting selected aspects of the system ofFIG. 1 . -
FIG. 3 is schematic representation of the dual delay line ofFIG. 2 . -
FIGS. 4A and 4B depict other embodiments of the present invention corresponding to hearing aid and computer voice recognition applications, respectively. -
FIG. 5 is a graph of a speech signal in the form of a sentence about 2 seconds long. -
FIG. 6 is a graph of a composite signal including babble noise and the speech signal ofFIG. 5 at a 0 dB signal-to-noise ratio with the babble noise source at about a 60 azimuth relative to the speech signal source. -
FIG. 7 is a graph of a signal representative of the speech signal ofFIG. 5 after extraction from the composite signal ofFIG. 6 . -
FIG. 8 is a graph of a composite signal including babble noise and the speech signal ofFIG. 5 at a -30 dB signal-to-noise ratio with the babble noise source at a 2 degree azimuth relative to the speech signal source. -
FIG. 9 is a graphic depiction of a signal representative of the sample speech signal ofFIG. 5 after extraction from the composite signal ofFIG. 8 . -
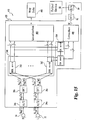
FIG. 10 is a signal flow diagram of another embodiment of the present invention. -
FIG. 11 is a partial, signal flow diagram illustrating selected aspects of the dual delay lines ofFIG. 10 in greater detail. -
FIG. 12 is a diagram illustrating selected geometric features of the embodiment illustrated inFIG. 10 for a representative example of one of a number of sound sources. -
FIG. 13 is a signal flow diagram illustrating selected aspects of the localization operator ofFIG. 10 in greater detail. -
FIG. 14 is a diagram illustrating yet another embodiment of the present invention. -
FIG. 15 is a signal flow diagram further illustrating selected aspects of the embodiment ofFIG. 14 . -
FIG. 16 is a signal flow diagram illustrating selected aspects of the localization operator ofFIG. 15 in greater detail. -
FIG. 17 is a graph illustrating a plot of coincidence loci for two sources. -
FIG. 18 is a graph illustrating coincidence patterns for azimuth positions corresponding to -75°, 0°, 20°, and 75°. -
FIGs. 19-22 are tables depicting experimental results obtained with the present invention. - For the purposes of promoting an understanding of the principles of the invention, reference will now be made to the embodiment illustrated in the drawings and specific language will be used to describe the same. It will nevertheless be understood that no limitation of the scope of the invention is thereby intended. Any alterations and further modifications in the described embodiments, and any further applications of the principles of the invention as described herein are contemplated as would normally occur to one skilled in the art to which the invention relates.
-
Fig. 1 illustrates an acousticsignal processing system 10 of one embodiment of the present invention.System 10 is configured to extract a desired acoustic signal fromsource 12 despite interference or noise emanating fromnearby source 14.System 10 includes a pair ofacoustic sensors sources Sensors processor 30 to process signals received therefrom. Also,processor 30 is operatively coupled tooutput device 90 to provide a signal representative of a desired signal fromsource 12 with reduced interference fromsource 14 as compared to composite acoustic signals presented tosensors sources -
Sensors sensor 22 tosensor 24. Reference axis R1 is aligned withsource 12 and intersects axis T perpendicularly through midpoint M. Axis N is aligned withsource 14 and also intersects midpoint M. Axis N is positioned to form angle A with reference axis R1.Fig. 1 depicts an angle A of about 20 degrees. Notably, reference axis R1 may be selected to define a reference azimuthal position of zero degrees in an azimuthalplane intersecting sources sensors source 12 is "on-axis" andsource 14, as aligned with axis N, is "off-axis."Source 14 is illustrated at about a 20 degree azimuth relative to source 12. - Preferably
sensors sensors - Referring additionally to
FIG. 2 , a signal flow diagram illustrates various processing stages for the embodiment shown inFIG. 1 .Sensors left sensor 22, andright sensor 24, respectively. Signals Lp(t) and Rp(t) are initially input toprocessor 30 in separate processing channels L and R. For each channel L, R, signals Lp(t) and Rp(t) are conditioned and filtered instages filter stages converters D stages - Discrete signals Lp(k) and Rp(k) are transformed from the time domain to the frequency domain by a short-term Discrete Fourier Transform (DFT) algorithm in
stages stages D stages D stages - Spectral signals XLp(m) and XRp(m) are input to
dual delay line 40 as further detailed inFIG. 3. FIG. 3 depicts twodelay lines delay line delay line 42, XLp(m) is alternatively designated XLp1(m). XLp1(m) is sequentially delayed by time delay increments τ1, τ2, τ3, ..., τN-2, τN-1, and τN to produce delayed outputs at the taps ofdelay line 42 which are respectively designated XLp2(m), XLp3(m), Xlp4(m), ..., XLpN-1(m), XLpN(m), and XLpN+1(m); (collectively designated XLpi(m)). Fordelay line 44, XRp(m) is alternatively designated XRpN+1(m). XRpN+1(m) is sequentially delayed by time delay increments increments τ1, τ2, τ3, ..., τN-2, τN-1, and τN to produce delayed outputs at the taps ofdelay line 44 which are respectively designated: XRpN(m), XRpN-1(m), XRpN-2(m), ..., XLp3(m), XLp2(m), and Xlp1(m); (collectively designated XRpi(m)). The input spectral signals and the signals fromdelay line operation array 46. A pair of taps fromdelay lines FIG. 3 . -
Operation array 46 has operation units (OP) numbered from 1 to N+1, depicted as OP1, OP2, OP3, OP4,..., OPN-2, OPN-1, OPN, OPN+1 and collectively designated operations OPi. Input pairs fromdelay lines array 46 as follows: OP1[XLp1(m), XRp1(m)], OP2[XLp2(m), XRp2(m)], OP3[XLp3(m), XRp3(m)], OP4[XLp4(m), XRp4(m)],..., OPN-2[XLp(N-2)(m), XRp(N-2)(m)], OPN-1[XLp(N-1)(m), XRp(N-1)(m)], OPN[XLpN(m), XRpN(m)], and OPN+1[XLp(N+1)(m), XRp(N+1)(m)]; where OPi[XLpi(m), XRpi(m)] indicates that OPi is determined as a function of input pair XLpi(m), XRpi(m). Correspondingly, the outputs ofoperation array 46 are Xp1(m), Xp2(m), Xp3(m), Xp4(m), ..., Xp(N-2)(m), Xp(N-1)(m), XpN(m), and Xp(N+1)(m) (collectively designated Xpi(m)). - For i =1 to i ≤ N/2, operations for each OPi of
array 46 are determined in accordance with complex expression 1 (CE1) as follows:
where exp[argument] represents a natural exponent to the power of the argument, and imaginary number j is the square root of -1. For i > ((N/2) +1) to i = N+1, operations ofoperation array 46 are determined in accordance complex expression 2 (CE2) as follows:
where exp[argument] represents a natural exponent to the power of the argument, and imaginary number j is the square root of -1. For i = (N/2)+1, neither CE1 nor CE2 is performed. - An example of the determination of the operations for N = 4 (i=1 to i=N+1) is as follows:
- i =1, CE1 applies as follows:

- i = 2 ≤ (N/2), CE1 applies as follows:

- i = 3: Not applicable, (N/2) < i ≤ ((N/2)+1);
- i = 4, CE2 applies as follows:

- i = 5, CE2 applies as follows:

- Referring to
FIGS. 1-3 , each OPi ofoperation array 46 is defined to be representative of a different azimuthal position relative to reference axis R. The "center" operation, OPi where i = ((N/2)+1), represents the location of the reference axis andsource 12. For the example N=4, this center operation corresponds to i = 3. This arrangement is analogous to the different interaural time differences associated with a natural binaural hearing system. In these natural systems, there is a relative position in each sound passageway within the ear that corresponds to a maximum "in phase" peak for a given sound source. Accordingly, each operation ofarray 46 represents a position corresponding to a potential azimuthal or angular position range for a sound source, with the center operation representing a source at the zero azimuth -- a source aligned with reference axis R. For an environment having a single source without noise or interference, determining the signal pair with the maximum strength may be sufficient to locate the source with little additional processing; however, in noisy or multiple source environments, further processing may be needed to properly estimate locations. - It should be understood that
dual delay line 40 provides a two dimensional matrix of outputs with N+1 columns corresponding to Xpi(m), and M rows corresponding to each discrete frequency f m of Xpi(m). This (N+1)xM matrix is determined for each short-term spectral analysis interval p. Furthermore, by subtracting XRpi(m) from XLpi(m), the denominator of each expression CE1, CE2 is arranged to provide a minimum value of Xpi(m) when the signal pair is "in-phase" at the given frequency f m.Localization stage 70 uses this aspect of expressions CE1, CE2 to evaluate the location ofsource 14 relative tosource 12. -
Localization stage 70 accumulates P number of these matrices to determine the Xpi(m) representative of the position ofsource 14. For each column i,localization stage 70 performs a summation of the amplitude of |Xpi(m)| to the second power over frequencies f m from m=1 to m=M. The summation is then multiplied by the inverse of M to find an average spectral energy as follows:
The resulting averages, Xavgpi are then time averaged over the P most recent spectral-analysis time frames indexed by p in accordance with:
where yp are empirically determined weighting factors. In one embodiment, the yp factors are preferably between 0.85p and 0.90p, where p is the short-term spectral analysis time frame index. The Xi are analyzed to determine the minimum value, min(Xi). The index i of min(Xi), designated "I," estimates the column representing the azimuthal location ofsource 14 relative tosource 12. - It has been discovered that the spectral content of a desired signal from
source 12, when approximately aligned with reference axis R1, can be estimated from XpI(m). In other words, the spectral signal output byarray 46 which most closely corresponds to the relative location of the "off-axis"source 14 contemporaneously provides a spectral representation of a signal emanating fromsource 12. As a result, the signal processing ofdual delay line 40 not only facilitates localization ofsource 14, but also provides a spectral estimate of the desired signal with only minimal post-localization processing to produce a representative output. - Post-localization processing includes provision of a designation signal by
localization stage 70 to conceptual "switch" 80 to select the output column XpI(m) of thedual delay line 40. The XpI(m) is routed byswitch 80 to an inverse Discrete Fourier Transform algorithm (Inverse DFT) instage 82 for conversion from a frequency domain signal representation to a discrete time domain signal representation denoted as s(k). The signal estimate s(k) is then converted by Digital to Analog (D/A)converter 84 to provide an output signal tooutput device 90. -
Output device 90 amplifies the output signal fromprocessor 30 withamplifier 92 and supplies the amplified signal tospeaker 94 to provide the extracted signal from asource 12. - It has been found that interference from off-axis sources separated by as little as 2 degrees from the on axis source may be reduced or eliminated with the present inventioneven when the desired signal includes speech and the interference includes babble. Moreover, the present invention provides for the extraction of desired signals even when the interfering or noise signal is of equal or greater relative intensity. By moving
sensors sources - The present invention greatly improves computational efficiency compared to conventional systems by determining a spectral signal representative of the desired signal as part of the localization processing. As a result, an output signal characteristic of a desired signal from
source 12 is determined as a function of the signal pair XLpI(m), XRpI(m) corresponding to the separation ofsource 14 fromsource 12. Also, the exponents in the denominator of CE1, CE2 correspond to phase difference of frequencies f m resulting from the separation ofsource 12 from 14. Referring to the example of N=4 and assuming that I=1, this phase difference is -2π(τ1+τ2)f m (for delay line 42) and 2π(τ3+τ4)f m (for delay line 44) and corresponds to the separation of the representative location of off-axis source 14 from the on-axis source 12 at i=3. Likewise the time increments, τ1+τ2 and τ3+τ4, correspond to the separation ofsource 14 fromsource 12 for this example. Thus,processor 30 implementsdual delay line 40 and corresponding operational relationships CE1, CE2 to provide a means for generating a desired=signal by locating the position of an interfering signal source relative to the source of the desired signal. - It is preferred that τi be selected to provide generally equal azimuthal positions relative to reference axis R. In one embodiment, this arrangement corresponds to the values of τi changing about 20% from the smallest to the largest value. In other embodiments, τi are all generally equal to one another, simplifying the operations of
array 46. Notably, the pair of time increments in the numerator of CE1, CE2 corresponding to the separation of thesources -
Processor 30 may be comprised of one or more components or pieces of equipment. The processor may include digital circuits, analog circuits, or a combination of these circuit types.Processor 30 may be programmable, an integrated state machine, or utilize a combination of these techniques. Preferably,processor 30 is a solid state integrated digital signal processor circuit customized to perform the process of the present invention with a minimum of external components and connections. Similarly, the extraction process of the present invention may be performed on variously arranged processing equipment configured to provide the corresponding functionality with one or more hardware modules, firmware modules, software modules, or a combination thereof. Moreover, as used herein, "signal" includes, but is not limited to, software, firmware, hardware, programming variable, communication channel, and memory location representations. - Referring to
FIG. 4A , one application of the present invention is depicted as hearingaid system 110.System 110 includes eyeglasses G withmicrophones Microphones aid processor 130.Processor 130 is operatively coupled tooutput device 190.Output device 190 is positioned in ear E to provide an audio signal to the wearer. -
Microphones sensors FIGS 1-3 . Similarly,processor 130 is configured with the signal extraction process depicted in ofFIGS. 1-3 .Processor 130 provides the extracted signal tooutput device 190 to provide an audio output to the wearer. The wearer ofsystem 110 may position glasses G to align with a desired sound source, such as a speech signal, to reduce interference from a nearby noise source off axis from the midpoint betweenmicrophones -
Processor 130 andoutput device 190 may be separate units (as depicted) or included in a common unit worn in the ear. The coupling betweenprocessor 130 andoutput device 190 may be an electrical cable or a wireless transmission. In one alternative embodiment,sensors processor 130 are remotely located and are configured to broadcast to one ormore output devices 190 situated in the ear E via a radio frequency transmission or other conventional telecommunication method. -
FIG. 4B shows avoice recognition system 210 employing the present invention as a front end speech enhancement device.System 210 includes personal computer C with twomicrophones Microphones processor 230 withincomputer C. Processor 230 provides an output signal for internal use or responsive reply viaspeakers visual display 296. An operator aligns in a predetermined relationship withmicrophones FIGS. 1-3 . - Referring to
Figs. 10-13 ,signal processing system 310 of another embodiment of the present invention is illustrated. Reference numerals ofsystem 310 that are the same as those ofsystem 10 refer to like features. The signal flow diagram ofFIG. 10 corresponds to various signal processing techniques ofsystem 310.Fig. 10 depicts left "L" and right "R" input channels forsignal processor 330 ofsystem 310. Channels L, R each include anacoustic sensor sensors FIG. 1 ofsystem 10, it is preferred thatsensors -
Sensors processor 330 ofsystem 310 to provide input signals x Ln(t) and x Rn(t) to A/D converters D converters processor 330 convert input signals x Ln(t) and x Rn(t) from an analog form to a discrete form as represented as xLn(k) and xRn(k), respectively; where "t" is the familiar continuous time domain variable and "k" is the familiar discrete sample index variable. A corresponding pair of preconditioning filters (not shown) may also be included inprocessor 330 as described in connection withsystem 10. - Digital Fourier Transform (DFT) stages 36a, 36b receive the digitized input signal pair xLn(k) and xRn(k) from
converters Stages -
Delay operator 340 receives spectral signals XLn(m) and XRn(m) fromstages Delay operator 340 includes a number of dual delay lines (DDLs) 342 each corresponding to a different one of the component frequencies indexed by m. Thus, there are M differentdual delay lines 342 utilized. However, onlydual delay lines 342 corresponding to m=1 and m=M are shown inFig. 10 to preserve clarity. The remaining dual delay lines corresponding to m=2 through m=(M-1) are represented by an ellipsis to preserve clarity. Alternatively,delay operator 340 may be described as a single dual delay line that simultaneously operates on M frequencies likedual delay line 40 ofsystem 10. - The pair of frequency components from
DFT stages dual delay lines 342. For the examples illustrated inFig. 10 , spectral signal component pair XLn(m=1) and XRn(m=1) is sent to the upperdual delay line 342 for the frequency corresponding to m=1; and spectral signal component pair XLn(m=M) and XRn(m=M) is sent to the lowerdual delay line 342 for the frequency corresponding to m=M. Likewise, common frequency component pairs of XLn(m) and XRn(m) for frequencies corresponding to m=2 throughm =(M-1) are each sent to a corresponding dual delay line as represented by ellipses to preserve clarity. - Referring additionally to
Fig. 11 , certain features ofdual delay line 342 are further illustrated. Eachdual delay line 342 includes a left channel delay line 342a receiving a corresponding frequency component input fromDFT stage 36a and rightchannel delay line 342b receiving a corresponding frequency component input fromDFT stage 36b.Delay lines 342a, 342b each include an odd number I of delay stages 344 indexed by i=1, 2, ..., I. The I number of delayed signal pairs are provided onoutputs 345 of delay stages 344 and are correspondingly sent tocomplex multipliers 346. There is onemultiplier 346 corresponding to eachdelay stage 344 for eachdelay line 342a, 342b.Multipliers 346 provide equalization weighting for the corresponding outputs of delay stages 344. Each delayed signal pair from correspondingoutputs 345 has one member from adelay stage 344 of left delay line 342a and the other member from adelay stage 344 ofright delay line 342b.Complex multipliers 346 of eachdual delay line 342 output corresponding products of the I number of delayed signal pairs along taps 347. The I number of signal pairs fromtaps 347 for eachdual delay line 342 ofoperator 340 are input to signaloperator 350. - For each
dual delay line 342, the I number of pairs of multiplier taps 347 are each input to a different Operation Array (OA) 352 ofoperator 350. Each pair oftaps 347 is provided to adifferent operation stage 354 within acorresponding operation array 352. InFig. 11 , only a portion of delay stages 344,multipliers 346, and operation stages 354 are shown corresponding to the two stages at either end ofdelay lines 342a, 342b and the middle stages ofdelay lines 342a, 342b. The intervening stages follow the pattern of the illustrated stages and are represented by ellipses to preserve clarity. - For an arbitrary frequency ω m , delay times τ i are given by equation (1) as follows:

where, i is the integer delay stage index in the range (i=1, ...,I); ITDmax = D/c is the maximum Intermicrophone Time Difference; D is the distance betweensensors 

dual delay line 342 in accordance with equation (4) as follows:
- The dual delay-line structure is similar to the embodiment of
system 10, except that a different dual delay line is represented for each value of m andmultipliers 346 have been included to multiply eachcorresponding delay stage 344 by an appropriate one of equalization factors α i (m); where i is the delay stage index previously described. Preferably, elements α i (m) are selected to compensate for differences in the noise intensity atsensors - One preferred embodiment for determining equalization factors α i (m) assumes amplitude compensation is independent of frequency, regarding any departure from this model as being negligible. For this embodiment, the amplitude of the received sound pressure |p| varies with the source-receiver distance r in accordance with equations (A1) and (A2) as follows:


where |P L | and |P R | are the amplitude of sound pressures atsensors Fig. 12 depictssensors acoustic source S 1 within the range of reception to provide input signals xLn(t) and xRn(t). According to the geometry illustrated inFig. 12 , the distances rL and rR, from thesource S 1 to the left and right sensors, respectively, are given by equations (A3) and (A4), as follows:

- For a given delayed signal pair in the dual delay-
line 342 ofFIG. 11 to become equalized under this approach, the factors α i (m) and αJ-i+l (m) must satisfy equation (A5) as follows:


where, K is in units of inverse length and is chosen to provide a convenient amplitude level, the value of α l-i+1 (m) is given by equation (A8) as follows:
where, the relation sinθl-i+1 =-sinθi can be obtained by substituting I-i + 1 into i in equation (3). By substituting equations (A7) and (A8) into equation (A6), it may be verified that the values assigned to α i (m) in equation (A7) satisfy the condition established by equation (A6). - After obtaining the equalization factors α i (m) in accordance with this embodiment, minor adjustments are preferably made to calibrate for asymmetries in the sensor arrangement and other departures from the ideal case such as those that might result from media absorption of acoustic energy, an acoustic source geometry other than a point source, and dependence of amplitude decline on parameters other than distance.
- After equalization by factors α i (m) with
multipliers 346, the in-phase desired signal component is generally the same in the left and right channels of thedual delay lines 342 for the delayed signal pairs corresponding to i = i signal = s, and the in-phase noise signal component is generally the same in the left and right channels of thedual delay lines 342 for the delayed signal pairs corresponding to i = i noise = g for the case of a single, predominant interfering noise source. The desired signal at i=s may be expressed as Sn (m) = As exp[j(ω mt + Φ s )]; and the interfering signal at i=g may be expressed as Gn(m) = Ag exp[j(ω mt+Φg )], where Φs and Φg denote initial phases. Based on these models, equalized signals αi(m)XLn (i) (m) for the left channel and α l-i+1(m)XRn (i)(m) for the right channel at any arbitrary point i (except i = s) alongdual delay lines 342 may be expressed in equations (5) and (6) as follows:

where equations (7) and (8) further define certain terms of equations (5) and (6) as follows:

- Each signal pair αi (m)XLn (i) (m) and α l-i+1(m)XRn (i) (m) is input to a
corresponding operation stage 354 of a corresponding one ofoperation arrays 352 for all m; where eachoperator array 352 corresponds to a different value of m as in the case ofdual delay lines 342. For a givenoperation array 352, operation stages 354 corresponding to each value of I, except i=s, perform the operation defined by equation (9) as follows: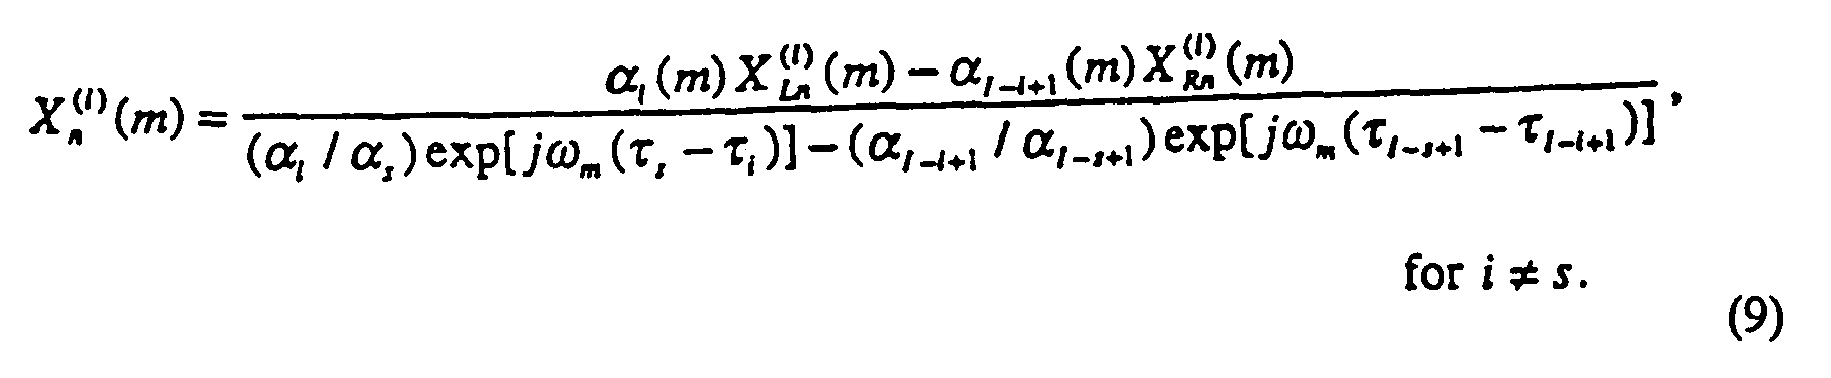
operation stage 354 on the signal pair corresponding to i=s for all m (alloperation arrays 352 of signal operator 350). - Equation (9) is comparable to the expressions CE1 and CE2 of
system 10; however, equation (9) includes equalization elements α i (m) and is organized into a single expression. With the outputs fromoperation array 352, the simultaneous localization and identification of the spectral content of the desired signal may be performed withsystem 310. Localization and extraction withsystem 310 are further described by the signal flow diagram ofFig. 13 and the following mathematical model. By substituting equations (5) and (6) into equation (9), equation (10) results as follows:
where equation (11) further defines:

The energy of the signal Xn (i) (m) is expressed in equation (13) as follows:

where, T denotes transposition. The energy

Equation (14) is a double summation over time and frequency that approximates a double integration in a continuous time domain representation. - Further defining the following vectors:

and
the energy of vectors s and g(i) are respectively defined by equations (15) and (16) as follows:

- For a desired signal that is independent of the interfering source, the vectors s and g(i) are orthogonal. In accordance with the Theorem of Pythagoras, equation (17) results as follows:


- Thus, the localization procedure includes finding the position i noise along the
operation array 352 for each of thedelay lines 342 that produces the minimum value of
dual delay line 342 is determined, the azimuth position of the noise source may be determined with equation (3). The estimated noise location i noise may be utilized for noise cancellation or extraction of the desired signal as further described hereinafter. Indeed, operation stages 354 for all m corresponding to i = i noise provide the spectral components of the desired signal as given by equation (20):
-
Localization operator 360 embodies the localization technique ofsystem 310.Fig. 13 further depictsoperator 360 with coupled pairs ofsummation operators summation operators 
summation operators 362 each receive Xn (i)(1) through Xn (i)(M) inputs from operation stages 354 corresponding to their value of i and sums over frequencies m=1 through m=M. For the illustrated example, theupper summation operator 362 corresponds to i=1 and receives signals Xn (1)(1) through Xn (1)(M) for summation; and thelower summation operator 362 corresponds to i=I and receives signals Xn (I)(1) through Xn (I)(M) for summation. - Each
summation operator 364 receives the results for each transform time frame n from thesummation operator 362 corresponding to the same value of i and accumulates a sum of the results over time corresponding to n=1 through n=N transform time frames; where N is a quantity of time frames empirically determined to be suitable for localization. For the illustrated example, theupper summation operator 364 corresponds to i=1 and sums the results from theupper summation operator 362 over N samples; and thelower summation operator 364 corresponds to i=I and sums the results from thelower summation operator 362 over N samples. - The I number of values of

summation operators 364 are received bystage 366.Stage 366 compares the I number of

stage 366 as i = g = i noise. - Referring back to
Fig. 10 , post-localization processing bysystem 310 is further described. When equation (9) is applied to the pair inputs ofdelay lines 342 at i=g, it corresponds to the position of the off-axis noise source and equation (20) shows it provides an approximation of the desired signal

stage 366 oflocalization unit 360 toextraction operator 380. In response to g,extraction operator 380 routes the outputs Xn (g)(1) through
stage 82 operatively coupled thereto. For this purpose,extraction operator 380 preferably includes a multiplexer or matrix switch that has IxM complex inputs and M complex outputs; where a different set of M inputs is routed to the outputs for each different value of the index I in response to the output fromstage 366 oflocalization operator 360. -
Stage 82 converts the M spectral components received fromextraction unit 380 to transform the spectral approximation of the desired signal,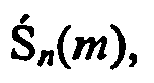

Stage 82 is operatively coupled to digital-to-analog (D/A)converter 84. D/A converter 84 receives signal


output device 90 to provide an auditory representation of the desired signal or other indicia as would occur to those skilled in the art.Stage 82,converter 84, anddevice 90 are further described in connection withsystem 10. - Another form of expression of equation (9) is given by equation (21) as follows:


-
Fig. 14 depictssystem 410 of still another embodiment of the present invention.System 410 is depicted with several reference numerals that are the same as those used in connection withsystems acoustic sources Fig. 14 within the reception range ofacoustic sensors system 410. The positions ofsources reference numerals angles Sensors processor 430 with axis AZ extending about midway therebetween.Processor 430 receives input signals xLn(t), xRn(t) fromsensors system 310.Processor 430 processes signals xLn(t), xRn(t) and provides corresponding output signals tooutput devices - Referring additionally to the signal flow diagram of
Fig. 15 , selected features ofsystem 410 are further illustrated.System 410 includes D/A converters DFT stages system 310.System 410 includesdelay operator 340 andsignal operator 350 as described forsystem 310; however it is preferred that equalization factors αi (m) (i=1, ..., I) be set to unity for the localization processes associated withlocalization operator 460 ofsystem 410. Furthermore,localization operator 460 ofsystem 410 directly receives the output signals ofdelay operator 340 instead of the output signals ofsignal operator 350, unlikesystem 310. - The localization technique embodied in
operator 460 begins by establishing two-dimensional (2-D) plots of coincidence loci in terms of frequency versus azimuth position. The coincidence points of each loci represent a minimum difference between the left and right channels for each frequency as indexed by m. This minimum difference may be expressed as the minimum magnitude difference δXn (i) (m) between the frequency domain representations XLp (i) (m) and XLp (i) (m), at each discrete frequency m, yielding M/2 potentially different loci. If the acoustic sources are spatially coherent, then these loci will be the same across all frequencies. This operation is described in equations (22)-(25) as follows:


- If the amplitudes of the left and right channels are generally the same at a given position along
dual delay lines 342 ofsystem 410 as indexed by i, then the values of δXn (i)(m) for the corresponding value of i is minimized, if not essentially zero. It is noted that, despite inter-sensor intensity differences, equalization factors α i (m) (i=1, ...,I) should be maintained close to unity for the purpose of coincidence detection; otherwise, the minimal δXn (i) (m) will not correspond to the in-phase (coincidence) locations. - An alternative approach may be based on identifying coincidence loci from the phase difference. For this phase difference approach, the minimum of the phase difference between the left and right channel signals at positions along the
dual delay lines 342, as indexed by i, are located as described by the following equations (26) and (27):

where, Im[•] denotes the imaginary part of the argument, and the superscript † denotes a complex conjugate. Since the phase difference technique detects the minimum angle between two complex vectors, there is also no need to compensate for the inter-sensor intensity difference. - While either the magnitude or phase difference approach may be effective without further processing to localize a single source, multiple sources often emit spectrally overlapping signals that lead to coincidence loci which correspond to nonexistent or phantom sources (e.g., at the midpoint between two equal intensity sources at the same frequency).
Fig. 17 illustrates a 2-D coincidence plot 500 in terms of frequency in Hertz (Hz) along the vertical axis and azimuth position in degrees along the horizontal axis.Plot 500 indicates two sources corresponding to the generally vertically alignedlocus 512a at about -20 degrees and the vertically alignedlocus 512b at about + 40 degrees. Plot 500 also includes misidentified orphantom source points - To reduce the occurrence of phantom information in the 2-D coincidence plot data,
localization operator 460 integrates over time and frequency. When the signals are not correlated at each frequency, the mutual interference between the signals can be gradually attenuated by the temporal integration. This approach averages the locations of the coincidences, not the value of the function used to determine the minima, which is equivalent to applying a Kronecker delta function, δ(i-in (m)) to δX n (i) (m) and averaging the δ(i-in (m)) over time. In turn, the coincidence loci corresponding to the true position of the sources are enhanced. Integration over time applies a forgetting average to the 2-D coincidence plots acquired over a predetermined set of transform time frames from n =1,..., N; and is expressed by the summation approximation of equation (28) as follows:
where, 0<β<1 is a weighting coefficient which exponentially de-emphasizes (or forgets) the effect of previous coincidence results, δ(•) is the Kronecker delta function, θ i represents the position along the dual delay-lines 342 corresponding to spatial azimuth θ i [equation (2)], and N refers to the current time frame. To reduce the cluttering effect due to instantaneous interactions of the acoustic sources, the results of equation (28) are tested in accordance with the relationship defined by equation (29) as follows:
where Γ≥0, is an empirically determined threshold. While this approach assumes the inter-sensor delays are independent of frequency, it has been found that departures from this assumption may generally be considered negligible. - By integrating the coincidence plots across frequency, a more robust and reliable indication of the locations of sources in space is obtained. Integration of Pn (θ i,m) over frequency produces a localization pattern which is a function of azimuth. Two techniques to estimate the true position of the acoustic sources may be utilized. The first estimation technique is solely based on the straight vertical traces across frequency that correspond to different azimuths. For this technique, θ d denotes the azimuth with which the integration is associated, such that θ d = θ i , and results in the summation over frequency of equation (30) as follows:

where, equation (30) approximates integration over time. - The peaks in Hn (θ d ) represent the source azimuth positions. If there are Q sources, Q peaks in HN (θd ) may generally be expected. When compared with the patterns δ(i-in (m)) at each frequency, not only is the accuracy of localization enhanced when more than one sound source is present, but also almost immediate localization of multiple sources for the current frame is possible. Furthermore, although a dominant source usually has a higher peak in HN (θd ) than do weaker sources, the height of a peak in HN (θ d ) only indirectly reflects the energy of the sound source. Rather, the height is influenced by several factors such as the energy of the signal component corresponding to θ d relative to the energy of the other signal components for each frequency band, the number of frequency bands, and the duration over which the signal is dominant. In fact, each frequency is weighted equally in equation (28). As a result, masking of weaker sources by a dominant source is reduced. In contrast, existing time-domain cross-correlation methods incorporate the signal intensity, more heavily biasing sensitivity to the dominant source.
- Notably, the interaural time difference is ambiguous for high frequency sounds where the acoustic wavelengths are less than the separation distance D between
sensors 
where the parameter γ m,d is an integer, and each value of γ m,d defines a contour in the pattern PN (θ i,m). The primary relationship is associated with γm,d =0. For a specific θ d , the range of valid γ m,d is given by equation (32) as follows:
- The
graph 600 ofFig. 18 illustrates a number ofrepresentative coincidence patterns Pattern 612 corresponds to the azimuth position of 0°.Pattern 612 has a primary relationship corresponding to the generally straight, solidvertical line 612a and a number of secondary relationships corresponding to curvedsolid line segments 612b. Similarly,patterns vertical lines curved line segments - Notably, the existence of these ambiguities in PN (θ i.m) may generate artifactual peaks in HN (θ d ) after integration along θ d = θ i . Superposition of the curved traces corresponding to several sources may induce a noisier HN (θ d ) term. When far away from the peaks of any real sources, the artifact peaks may erroneously indicate the detection of nonexistent sources; however, when close to the peaks corresponding to true sources, they may affect both the detection and localization of peaks of real sources in HN (θ d ). When it is desired to reduce the adverse impact of phase ambiguity, localization may take into account the secondary relationships in addition to the primary relationship for each given azimuth position. Thus, a coincidence pattern for each azimuthal direction θ d (d=1, ..., I) of interest may be determined and plotted that may be utilized as a "stencil" window having a shape defined by PN (θ i,m) (i=1, ..., I; m=1, ..., M). In other words, each stencil is a predictive pattern of the coincidence points attributable to an acoustic source at the azimuth position of the primary contour, including phantom loci corresponding to other azimuth positions as a factor of frequency. The stencil pattern may be used to filter the data at different values of m.
- By employing the equation (32), the integration approximation of equation (30) is modified as reflected in the following equation (33):

where A(θ d ) denotes the number of points involved in the summation. Notably, equation (30) is a special case of equation (33) corresponding to γm,d =0. Thus, equation (33) is used in place of equation (30) when the second technique of integration over frequency is desired. - As shown in equation (2), both variables θ i and τi are equivalent and represent the position in the dual delay-line. The difference between these variables is that θ i indicates location along the dual delay-line by using its corresponding spatial azimuth, whereas τ i denotes location by using the corresponding time-delay unit of value τ i . Therefore, the stencil pattern becomes much simpler if the stencil filter function is expressed with τ i as defined in the following equation (34):

where, τ d relates to θ d through equation (4). For a specific τ d , the range of valid γ m,d is given by equation (35) as follows:
Changing value of τ d only shifts the coincidence pattern (or stencil pattern) along the τ i -axis without changing its shape. The approach characterized by equations (34) and (35) may be utilized as an alternative to separate patterns for each azimuth position of interest; however, because the scaling of the delay units τ i is uniform along the dual delay-line, azimuthal partitioning by the dual delay-line is not uniform, with the regions close to the median plane having higher azimuthal resolution. On the other hand, in order to obtain an equivalent resolution in azimuth, using a uniform τi would require a much larger I of delay units than using a uniform θ i. - The signal flow diagram of
Fig. 16 further illustrates selected details concerninglocalization operator 460. With equalization factors α i (m) set to unity, the delayed signal of pairs of delay stages 344 are sent tocoincidence detection operators 462 for each frequency indexed to m to determine the coincidence points.Detection operators 462 determine the minima in accordance with equation (22) or (26). Eachcoincidence detection operator 462 sends the results in (m) to acorresponding pattern generator 464 for the given m.Generators 464 build a 2-D coincidence plot for each frequency indexed to m and pass the results to acorresponding summation operator 466 to perform the operation expressed in equation (28) for that given frequency.Summation operators 466 approximate integration over time. InFig. 16 , onlyoperators -
Summation operators 466 pass results tosummation operator 468 to approximate integration over frequency.Operators 468 may be configured in accordance with equation (30) if artifacts resulting from the secondary relationships at high frequencies are not present or may be ignored. Alternatively, stencil filtering with predictive coincidence patterns that include the secondary relationships may be performed by applying equation (33) withsummation operator 468. - Referring back to
Fig. 15 ,operator 468 outputs HN(θd) tooutput device 490 to map corresponding acoustic source positional information.Device 490 preferably includes a display or printer capable of providing a map representative of the spatial arrangement of the acoustic sources relative to the predetermined azimuth positions. In addition, the acoustic sources may be localized and tracked dynamically as they move in space. Movement trajectories may be estimated from the sets of locations δ(i-in (m)) computed at each sample window n. For otherembodiments incorporating system 410 into a small portable unit, such as a hearing aid,output device 490 is preferably not included. In still other embodiments,output device 90 may not be included. - The localization techniques of
localization operator 460 are particularly suited to localize more than two acoustic sources of comparable sound pressure levels and frequency ranges, and need not specify an on-axis desired source. As such, the localization techniques ofsystem 410 provide independent capabilities to localize and map more than two acoustic sources relative to a number of positions as defined with respect tosensors localization operator 460 may also be utilized in conjunction with a designated reference source to perform extraction and noise suppression. Indeed,extraction operator 480 of the illustrated embodiment incorporates such features as more fully described hereinafter. - Existing systems based on a two sensor detection arrangement generally only attempt to suppress noise attributed to the most dominant interfering source through beamforming. Unfortunately, this approach is of limited value when there are a number of comparable interfering sources at proximal locations.
- It has been discovered that by suppressing one or more different frequency components in each of a plurality of interfering sources after localization, it is possible to reduce the interference from the noise sources in complex acoustic environments, such as in the case of multi-talkers, in spite of the temporal and frequency overlaps between talkers. Although a given frequency component or set of components may only be suppressed in one of the interfering sources for a given time frame, the dynamic allocation of suppression of each of the frequencies among the localized interfering acoustic sources generally results in better intelligibility of the desired signal than is possible by simply nulling only the most offensive source at all frequencies.
-
Extraction operator 480 provides one implementation of this approach by utilizing localization information fromlocalization operator 460 to identify Q interfering noise sources corresponding to positions other than i = s. The positions of the Q noise sources are represented by i=noisel, noise2,..., noiseQ. Notably,operator 480 receives the outputs ofsignal operator 350 as described in connection withsystem 310, that presents corresponding signals Xn (i= noise1) (m), Xn (i=noise2) (m), ..., Xn (i=noiseQ) (m) for each frequency m. These signals include a component of the desired signal at frequency m as well as components from sources other than the one to be canceled. For the purpose of extraction and suppression, the equalization factors α i (m) need not be set to unity once localization has taken place. To determine which frequency component or set of components to suppress in a particular noise source, the amplitudes of Xn (i=noisel) (m), X n (i=noise2) (m),..., Xn (i=noiseQ) (m) are calculated and compared. The minimum Xn (inoise) (m), is taken as output

where, Xn (inoise) (m) satisfies the condition expressed by equation (37) as follows:
operator 480 to prevent changing the input signal for that frequency at that moment. -
Processors Processors processors -
Systems Fig. 4A . In a further hearing aid embodiment,sensors application - In yet another embodiment,
system Fig. 4B . In still other embodiments,systems - It is contemplated that various signal flow operators, converters, functional blocks, generators, units, stages, processes, and techniques may be altered, rearranged, substituted, deleted, duplicated, combined or added as would occur to those skilled in the art without departing from the spirit of the present inventions. In one further embodiment, a signal processing system according to the present invention includes a first sensor configured to provide a first signal corresponding to an acoustic excitation; where this excitation includes a first acoustic signal from a first source and a second acoustic signal from a second source displaced from the first source. The system also includes a second sensor displaced from the first sensor that is configured to provide a second signal corresponding to the excitation. Further included is a processor responsive to the first and second sensor signals that has means for generating a desired signal with a spectrum representative of the first acoustic signal. This means includes a first delay line having a number of first taps to provide a number of delayed first signals and a second delay line having a number of second taps to provide a number of delayed second signals. The system also includes output means for generating a sensory output representative of the desired signal. In another embodiment, a method of signal processing includes detecting an acoustic excitation at both a first location to provide a corresponding first signal and at a second location to provide a corresponding second signal. The excitation is a composite of a desired acoustic signal from a first source and an interfering acoustic signal from a second source that is spaced apart from the first source. This method also includes spatially localizing the second source relative to the first source as a function of the first and second signals and generating a characteristic signal representative of the desired acoustic signal during performance of this localization.
- The following experimental results are provided as merely illustrative examples to enhance understanding of the present invention, and should not be construed to restrict or limit the scope of the present invention.
- A Sun Sparc-20 workstation was programmed to emulate the signal extraction process of the present invention. One loudspeaker (L1) was used to emit a speech signal and another loudspeaker (L2) was used to emit babble noise in a semi-anechoic room. Two microphones of a conventional type were positioned in the room and operatively coupled to the workstation. The microphones had an inter-microphone distance of about 15 centimeters and were positioned about 3 feet from L1. L1 was aligned with the midpoint between the microphones to define a zero degree azimuth. L2 was placed at different azimuths relative to L1 approximately equidistant to the midpoint between L1 and L2.
- Referring to
FIG. 5 , a clean speech of a sentence about two seconds long is depicted, emanating from L1 without interference from L2.FIG. 6 depicts a composite signal from L1 and L2. The composite signal includes babble noise from L2 combined with the speech signal depicted inFIG. 5 . The babble noise and speech signal are of generally equal intensity (0dB) with L2 placed at a 60 degree azimuth relative to L1.FIG. 7 depicts the signal recovered from the composite signal ofFIG. 6 . This signal is nearly the same as the signal ofFIG. 5 . -
FIG. 8 depicts another composite signal where the babble noise is 30dB more intense than the desired signal ofFIG. 5 . Furthermore, L2 is placed at only a 2 degree azimuth relative to L1.FIG. 9 depicts the signal recovered from the composite signal ofFIG. 8 , providing a clearly intelligible representation of the signal ofFIG. 5 despite the greater intensity of the babble noise from L2 and the nearby location. - Experiments corresponding to
system 410 were conducted with two groups having four talkers (2 male, 2 female) in each group. Five different tests were conducted for each group with different spatial configurations of the sources in each test. The four talkers were arranged in correspondence withsources Fig. 14 with different values forangles Fig. 14 most closely corresponds to the first test withangle 418a being -75 degrees,angle 412a being 0 degrees,angle 414a being +20 degrees, andangle 416a being +75 degrees. Thecoincident patterns Fig. 18 also correspond to the azimuth positions of -75 degrees, 0 degrees, +20 degrees, and +75 degrees. - The experimental set-up for the tests utilized two microphones for
sensors - Each of the five tests consisted of four subtests in which a different talker was taken as the desired source. To test the system performance under the most difficult experimental constraint, the speech materials (four equally-intense spondaic words) were intentionally aligned temporally. The speech material was presented in free-field. The localization of the talkers was done using both the equation (30) and equation (33) techniques.
- The system performance was evaluated using an objective intelligibility-weighted measure, as proposed in Peterson, P.M., "Adaptive array processing for multiple microphone hearing aids," Ph.D. Dissertation, Dept. Elect. Eng. and Comp. Sci., MIT; Res. Lab. Elect. Tech. Rept. 541, MIT, Cambridge, MA (1989). and described in detail in Liu, C. and Sideman, S., "Simulation of fixed microphone arrays for directional hearing aids," J. Acoust. Soc. Am. 100, 848-856 (1996). Specifically, intelligibility-weighted signal cancellation, intelligibility-weighted noise cancellation, and net intelligibility-weighted gain were used.
- The experimental results are presented in Tables I, II, III, and IV of
FIGs. 19-22 , respectively. The five tests described in Table I ofFIG. 19 approximate integration over frequency by utilizing equation (30); and includes two male speakers M1, M2 and two female speakers F1, F2. The five tests described in Table II ofFIG. 20 are the same as Table I, except that integration over frequency was approximated by equation (33). The five tests described in Table III ofFIG. 21 approximate integration over frequency by utilizing equation (30); and includes two different male speakers M3, M4 and two different female speakers F3, F4. The five tests described in Table IV ofFIG. 22 are the same as Table III. except that integration over frequency was approximated by equation (33). - For each test, the data was arranged in a matrix with the numbers on the diagonal line representing the degree of noise cancellation in dB of the desired source (ideally 0 dB) and the numbers elsewhere representing the degree of noise cancellation for each noise source. The next to the last column shows a degree of cancellation of all the noise sources lumped together, while the last column gives the net intelligibility-weighted improvement (which considers both noise cancellation and loss in the desired signal).
- The results generally show cancellation in the intelligibility-weighted measure in a range of about 3-11 dB, while degradation of the desired source was generally less than about 0.1 dB). The total noise cancellation was in the range of about 8-12 dB. Comparison of the various Tables suggests very little dependence on the talker or the speech materials used in the tests. Similar results were obtained from six-talker experiments. Generally, a 7-10 dB enhancement in the intelligibility-weighted signal-to-noise ratio resulted when there were six equally loud, temporally aligned speech sounds originating from six different loudspeakers.
- Further, any theory, mechanism of operation, proof, or finding stated herein is meant to further enhance understanding of the present invention and is not intended to make the present invention or the scope of the invention as defined by the following claims in any way dependent upon such theory, mechanism of operation, proof, or finding. While the invention has been illustrated and described in detail in the drawings and foregoing description, the same is to be considered as illustrative and not restrictive in character, it being understood that only selected embodiments have been shown and described and that all changes, modifications, and equivalents that fall within the scope of the invention defined by the following claims are desired to be protected.
Claims (14)
- A method, comprising:positioning a first acoustic sensor (22) and a second acoustic sensor (24) to detect a plurality of differently located acoustic sources (10, 12, 412, 416, 418);generating a first signal corresponding to said sources with said first sensor and a second signal corresponding to said sources with said second sensor;providing a number of delayed signal pairs from the first and second signals, the delayed signal pairs each corresponding to one of a number of positions relative to the first and second sensors; andlocalizing the sources as a function of the delayed signal pairs and a number of coincidence patterns (612, 614, 616, 618) generated by the delayed signal pairs, the patterns each corresponding to one of said number of positions and establishing an expected variation of acoustic source position information with frequency attributable to a source at the one of said number of positions, characterised in thatthe coincidence patterns (612, 614, 616, 618) each correspond to a number of relationships characterizing a variation of phantom acoustic source position (514a, 514b, 514c, 514d, 514e) with frequency, the relationships each correspond to a different ambiguous phase multiple.
- The method of claim 1, further comprising determining the relationships for each of the coincidence patterns (612, 614, 616, 618) as a function of distance separating the first and second sensors (22, 24).
- The method of claim 1, wherein the relationships each correspond to a secondary contour that curves in relation to a primary contour, the primary contour representing frequency invariant acoustic source position information determined from the delayed signal pair corresponding to one of the positions.
- The method of any of claims 1-3, wherein said localizing includes filtering with the coincidence patterns (612, 614, 616, 618) to enhance true position information with phantom position information.
- The method of claim 4, wherein said localizing includes integrating over time and integrating over frequency.
- The method of any of claims 1-3, wherein the first sensor (22) and second sensor (24) are part of a hearing aid device (110) and further comprising adjusting the delayed signal pairs with a head-related-transfer function.
- The method of any of claims 1-3, further comprising:extracting a desired signal after said localizing; andsuppressing a different set of frequency components for each of a selected number of the sources to reduce noise.
- The method of any of claims 1-3, wherein the positions each correspond to an azimuth established relative to the first and second sensors (22, 24) and further comprising generating a map showing relative location of each of the sources (10, 12, 412,414,416,418).
- A system, comprising:a pair of spaced apart acoustic sensors (22, 24) each configured to generate a corresponding one of a pair of input signals, the signals being representative of a number of differently located acoustic sources (10, 12, 412, 414, 416, 418);a delay operator (340) responsive to said input signals to generate a number of delayed signals each corresponding to one of a number of positions relative to said sensors;a number of coincidence patterns (612, 614, 616, 618) generated by said delayed signal pairs, wherein each pattern corresponds to one of said number of positions;a localization operator (360, 460) responsive to said delayed signals to determine a number of sound source localization signals from said delayed signals and said number of coincidence patterns (612, 614, 616, 618); andan output device (90, 190, 490) responsive to said localization signals to provide an output corresponding to at least one of said sources, characterised in thatsaid patterns which each correspond to one of said positions, relate frequency varying sound source position information caused by ambiguous phase multiples to said one of said positions to improve sound source localization.
- The system of claim 9, further comprising:an analog -to-digital converter (36a, 36b) responsive to said input signals to convert each of said input signals from an analog form to a digital form; anda first transformation stage (36a,36b) responsive to said digital form of said input signals to transform said input signals from a time domain form to a frequency domain form in terms of a plurality of discrete frequencies, said delay operator including a dual delay line for each of the frequencies.
- The system of claim 10, further comprising;
an extraction operator (380, 480) responsive to said localization signals to extract a desired signal;
a second transformation stage (82) responsive to said desired signal to transform said desired signal from a digital frequency domain form to a digital time form; and
a digital to analog converter (84) responsive to said digital time domain form to convert said desired signal to an analog output form for said output device. - The system of any of claims 9-11, wherein said output device (90, 190, 490) is configured to provide a map of acoustic source locations.
- The system of any of claims 9-11, wherein said delay operator (340) and said localization operator (360, 460) are defined by an integrated solid state signal processor.
- The system of any of claims 9-11, wherein said localization operator (360, 460) responds to said delay signals to determine a closest one of said positions for one of said sources (10, 12, 412, 414, 416, 418) as a function of at least one of said delayed signals corresponding to said closest one of said positions and at least two other of said delayed signals corresponding to other of said positions, said at least two other of said delayed signals being determined with a corresponding one of said coincidence patterns (612, 614, 616, 618).
Applications Claiming Priority (3)
| Application Number | Priority Date | Filing Date | Title |
|---|---|---|---|
| US09/193,058 US6987856B1 (en) | 1996-06-19 | 1998-11-16 | Binaural signal processing techniques |
| US193058 | 1998-11-16 | ||
| PCT/US1999/026965 WO2000030404A1 (en) | 1998-11-16 | 1999-11-16 | Binaural signal processing techniques |
Publications (3)
| Publication Number | Publication Date |
|---|---|
| EP1133899A1 EP1133899A1 (en) | 2001-09-19 |
| EP1133899A4 EP1133899A4 (en) | 2003-09-03 |
| EP1133899B1 true EP1133899B1 (en) | 2008-08-06 |
Family
ID=22712122
Family Applications (1)
| Application Number | Title | Priority Date | Filing Date |
|---|---|---|---|
| EP99958975A Expired - Lifetime EP1133899B1 (en) | 1998-11-16 | 1999-11-16 | Binaural signal processing techniques |
Country Status (9)
| Country | Link |
|---|---|
| EP (1) | EP1133899B1 (en) |
| JP (1) | JP3745227B2 (en) |
| CN (1) | CN1333994A (en) |
| AT (1) | ATE404028T1 (en) |
| AU (1) | AU748113B2 (en) |
| CA (1) | CA2348894C (en) |
| DE (1) | DE69939272D1 (en) |
| DK (1) | DK1133899T3 (en) |
| WO (1) | WO2000030404A1 (en) |
Cited By (1)
| Publication number | Priority date | Publication date | Assignee | Title |
|---|---|---|---|---|
| US9049531B2 (en) | 2009-11-12 | 2015-06-02 | Institut Fur Rundfunktechnik Gmbh | Method for dubbing microphone signals of a sound recording having a plurality of microphones |
Families Citing this family (27)
| Publication number | Priority date | Publication date | Assignee | Title |
|---|---|---|---|---|
| US6978159B2 (en) | 1996-06-19 | 2005-12-20 | Board Of Trustees Of The University Of Illinois | Binaural signal processing using multiple acoustic sensors and digital filtering |
| US7206423B1 (en) | 2000-05-10 | 2007-04-17 | Board Of Trustees Of University Of Illinois | Intrabody communication for a hearing aid |
| CN1440628A (en) | 2000-05-10 | 2003-09-03 | 伊利诺伊大学评议会 | Interference Suppression Technology |
| ITMI20020566A1 (en) * | 2002-03-18 | 2003-09-18 | Daniele Ramenzoni | DEVICE TO CAPTURE EVEN SMALL MOVEMENTS IN THE AIR AND IN FLUIDS SUITABLE FOR CYBERNETIC AND LABORATORY APPLICATIONS AS TRANSDUCER |
| US7512448B2 (en) | 2003-01-10 | 2009-03-31 | Phonak Ag | Electrode placement for wireless intrabody communication between components of a hearing system |
| US7076072B2 (en) | 2003-04-09 | 2006-07-11 | Board Of Trustees For The University Of Illinois | Systems and methods for interference-suppression with directional sensing patterns |
| US7433821B2 (en) * | 2003-12-18 | 2008-10-07 | Honeywell International, Inc. | Methods and systems for intelligibility measurement of audio announcement systems |
| JP4580210B2 (en) | 2004-10-19 | 2010-11-10 | ソニー株式会社 | Audio signal processing apparatus and audio signal processing method |
| US8184827B2 (en) * | 2006-11-09 | 2012-05-22 | Panasonic Corporation | Sound source position detector |
| JP4854533B2 (en) * | 2007-01-30 | 2012-01-18 | 富士通株式会社 | Acoustic judgment method, acoustic judgment device, and computer program |
| WO2009135532A1 (en) * | 2008-05-09 | 2009-11-12 | Nokia Corporation | An apparatus |
| US20100074460A1 (en) * | 2008-09-25 | 2010-03-25 | Lucent Technologies Inc. | Self-steering directional hearing aid and method of operation thereof |
| JP5617133B2 (en) * | 2008-11-05 | 2014-11-05 | ヒア アイピー ピーティーワイ リミテッド | Directional output signal generation system and method |
| US20110096941A1 (en) * | 2009-10-28 | 2011-04-28 | Alcatel-Lucent Usa, Incorporated | Self-steering directional loudspeakers and a method of operation thereof |
| CN102111697B (en) * | 2009-12-28 | 2015-03-25 | 歌尔声学股份有限公司 | Method and device for controlling noise reduction of microphone array |
| CN102771144B (en) * | 2010-02-19 | 2015-03-25 | 西门子医疗器械公司 | Apparatus and method for direction dependent spatial noise reduction |
| EP2709101B1 (en) * | 2012-09-13 | 2015-03-18 | Nxp B.V. | Digital audio processing system and method |
| JP6107151B2 (en) | 2013-01-15 | 2017-04-05 | 富士通株式会社 | Noise suppression apparatus, method, and program |
| CN105307095B (en) * | 2015-09-15 | 2019-09-10 | 中国电子科技集团公司第四十一研究所 | A kind of high definition audio frequency measurement method based on FFT |
| CN108727363B (en) * | 2017-04-19 | 2020-06-19 | 劲方医药科技(上海)有限公司 | A novel cyclin-dependent kinase CDK9 inhibitor |
| CN109493877B (en) * | 2017-09-12 | 2022-01-28 | 清华大学 | Voice enhancement method and device of hearing aid device |
| EP3721429A2 (en) * | 2017-12-07 | 2020-10-14 | HED Technologies Sarl | Voice aware audio system and method |
| DE102018206722A1 (en) * | 2018-05-02 | 2019-11-07 | Robert Bosch Gmbh | Method and device for operating ultrasonic sensors of a vehicle |
| CN111435598B (en) | 2019-01-15 | 2023-08-18 | 北京地平线机器人技术研发有限公司 | Voice signal processing method, device, computer readable medium and electronic equipment |
| CN112190259B (en) * | 2020-09-10 | 2024-06-28 | 北京济声科技有限公司 | Method for testing sound source positioning capability, tester terminal and subject terminal |
| CN114624652B (en) * | 2022-03-16 | 2022-09-30 | 浙江浙能技术研究院有限公司 | Sound source positioning method under strong multipath interference condition |
| CN117031397B (en) * | 2023-10-07 | 2023-12-12 | 成都流体动力创新中心 | Quick calculation method for positioning and evaluating noise source of moving object |
Family Cites Families (6)
| Publication number | Priority date | Publication date | Assignee | Title |
|---|---|---|---|---|
| JPS6223300A (en) * | 1985-07-23 | 1987-01-31 | Victor Co Of Japan Ltd | Directional microphone equipment |
| US5029216A (en) * | 1989-06-09 | 1991-07-02 | The United States Of America As Represented By The Administrator Of The National Aeronautics & Space Administration | Visual aid for the hearing impaired |
| US5400409A (en) * | 1992-12-23 | 1995-03-21 | Daimler-Benz Ag | Noise-reduction method for noise-affected voice channels |
| US5473701A (en) * | 1993-11-05 | 1995-12-05 | At&T Corp. | Adaptive microphone array |
| US6130949A (en) * | 1996-09-18 | 2000-10-10 | Nippon Telegraph And Telephone Corporation | Method and apparatus for separation of source, program recorded medium therefor, method and apparatus for detection of sound source zone, and program recorded medium therefor |
| CA2286982A1 (en) * | 1997-04-14 | 1998-10-22 | Lamar Signal Processing Ltd. | Dual-processing interference cancelling system and method |
-
1999
- 1999-11-16 JP JP2000583297A patent/JP3745227B2/en not_active Expired - Fee Related
- 1999-11-16 WO PCT/US1999/026965 patent/WO2000030404A1/en not_active Ceased
- 1999-11-16 EP EP99958975A patent/EP1133899B1/en not_active Expired - Lifetime
- 1999-11-16 DE DE69939272T patent/DE69939272D1/en not_active Expired - Lifetime
- 1999-11-16 CA CA002348894A patent/CA2348894C/en not_active Expired - Fee Related
- 1999-11-16 AT AT99958975T patent/ATE404028T1/en not_active IP Right Cessation
- 1999-11-16 AU AU16240/00A patent/AU748113B2/en not_active Ceased
- 1999-11-16 CN CN99815559.4A patent/CN1333994A/en active Pending
- 1999-11-16 DK DK99958975T patent/DK1133899T3/en active
Cited By (1)
| Publication number | Priority date | Publication date | Assignee | Title |
|---|---|---|---|---|
| US9049531B2 (en) | 2009-11-12 | 2015-06-02 | Institut Fur Rundfunktechnik Gmbh | Method for dubbing microphone signals of a sound recording having a plurality of microphones |
Also Published As
| Publication number | Publication date |
|---|---|
| EP1133899A4 (en) | 2003-09-03 |
| CA2348894A1 (en) | 2000-05-22 |
| JP3745227B2 (en) | 2006-02-15 |
| AU1624000A (en) | 2000-06-05 |
| JP2002530966A (en) | 2002-09-17 |
| CN1333994A (en) | 2002-01-30 |
| AU748113B2 (en) | 2002-05-30 |
| DK1133899T3 (en) | 2009-01-12 |
| WO2000030404A1 (en) | 2000-05-25 |
| CA2348894C (en) | 2007-09-25 |
| EP1133899A1 (en) | 2001-09-19 |
| DE69939272D1 (en) | 2008-09-18 |
| ATE404028T1 (en) | 2008-08-15 |
Similar Documents
| Publication | Publication Date | Title |
|---|---|---|
| US6978159B2 (en) | Binaural signal processing using multiple acoustic sensors and digital filtering | |
| US6987856B1 (en) | Binaural signal processing techniques | |
| AU748113B2 (en) | Binaural signal processing techniques | |
| US6222927B1 (en) | Binaural signal processing system and method | |
| EP2537353B1 (en) | Device and method for direction dependent spatial noise reduction | |
| US7076072B2 (en) | Systems and methods for interference-suppression with directional sensing patterns | |
| Liu et al. | Localization of multiple sound sources with two microphones | |
| CA2407855C (en) | Interference suppression techniques | |
| EP1329134B1 (en) | Intrabody communication for a hearing aid | |
| JP3521914B2 (en) | Super directional microphone array | |
| Lotter et al. | Dual-channel speech enhancement by superdirective beamforming | |
| EP2716069B1 (en) | A method of processing a signal in a hearing instrument, and hearing instrument | |
| CN102204281A (en) | A system and method for producing a directional output signal | |
| Marquardt et al. | Interaural coherence preservation for binaural noise reduction using partial noise estimation and spectral postfiltering | |
| Talagala et al. | Binaural sound source localization using the frequency diversity of the head-related transfer function | |
| EP1691576A2 (en) | Method to adjust a hearing system, method to operate the hearing system and a hearing system | |
| Barfuss et al. | HRTF-based robust least-squares frequency-invariant beamforming | |
| Maj et al. | SVD-based optimal filtering for noise reduction in dual microphone hearing aids: a real time implementation and perceptual evaluation | |
| Moore et al. | Improving robustness of adaptive beamforming for hearing devices | |
| EP3148217B1 (en) | Method for operating a binaural hearing system | |
| Shimoyama et al. | Multiple acoustic source localization using ambiguous phase differences under reverberative conditions | |
| Park et al. | An auditory process model for sound localization | |
| Song et al. | An Environment-Adaptation Based Binaural | |
| CHAU | A DOA Estimation Algorithm based on Equalization | |
| Boone et al. | Downstream speech enhancement in a low directivity binaural hearing aid |
Legal Events
| Date | Code | Title | Description |
|---|---|---|---|
| PUAI | Public reference made under article 153(3) epc to a published international application that has entered the european phase |
Free format text: ORIGINAL CODE: 0009012 |
|
| 17P | Request for examination filed |
Effective date: 20010529 |
|
| AK | Designated contracting states |
Kind code of ref document: A1 Designated state(s): AT BE CH CY DE DK ES FI FR GB GR IE IT LI LU MC NL PT SE |
|
| AX | Request for extension of the european patent |
Free format text: AL;LT;LV;MK;RO;SI |
|
| A4 | Supplementary search report drawn up and despatched |
Effective date: 20030721 |
|
| RIC1 | Information provided on ipc code assigned before grant |
Ipc: 7H 04R 3/00 B Ipc: 7H 04B 15/00 B Ipc: 7H 03B 29/00 B Ipc: 7A 61F 11/06 B Ipc: 7H 04R 1/10 B Ipc: 7H 04R 25/00 A |
|
| 17Q | First examination report despatched |
Effective date: 20040903 |
|
| 17Q | First examination report despatched |
Effective date: 20040903 |
|
| GRAP | Despatch of communication of intention to grant a patent |
Free format text: ORIGINAL CODE: EPIDOSNIGR1 |
|
| GRAS | Grant fee paid |
Free format text: ORIGINAL CODE: EPIDOSNIGR3 |
|
| GRAA | (expected) grant |
Free format text: ORIGINAL CODE: 0009210 |
|
| AK | Designated contracting states |
Kind code of ref document: B1 Designated state(s): AT BE CH CY DE DK ES FI FR GB GR IE IT LI LU MC NL PT SE |
|
| REG | Reference to a national code |
Ref country code: GB Ref legal event code: FG4D |
|
| REG | Reference to a national code |
Ref country code: CH Ref legal event code: EP |
|
| REG | Reference to a national code |
Ref country code: IE Ref legal event code: FG4D |
|
| REF | Corresponds to: |
Ref document number: 69939272 Country of ref document: DE Date of ref document: 20080918 Kind code of ref document: P |
|
| REG | Reference to a national code |
Ref country code: CH Ref legal event code: NV Representative=s name: SERVOPATENT GMBH |
|
| REG | Reference to a national code |
Ref country code: DK Ref legal event code: T3 |
|
| PG25 | Lapsed in a contracting state [announced via postgrant information from national office to epo] |
Ref country code: NL Free format text: LAPSE BECAUSE OF FAILURE TO SUBMIT A TRANSLATION OF THE DESCRIPTION OR TO PAY THE FEE WITHIN THE PRESCRIBED TIME-LIMIT Effective date: 20080806 Ref country code: ES Free format text: LAPSE BECAUSE OF FAILURE TO SUBMIT A TRANSLATION OF THE DESCRIPTION OR TO PAY THE FEE WITHIN THE PRESCRIBED TIME-LIMIT Effective date: 20081117 |
|
| PGFP | Annual fee paid to national office [announced via postgrant information from national office to epo] |
Ref country code: DK Payment date: 20081212 Year of fee payment: 10 Ref country code: CH Payment date: 20081216 Year of fee payment: 10 |
|
| PG25 | Lapsed in a contracting state [announced via postgrant information from national office to epo] |
Ref country code: FI Free format text: LAPSE BECAUSE OF FAILURE TO SUBMIT A TRANSLATION OF THE DESCRIPTION OR TO PAY THE FEE WITHIN THE PRESCRIBED TIME-LIMIT Effective date: 20080806 Ref country code: AT Free format text: LAPSE BECAUSE OF FAILURE TO SUBMIT A TRANSLATION OF THE DESCRIPTION OR TO PAY THE FEE WITHIN THE PRESCRIBED TIME-LIMIT Effective date: 20080806 |
|
| PG25 | Lapsed in a contracting state [announced via postgrant information from national office to epo] |
Ref country code: BE Free format text: LAPSE BECAUSE OF FAILURE TO SUBMIT A TRANSLATION OF THE DESCRIPTION OR TO PAY THE FEE WITHIN THE PRESCRIBED TIME-LIMIT Effective date: 20080806 |
|
| PG25 | Lapsed in a contracting state [announced via postgrant information from national office to epo] |
Ref country code: PT Free format text: LAPSE BECAUSE OF FAILURE TO SUBMIT A TRANSLATION OF THE DESCRIPTION OR TO PAY THE FEE WITHIN THE PRESCRIBED TIME-LIMIT Effective date: 20090106 |
|
| PLBE | No opposition filed within time limit |
Free format text: ORIGINAL CODE: 0009261 |
|
| STAA | Information on the status of an ep patent application or granted ep patent |
Free format text: STATUS: NO OPPOSITION FILED WITHIN TIME LIMIT |
|
| PG25 | Lapsed in a contracting state [announced via postgrant information from national office to epo] |
Ref country code: MC Free format text: LAPSE BECAUSE OF NON-PAYMENT OF DUE FEES Effective date: 20081130 |
|
| PGFP | Annual fee paid to national office [announced via postgrant information from national office to epo] |
Ref country code: GB Payment date: 20081210 Year of fee payment: 10 |
|
| 26N | No opposition filed |
Effective date: 20090507 |
|
| REG | Reference to a national code |
Ref country code: IE Ref legal event code: MM4A |
|
| PG25 | Lapsed in a contracting state [announced via postgrant information from national office to epo] |
Ref country code: IT Free format text: LAPSE BECAUSE OF FAILURE TO SUBMIT A TRANSLATION OF THE DESCRIPTION OR TO PAY THE FEE WITHIN THE PRESCRIBED TIME-LIMIT Effective date: 20080806 |
|
| REG | Reference to a national code |
Ref country code: FR Ref legal event code: ST Effective date: 20090731 |
|
| PG25 | Lapsed in a contracting state [announced via postgrant information from national office to epo] |
Ref country code: IE Free format text: LAPSE BECAUSE OF NON-PAYMENT OF DUE FEES Effective date: 20081116 |
|
| PG25 | Lapsed in a contracting state [announced via postgrant information from national office to epo] |
Ref country code: SE Free format text: LAPSE BECAUSE OF FAILURE TO SUBMIT A TRANSLATION OF THE DESCRIPTION OR TO PAY THE FEE WITHIN THE PRESCRIBED TIME-LIMIT Effective date: 20081106 |
|
| PG25 | Lapsed in a contracting state [announced via postgrant information from national office to epo] |
Ref country code: LU Free format text: LAPSE BECAUSE OF NON-PAYMENT OF DUE FEES Effective date: 20081116 |
|
| REG | Reference to a national code |
Ref country code: CH Ref legal event code: PL |
|
| REG | Reference to a national code |
Ref country code: DK Ref legal event code: EBP |
|
| GBPC | Gb: european patent ceased through non-payment of renewal fee |
Effective date: 20091116 |
|
| PG25 | Lapsed in a contracting state [announced via postgrant information from national office to epo] |
Ref country code: CY Free format text: LAPSE BECAUSE OF FAILURE TO SUBMIT A TRANSLATION OF THE DESCRIPTION OR TO PAY THE FEE WITHIN THE PRESCRIBED TIME-LIMIT Effective date: 20080806 |
|
| PG25 | Lapsed in a contracting state [announced via postgrant information from national office to epo] |
Ref country code: LI Free format text: LAPSE BECAUSE OF NON-PAYMENT OF DUE FEES Effective date: 20091130 Ref country code: GR Free format text: LAPSE BECAUSE OF FAILURE TO SUBMIT A TRANSLATION OF THE DESCRIPTION OR TO PAY THE FEE WITHIN THE PRESCRIBED TIME-LIMIT Effective date: 20081107 Ref country code: CH Free format text: LAPSE BECAUSE OF NON-PAYMENT OF DUE FEES Effective date: 20091130 |
|
| PG25 | Lapsed in a contracting state [announced via postgrant information from national office to epo] |
Ref country code: GB Free format text: LAPSE BECAUSE OF NON-PAYMENT OF DUE FEES Effective date: 20091116 |
|
| PG25 | Lapsed in a contracting state [announced via postgrant information from national office to epo] |
Ref country code: DK Free format text: LAPSE BECAUSE OF NON-PAYMENT OF DUE FEES Effective date: 20091130 |
|
| PGFP | Annual fee paid to national office [announced via postgrant information from national office to epo] |
Ref country code: DE Payment date: 20101110 Year of fee payment: 12 |
|
| PG25 | Lapsed in a contracting state [announced via postgrant information from national office to epo] |
Ref country code: FR Free format text: LAPSE BECAUSE OF NON-PAYMENT OF DUE FEES Effective date: 20081130 |
|
| REG | Reference to a national code |
Ref country code: DE Ref legal event code: R119 Ref document number: 69939272 Country of ref document: DE Effective date: 20120601 |
|
| PG25 | Lapsed in a contracting state [announced via postgrant information from national office to epo] |
Ref country code: DE Free format text: LAPSE BECAUSE OF NON-PAYMENT OF DUE FEES Effective date: 20120601 |