EP1128293A2 - Modelling non-linear devices - Google Patents
Modelling non-linear devices Download PDFInfo
- Publication number
- EP1128293A2 EP1128293A2 EP01301681A EP01301681A EP1128293A2 EP 1128293 A2 EP1128293 A2 EP 1128293A2 EP 01301681 A EP01301681 A EP 01301681A EP 01301681 A EP01301681 A EP 01301681A EP 1128293 A2 EP1128293 A2 EP 1128293A2
- Authority
- EP
- European Patent Office
- Prior art keywords
- function
- input
- input signal
- output
- data
- Prior art date
- Legal status (The legal status is an assumption and is not a legal conclusion. Google has not performed a legal analysis and makes no representation as to the accuracy of the status listed.)
- Withdrawn
Links
Images


Classifications
-
- G—PHYSICS
- G06—COMPUTING OR CALCULATING; COUNTING
- G06F—ELECTRIC DIGITAL DATA PROCESSING
- G06F30/00—Computer-aided design [CAD]
- G06F30/30—Circuit design
- G06F30/36—Circuit design at the analogue level
- G06F30/367—Design verification, e.g. using simulation, simulation program with integrated circuit emphasis [SPICE], direct methods or relaxation methods
-
- G—PHYSICS
- G01—MEASURING; TESTING
- G01R—MEASURING ELECTRIC VARIABLES; MEASURING MAGNETIC VARIABLES
- G01R31/00—Arrangements for testing electric properties; Arrangements for locating electric faults; Arrangements for electrical testing characterised by what is being tested not provided for elsewhere
- G01R31/28—Testing of electronic circuits, e.g. by signal tracer
- G01R31/2832—Specific tests of electronic circuits not provided for elsewhere
- G01R31/2836—Fault-finding or characterising
- G01R31/2837—Characterising or performance testing, e.g. of frequency response
-
- G—PHYSICS
- G06—COMPUTING OR CALCULATING; COUNTING
- G06F—ELECTRIC DIGITAL DATA PROCESSING
- G06F2218/00—Aspects of pattern recognition specially adapted for signal processing
Definitions
- the present invention relates to the determination of behavioral models for nonlinear devices, circuits, subsystems or systems.
- the present invention is a method for creating excitation signals and a method for performing function fitting in the determination of behavioral models for nonlinear devices, circuits, subsystems, and systems from embeddings of time-domain measurements. More particularly it relates to excitation signal and radial basis function methods for use in extraction of nonlinear black-box behavioral models.
- LTI devices Linear, time invariant (LTI) devices, circuits, subsystems, and systems are completely characterized by their transfer functions. To understand the performance of an LTI device, one need only determine the transfer function of the LTI device. Once the transfer function is known, the operation of the device in a system is known completely for all input conditions. The same is true for LTI circuits, subsystems and systems.
- a transfer function is a complex frequency domain-function that describes the output of an LTI device in terms of its inputs and therefore, forms a complete description of the LTI device.
- the term complex function when used herein refers to a function that includes complex numbers having a real and an imaginary part.
- An equivalent form of the transfer function of an LTI device in the time-domain is called an impulse response of the LTI device.
- a one-to-one relationship exists between the transfer function in the frequency-domain and impulse response in the time-domain.
- the transfer function and the impulse response are not functions of and do not depend on the input signal that is applied to the LTI device.
- the determination of the transfer function is known as model development or model parameter extraction.
- model development or model parameter extraction Once a model of an LTI device is developed, or equivalently the transfer function is known, for a given device, the actual device may be replaced by a virtual device based on the model in any simulation of a system using the device. Often the development of the model involves extraction or determination of model parameters from a set of test data that represents the device of interest.
- Transfer functions of LTI devices, circuits, subsystems, or systems can be extracted from measurements made with a vector spectrum or vector network analyzer.
- a swept or stepped frequency input signal is generated and the vector spectrum analyzer or network analyzer records the output of the LTI device. Then, a transfer function can be computed by comparing the input and output signals.
- models suitable for simulation of a given LTI device or circuit can extracted from transfer functions using, among other things, linear system identification techniques.
- Time-domain measurements provide an alternate method of characterizing LTI devices or circuits. Pulse inputs that approximate an impulse are applied to a device and the outputs are measured and recorded. In one such well known, time-domain method, the poles and zeros of the Laplace transform of the governing differential equation of the device are estimated from the recorded output data. Once a suitable governing differential equation is determined, the device transfer function is calculated. In an alternative method, the measured data associated with the impulse response is transformed using a Fast Fourier Transform (FFT) to the frequency-domain where a linear system identification method is then used to extract the transfer function.
- FFT Fast Fourier Transform
- nonlinear device when used herein will be understood to include devices, circuits, subsystems or systems with a nonlinear input-output relationship. Unlike the linear case, the nonlinear device or circuit is not readily represented by a transfer function or impulse response, at least not one that is independent of the input signal or stimulus. However, there is still a need to model nonlinear devices so that their performance in systems can be evaluated efficiently. This is especially true when it is impractical or too expensive to use the actual device, such as when the device is still being designed.
- a behavioral model herein refers to a set of parameters that define the input-output behavior of a device or circuit.
- a behavioral model must be of a form suitable for rapid simulation.
- Simulated measurements refers to values of voltage, current or other physical variables obtained from device, circuit or system simulation software. The objective of building a behavioral model from actual or simulated measurements is to reduce simulation time by replacing a complex circuit description in the simulation with a simpler, easier to simulate, behavioral model.
- nonlinear devices are electronic in nature (e.g. transistors, diodes).
- the measurements used to produce a model of the device are typically measured voltages and currents in and out of the ports of the device or equivalently incident or reflected power waves present at the ports at various frequencies.
- the models extracted from the measurements generally need to reflect the dynamic relationships between the voltages and currents at the ports.
- the model can be used, for example, to compute the currents into the ports from recent values of the voltages across the ports. Often this is the essential computation that must be provided to electronic circuit simulators by a software module that represents a device.
- a vehicular system comprising driver inputs and vehicle response may be represented in terms of a nonlinear behavioral model.
- the input measurements might be of variables such as steering wheel position, brake pressure, throttle position, gear selection and the response measurements might be of variables such as the vehicle speed, lateral and longitudinal acceleration, and yaw rate.
- the behavioral model extracted from the measurements needs to reflect the dynamic relationship between the driver inputs that are applied and the subsequent response of the vehicle. In other words, the model defines a "virtual car” that can be "driven” using previously recorded or real-time measured driver inputs.
- VIOMAPs Volterra input-output maps method
- Volterra Series Method Volterra Series Method
- VIOMAPs are models of nonlinear devices or circuits that can be extracted from frequency domain measurements such as those produced by using a vector spectrum analyzer.
- the usefulness of such models is limited by the assumption of weak nonlinearity.
- VIOMAPs and related methods can only model the steady state behavioral or response of the device.
- a steady-state response is the response of a device, linear or nonlinear, to a repeating input signal.
- An example of a steady-state response is the response to a sine wave input after sufficient time has passed to allow the transients associated with the application of the sine wave to decay.
- VIOMAPs and the related methods are powerful methods that have found many useful applications.
- VIOMAPs as noted above, cannot handle strong nonlinearities or transient inputs.
- VIOMAPs are restricted to modeling the steady state behavior of devices that exhibit weak nonlinearities.
- Another, somewhat different, method of characterizing nonlinear devices is to use an equivalent circuit representation of the device of interest.
- the approach in this method is to assume an equivalent circuit topology with a certain circuit parameter left free or unspecified that is expected to adequately represent the device or circuit.
- equivalent circuits are known that adequately represent certain classes of transistors (e.g. MOSFETs or BJTs).
- a set of measurements is performed on the device from which the correct values of the free parameters can be computed or deduced for a particular device.
- this approach for nonlinear device characterization has a number of serious disadvantages.
- Chief among the disadvantages is the need for a priori knowledge of an equivalent circuit that adequately represents the device of interest. This often means that significant knowledge of the device is required before modeling can begin. If incorrect assumptions are made regarding the structure of the equivalent circuit, the method may not yield satisfactory results. Put another way, the approximation that is being made by choosing a particular equivalent circuit over another has an impact on accuracy that is hard to determine.
- this method is only useful when the device being modeled is of a type similar to electronic circuitry (e.g. a hydraulic device or spring-mass-dashpot system) that a representative equivalent circuit can be created.
- the equivalent circuit can require a significant amount of computer time to simulate, thereby often making this method unacceptably costly for use in the simulation of large systems.
- the present invention is based on the method for producing behavioral models of nonlinear devices that is described in co-pending application serial no. 09/420,607, filed October 18, 1999.
- the methods of the present invention are a method for producing behavioral models of nonlinear devices utilizing a robust excitation signal, a method for producing behavioral models of nonlinear devices utilizing a novel radial basis function, a method for constructing the robust excitation signal, and a method of determining a novel radial basis function.
- the behavioral models resulting from the methods of the present invention accommodate nonlinear devices with one or more input ports and one or more output ports.
- the methods of producing a behavioral model of a nonlinear device from embeddings of time-domain measurements of the present invention comprise the steps of applying an input signal to the nonlinear device, or equivalently to a virtual device, sampling the input signal to produce input data, measuring a response to the input signal at the output of the device to produce output data corresponding to the input data, creating an embedded data set using a first subset of the input data and a first subset of the output data, fitting a function to the embedded data set, and verifying the fitted function using a second subset of the input data and a second subset of the output data, wherein the verified fitted function is the behavioral model of the nonlinear device.
- the fitted function can be used to compute a continuous-time model from the discrete behavioral model developed in the aforementioned steps.
- the method producing a behavioral model of the present invention utilizes a code division multiple access signal (CDMA) as the input signal in the step of applying.
- CDMA code division multiple access signal
- the method of producing a behavioral model of the present invention utilizes a novel radial basis function in the step of fitting a function to the embedded data set.
- the method of producing a behavioral model utilizes both the CDMA type signal as an input signal in the step of applying and the novel radial basis function in the step of fitting.
- the methods of the present invention are not restricted to modeling weakly nonlinear devices but can handle hard or strong nonlinearities.
- the methods accommodate steady-state as well as dynamic nonlinearities, requires no a priori assumptions regarding the device model structure and can handle devices with multiple, dependent inputs.
- the methods operate in the discrete time-domain with sampled measurements of input and output variables but are readily extended to a continuous representation of the device behavioral model.
- the behavioral models produced by these methods are general in nature and are readily implementable representations of nonlinear devices including those exhibiting strong nonlinearities.
- the behavioral model created from the methods of the present invention can be used to simulate the output of the device, given input signals in the frequency-domain.
- the excitation signals utilized can be generated at reasonable cost at any frequency up to and beyond microwave frequencies.
- a method of constructing an input or excitation signal for use in producing a behavioral model is also provided.
- the method of construction of the invention constructs a CDMA type excitation signal.
- the excitation signal so constructed is applied to a nonlinear device for behavioral model extraction from embedded time-series measurements according to the invention.
- the CDMA type signal is a single signal as opposed to multiple signals typical of the excitation signal constructed according to the co-pending method.
- the single CDMA type signal of the present invention provides excellent phase space coverage. Therefore, use of the CDMA type signal in the methods of the present invention yields models with excellent agreement between the behavioral model produced thereby and the actual nonlinear device.
- a method of determining a radial basis function for use in determining a behavioral model comprises a novel modified gaussian function.
- the novel radial basis function of the present invention provides excellent agreement between the behavioral model and the nonlinear device being modeled.
- the radial basis function is stable owing to the inherent partitioning of the modified gaussian function into two parts, one part associated with output data from the model and the other part associated with input data from the excitation signal.
- the CDMA type excitation signal and the radial basis function of the present invention can be used together in the method of producing a behavioral model of the present invention.
- Figure 1 illustrates a block diagram of the method of producing a behavioral model of the present invention utilizing a CDMA type excitation signal.
- Figure 2 illustrates a block diagram of the method of producing a behavioral model of the present invention utilizing a radial basis function.
- Figure 3 illustrates a block diagram of the method of constructing an excitation signal in accordance with the invention.
- Figure 4 illustrates a block diagram of the method of determining a radial basis functions in accordance with the invention.
- the methods of the present invention utilize time-domain measurements of a nonlinear device to produce or extract a black box behavioral model of the device from embeddings of these measurements.
- the methods of the present invention are applicable to modeling devices where information about the device is provided by either actual measurements or simulated measurements.
- nonlinear time series analysis The use of embeddings to extract models from time domain measurements of nonlinear devices is called nonlinear time series analysis (NLTSA).
- black box refers to a model that requires little or no detailed information, such as the topology of an equivalent circuit, or knowledge of the underlying physics, of the device be known before the model is constructed.
- embeddding refers to a function or mapping from a set U to a new set W , where U ⁇ W
- the methods of the present invention are based on the method described in co-pending application serial no. 09/420,607, filed October 18, 1999.
- the method of the present invention differs from the method of the co-pending application in that an input signal of the present invention is a specific type of CDMA signal having advantages in some instances to the input signals of the co-pending application.
- the method of the present invention differs from the method of the co-pending application in that the method of the present invention incorporates a novel, radial basis function.
- FIG. 1 A block diagram of one embodiment of the methods of the present invention is illustrated in Figure 1.
- the method 100 of producing a behavioral model of a nonlinear device from embeddings of time-domain measurements is an iterative process and comprises the step of applying 101 an input signal 204 to the nonlinear device.
- b i ( t ) is a binary random vector or sequence, sequentially taking on values of -1 or + 1 as t is indexed.
- variable ' t ' refers to an independent variable generally associated with time.
- the coefficients p i are the coefficients of a finite impulse response (FIR) filter.
- the preferred embodiment of the FIR filter provides an input signal 204 with a flat spectrum and with a fixed bandwidth about a given center frequency.
- phase space refers to the collection of possible states of a dynamical system.
- a phase space can be finite, countably infinite, or uncountably infinite in dimension.
- the phase space of an ideal coin toss experiment has a dimension of two (i.e. "heads" or "tails").
- the requirement for adequate phase space coverage was met by performing a series of "experiments” involving the sequential application of a number of carefully selected single-tone signals to the nonlinear device.
- phase space coverage is provided by a single input signal 204 in a single experiment. Additionally, in both the co-pending method and the method 100 of the present invention it is a desirable feature of the input signal 204 that it can be generated economically or, in other words, the input signal 204 should be relatively easy to produce.
- the input signal 204 as given by equation (1) is an excellent input signal for producing a behavioral model of a nonlinear device from embeddings of time-domain measurements according to the present invention.
- the input signal 204 of equation (1) is relatively simple to generate and, unlike the method of the co-pending application, does not require multiple experiments to be performed. Construction of the input signal 204 given by equation (1) is described in more detail hereinbelow.
- the method 100 further comprises the step of sampling 102 the input signal 204 to produce input data 210.
- the input signal 204 is sampled at discrete time intervals during the step of applying 101.
- the time intervals can be fixed or variable and generally depend on the input signal 204 characteristics.
- Sampling 102 may be either actual sampling of the input signal 204, as it is applied to the device, or virtual sampling, wherein the samples are created directly from a mathematical description of the input signal 204.
- the time intervals are fixed according to standard engineering practice and the input data 210 is stored as an array of values in a computer memory.
- the method 100 further comprises the step of measuring 103 an output signal or a response signal 206 to the input signal 204 at an output port of the device to produce output data 212 corresponding to the input data 210.
- the response is measured at discrete time intervals and the output data 212 represents a time-series of the response signal.
- the response signal 206 is measured at the same discrete time intervals and times as is used for sampling 102 the input signal 204 and the output data 212 is stored as a separate array or set of values in a computer memory.
- the step of measuring 103 may be followed by a step of filtering 103a the output data 212 in a preferred embodiment of the method 100.
- the step of filtering 103a is used to reduce the noise content of the output data 212.
- Noise is a corruption of the data that may be introduced during the step of measuring 103 and is well known to one skilled in the art.
- the step of filtering 103a may be accomplished using either linear or nonlinear filtering techniques.
- the data 212 is filtered using one of several nonlinear filtering techniques known in the art and described further in the co-pending application. Nonlinear filtering techniques have the advantage of preserving the nonlinear response characteristics of the device present in the output data 212.
- the input data 210 may also be filtered using well known techniques.
- the method 100 still further comprises the step of creating 104 an embedded data set 213 using a first subset 210a of the input data and a first subset 212a of the output data.
- the step of creating 104 an embedded data set 213 comprises the steps of determining 104a an embedding type and dimension and then embedding 104b the first subsets 210a, 212a in an embedding space defined in the step of determining 104a.
- Applicable embedding types of the present invention include, but are not limited to, so called “lagged" embeddings, embeddings using singular value decomposition (SVD) of the data, wavelet embeddings and combinations thereof.
- the embedding types differ by the specific linearly independent functions that are used, as is described further hereinbelow.
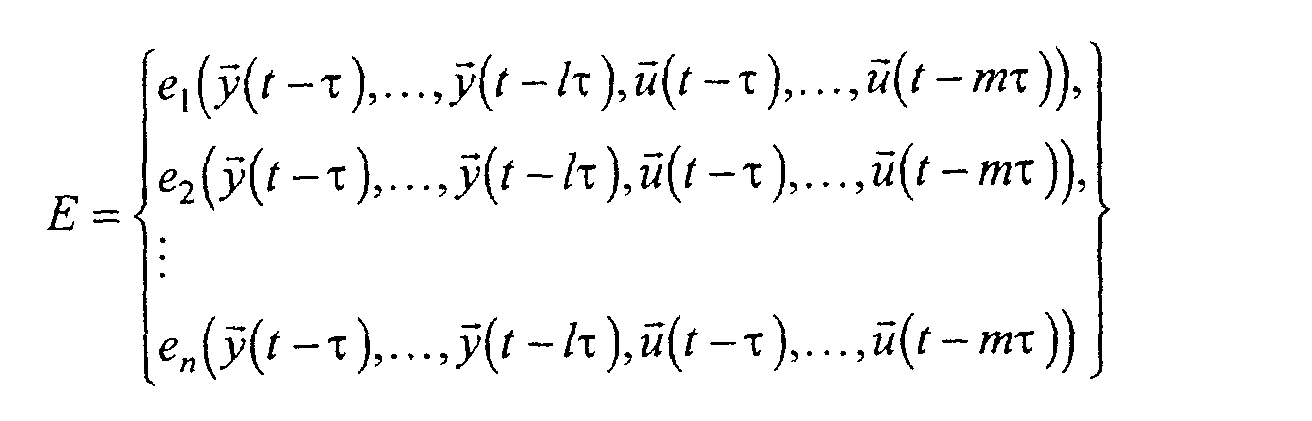
- the embedding type can be represented by a set of functions E as given by where elements of the set, e n , are functions of the input and output data sets and where l , m, and ⁇ are dependent on the specific embedding type and related to the embedding dimension.
- Determining 104a the embedding dimension involves choosing the number of linearly independent functions to be used. The combination of the embedding dimension and the embedding type or functions defines the embedding space. Along with determining 104a an embedding type, determining the embedding dimension is often accomplished in practice in an iterative process.
- the step of embedding 104b the first subset 210a of the input data and the first subset 212a of the output data are "embedded" in the embedding space defined and dimensioned in step 104a.
- the step of embedding 104b transforms the first subset 210a of the input data and the first subset 212a of the output data into a first embedded data set 213a. In general, the amount of data contained in the first embedded data set 213a is larger than that in the original first subsets 210a, 212a.
- the first subset 210a of input data and the first subset 212a of output data contain less data than the total data produced for each according to a preferred embodiment of the method 100.
- the remaining portions of the input data 210 and the output data 212 not included in the first subsets are used in a verification step 106 described below and are referred to as a second subset 210b of input data and a second subset 212b of output data, respectively.
- the first subsets 210a', 212a' comprise all of the available data and therefore, additional data are generated for the second subsets 210b', 212b' after the step of creating 104 the embedded data set 213 for use in the verification step 106.
- the step of creating 104 the embedded data set 213, in particular the step of determining 104a the embedding type and the embedding dimension, is described further in the co-pending application.
- the method 100 further comprises the step of fitting 105 a function G ( ⁇ ) from embedded data set 213 to the corresponding output data 212.
- the function G ( ⁇ ) is a function of the embedded data set 213 created in the step of embedding.
- y ( t ) is the first subset 212a of the output data at time t
- u ( t ) is the first subset 210a of the input data at time t
- l is the number of lagged data samples taken from the first output data subset 212a
- m is the number of lagged data samples taken from the first input data subset 210a
- the sample interval or sample time ⁇ t corresponds to the above described discrete time interval used in the sampling step 102 and the measuring step 103.
- G ( ⁇ ) for other embedding types would be readily apparent to one skilled in the art.
- the step of fitting 105 comprises the steps of determining 105a the function G ( ⁇ ), and selecting 105b the structural parameters ( ⁇ , l and m in the lagged embedding case) and/or other parameters of function G ( ⁇ ).
- other parameters may include polynomial coefficients in the case of a polynomial form of the function G ( ⁇ ).
- the step of fitting 105 is often called model estimation or training and is well known to those skilled in the art.
- model estimation or training is well known to those skilled in the art.
- one skilled in the art would readily recognize an alternative form those hereinabove that would be applicable in addition to the structural parameters involved.
- the techniques include, but are not limited to: (i) least-squares fitting with multivariate polynomials, (ii) fitting using other appropriate basis functions, such as radial basis functions, (iii) fitting using a neural network as a universal function approximator, (iv) fitting with local linear models, and (v) fitting with cluster-weighted models.
- there are many other techniques for fitting a function to data that may be used with the present invention. There may be advantages of using one of these methods over the others in specific practical situations. Such advantages and the correct choice of the function fitting method given a particular embedding should be obvious to one skilled in the art and are all within the scope of the present invention.
- the method 100 further comprises the step of verifying 106 the fitted function G ( ⁇ ) using the second subset 210b, 212b of the input data and the output data.
- the step of verifying 106 comprises the step of using 106a the second subset 210b of input data to produce a second embedded data set 213b.
- the step of verifying 106 further comprises the step of using 106b the first embedded data set 213a and the second embedded data set 213b in the fitted function G ( ⁇ ) to produce a first predicted data and a second predicted data, respectively.
- the step of verifying 106 further comprises the step of comparing 106c the second predicted data from the function G ( ⁇ ) to the second subset 212b of output data.
- the objective of the step of comparing 106c is to determine if the predicted data is sufficiently similar to the second subset 212b of the output data from the device. Whether the predicted data and the second subset 212b of the output data are sufficiently similar will depend on the particular application and should be apparent to one skilled in the art. If the second predicted data and the second subset 212b of the output data are sufficiently similar then the fitted function G ( ⁇ ) accurately mimics or is said to accurately model or predict the performance of the device. The verified fitted function G ( ⁇ ) then becomes the behavioral model of the nonlinear device in a discrete time representation.
- the definition of "sufficiently similar” will depend on the specific application of the present invention.
- two tests are typically performed to help verify 106 the fit of the function G ( ⁇ ).
- the first test assesses the absolute error between the second predicted data produced by the fitted function G ( ⁇ ) and measured data that makes up the second subset of output data 212b.
- the second test assesses whether the function G ( ⁇ ) fits well to both the first and second embedded data sets (213a, 213b) with respect to the corresponding first and second subsets of the output data (212a, 212b). Both of these tests are described in detail in the co-pending application.
- the step of verifying 106 further comprises the step of converting 106d the behavioral model from a discrete time representation to a continuous time representation. Converting from a discrete time representation to a continuous time representation is well known to those skilled in the art.
- the step of applying 101 the excitation signal 204 to a device is followed by the step of sampling 102 the input signal 204 to produce input data 210 and the step of measuring 103 the response of the device to the excitation signal 204 to produce output data 212.
- the steps of sampling 102 and measuring 103 are performed at discrete time intervals. It is well known by those skilled in the art that typical measurements for electronic devices include electrical values such as voltages, currents, incident and reflected power waves at various frequencies. Typical measurements for mechanical or hydraulic devices including but not limited to the motorized vehicle example, are temperature, pressure, volumes, positions, speeds, and accelerations.
- measurements taken on the vehicle might comprise driver inputs such as steering wheel position, brake pressure, throttle position, gear selection and the response of the vehicle including speed, lateral and longitudinal acceleration, and yaw rate.
- the input signal 204 to and the response or output signal 206 of, the device are sampled 102 and measured 103 by sampling and digitizing with an appropriate sample rate or sample interval At.
- One skilled in the art would recognize that there are many approaches to sampling an input signal 204 and measuring an output signal 206 of a device and without undue experimentation would be able to choose an appropriate system for a given device or class of devices.
- the step of creating 104 a first embedded data set 213a involves operations that transform the first subset 210a of input data and the first subset 212a of output data into a new, usually expanded, first embedded data set 213a by applying selected, linearly independent functions to the first input data subset 210a and/or the first output data subset 212a.
- the linearly independent functions defined by a choice of the embedding type are either lags of the input and output data (210, 212) or combinations of lags and wavelets.
- the method 100' of producing a behavioral model of the present invention comprises the step of sampling 102, the step of measuring 103 the output signal 206, the step of creating 104 an embedded data set 213 a function to the embedded data 213, and the step of verifying 106 the fitted function as described above for the method 100.
- the step of applying 101' and input signal 204' and the step of fitting 105' a function to the embedded data 213 differ from the method 100 as described below.
- a block diagram of the method 100' is illustrated in Figure 2.
- the coefficients c i are known as centers and are also determined during the step of fitting 105'.
- the centers are essentially localization functions. The centers can be chosen arbitrarily or using iterative techniques such as least-squares.
- the preferred methods for selecting the centers c i are the "subset selection methods" of K. Judd and A. Mees, "On selecting models for nonlinear time series," Physica 82D, 1995, pp. 426-444 incorporated herein by reference. These subset selection methods find a subset of centers from a candidate set chosen arbitrarily that best describes the data.
- the function ⁇ ( ⁇ ) within the radial basis function of equation (2) is a novel modified gaussian function and is given by wherein x represents the part of z reconstructed using prior output values, and u represents the parts of z constructed from the input signal 204'.
- the coefficients c is the "output" center associated with and having the same dimension as x and similarly the coefficient d is the "input" center associated with and having the same dimension as u .
- the terms v and w are the fixed-widths of "output" and "input” gaussian functions of equation (3). In the preferred embodiment of the method 100' of the present invention, the terms v and w are calculated from the standard deviations of the output and input data respectively.
- This result is achieved by the novel partitioning of equation (3) produces behavioral models that are stable in the presence of a zero stimulus condition.
- the input signal 204' of the step of applying 101' can be any time-domain signal that provides adequate phase space coverage including the input signal 204, described above, and the input signals of the co-pending application.
- the method 100" of producing a behavioral model of the present invention comprises the step of applying 101 an input signal 204, the step of sampling 102 the input signal 204, the step of measuring 103 the output signal 206, the step of creating 104 an embedded data set 213, the step of fitting 105' a function to the embedded data 213, and the step of verifying 106 the fitted function.
- Method 100" differs from method 100 and method 100' in that the step of applying 101 utilizes the CDMA type signal 204 of equation (1) of method 100 and the step of fitting 105' utilizes the novel radial basis function given by equation (2) in conjunction with equation (3) of method 100'.
- a method 300 of constructing a CDMA type input or excitation signal 204 for use in the step of applying 101 of the methods 100, 100" of the present invention is provided.
- the method 300 of constructing is illustrated in Figure 3.
- the method of constructing 300 a CDMA type input signal 204 given by equation (1) comprises the step of selecting 302 a carrier frequency f c .
- the carrier frequency f c is preferably selected 302 based on an expected or desired operational range in which the nonlinear device is to be operated. For example, if an amplifier intended for cellular base station applications is being modeled, then the carrier frequency f c can be selected 302 to correspond to the center of the cellular telephone frequency bands.
- One skilled in the art would be readily able to select 302 a suitable carrier frequency f c for a given example without undue experimentation.
- the method of constructing 300 further comprises the step of choosing 304 a vector dimension N.
- the vector dimension N is an arbitrary integer but is generally chosen 304 to be an integer greater than forty.
- N is an integer in the range between forty-five and sixty.
- the method of constructing 300 still further comprises the step of generating 306 the random vectors b i .
- the random vectors b i are uniformly distributed binary psuedo-random noise (PN) sequences comprised of sequences of 1 's and 0's.
- PN binary psuedo-random noise
- a uniformly distributed PN sequence and methods for generating 306 a uniformly distributed PN sequence are well known to those skilled in the art.
- the method of constructing 300 still further comprises the step of computing 308 the bandpass filter coefficients p i .
- the bandpass filter coefficients are preferably those of a finite impulse response filter (FIR) that provides an input signal 204 with a flat spectrum and with a fixed bandwidth about a given center frequency.
- the step of computing 308 a suitable set of filter coefficients p i can be accomplished with techniques that are well known in the art.
- a suitable FIR bandpass filter design is the one used for the industry standard IS-95 CDMA pulse shaping application and is described in detail in J. S. Lee and L. E. Miller, CDMA Systems Engineering Handbook, Artech House, Boston, 1998, pp. 58-64.
- the method of constructing 300 still further comprises the step of picking 310 a constant amplitude value A and the step of calculating 312 the input signal 204 using equation (1).
- the step of picking 310 the constant amplitude value A depends on the characteristics of the nonlinear device being modeled. Generally A is picked 310 to adjust the peak and average values of the input signal to be within a range of acceptable operation for the nonlinear device being modeled.
- One skilled in the art would readily be able to pick 310 a suitable value for A for a given nonlinear device.
- the step of calculating 312 the input signal 204, u(t) of equation (1), or the input signal 204 comprises the steps of inserting the values of the coefficients and PN sequences determined in step 302-310 into equation (1) and indexing the equation (1) on the variable t .
- a method 400 of determining a radial basis function given by equations (2) and (3) for use in the step of fitting 105' of the methods 100', 100" of the present invention is provided.
- a block diagram of the method 400 of the present invention is illustrated in Figure 4.
- the radial basis function is defined by equation (2).
- the radial basis function of equation (2) utilizes the modified gaussian function given by equation (3).
- the method 400 comprises the step of determining 402 the output center c and the input center d.
- the centers c and d can be determined arbitrarily or through any of several techniques including least-squares, a method known in the art.
- the preferred techniques of determining 402 the set of output centers c and the input centers d is that described by Judd and Mees, referenced above.
- the method 400 further comprises the step of calculating 404 the output widths v and the input widths w .
- the coefficient v is equal to the standard deviation of the first subset of the input data 210a and the coefficient w is equal to the standard deviation of the first subset of the output data 212a.
- the method 400 still further comprises the step of finding 406 the basis function.
- the centers and the coefficients determined in steps 402 and 404 are inserted into the modified gaussian function of equation (3).
- the modified gaussian function of equation (3) is then used in equation (2) during the step of fitting 105' wherein the parameters ⁇ , ⁇ , and ⁇ , are iteratively determined.
Landscapes
- Engineering & Computer Science (AREA)
- Computer Hardware Design (AREA)
- Physics & Mathematics (AREA)
- Theoretical Computer Science (AREA)
- Microelectronics & Electronic Packaging (AREA)
- Evolutionary Computation (AREA)
- Geometry (AREA)
- General Engineering & Computer Science (AREA)
- General Physics & Mathematics (AREA)
- Complex Calculations (AREA)
- Management, Administration, Business Operations System, And Electronic Commerce (AREA)
Abstract
Description





Claims (6)
- A method (100', 100") of producing a behavioral model of a nonlinear device from embeddings of time-domain measurements, the device being real or virtual having one or more input ports and one or more output ports, the method (100', 100") having the steps of applying (101, 101') an input signal (204, 204') to the input port of the nonlinear device, sampling the input signal (204, 204') to produce input data (210), measuring (103) a response to the input signal (204, 204') at the output port of the device to produce output data (212) corresponding to the input data (210), creating (104) an embedded data set (213) using a first subset (210a) of the input data and a first subset (212a) of the output data, fitting (105') a function to the embedded data set (213), and verifying (106) the fitted function using a second subset (210b) of the input data and a second subset (212b) of the output data, such that the verified fitted function is the behavioral model of the nonlinear device, wherein the step of fitting (105') a function comprises using a radial basis function given bywherein β, α, and ω i are coefficients that are determined during the step of fitting, z(t) is output data, and ci are centers of the radial basis function and wherein (·) is a function of the centers ci and the output data z(t).

- The method (100', 100") of Claim 1 wherein the function (·) is a modified gaussian function given bywherein x represents a part of z reconstructed using prior output values, u represent the parts of z constructed from the input signal, the coefficient c is an output center associated with and having a same dimension as x, the coefficient d is an input center associated with and having a same dimension as u, and the terms v and w are fixed-widths of output and input gaussian functions, respectively.

- The method (100") of Claim 1 or 2 wherein the step of applying (101) an input signal (204) comprises:
the step of constructing a CDMA type signal u(t) given bywherein fc is a center frequency, bi (t) are random vectors, pi are coefficients of a bandpass finite impulse response (FIR) filter, N is a vector dimension expressed as an integer, and A is a constant amplitude value.
- The method (100") of Claim 3 wherein the step of constructing a CDMA type signal u(t) comprises the steps of:selecting (302) the carrier frequency fc ;choosing (304) the vector dimension N;generating (306) the random vectors bi ;computing (308) the filter coefficients pi;picking (310) the constant amplitude value A; andcalculating (312) the input signal u(t).
- The method (100") of Claim 3 or 4 wherein the random vectors bi (t) are uniformly distributed binary random vectors of 1's and 0's.
- The method (100") of Claim 3, 4 or 5 wherein a center frequency fc is a center frequency of an operational range of the nonlinear device.
Applications Claiming Priority (2)
| Application Number | Priority Date | Filing Date | Title |
|---|---|---|---|
| US09/511,930 US6775646B1 (en) | 2000-02-23 | 2000-02-23 | Excitation signal and radial basis function methods for use in extraction of nonlinear black-box behavioral models |
| US511930 | 2000-02-23 |
Publications (2)
| Publication Number | Publication Date |
|---|---|
| EP1128293A2 true EP1128293A2 (en) | 2001-08-29 |
| EP1128293A3 EP1128293A3 (en) | 2002-11-27 |
Family
ID=24037021
Family Applications (1)
| Application Number | Title | Priority Date | Filing Date |
|---|---|---|---|
| EP01301681A Withdrawn EP1128293A3 (en) | 2000-02-23 | 2001-02-23 | Modelling non-linear devices |
Country Status (3)
| Country | Link |
|---|---|
| US (1) | US6775646B1 (en) |
| EP (1) | EP1128293A3 (en) |
| JP (1) | JP2001319178A (en) |
Cited By (5)
| Publication number | Priority date | Publication date | Assignee | Title |
|---|---|---|---|---|
| EP1345136A1 (en) * | 2003-01-15 | 2003-09-17 | Agilent Technologies Inc | Modeling an electronic device |
| US6892155B2 (en) | 2002-11-19 | 2005-05-10 | Agilent Technologies, Inc. | Method for the rapid estimation of figures of merit for multiple devices based on nonlinear modeling |
| DE102005020318A1 (en) * | 2005-05-02 | 2006-11-16 | Infineon Technologies Ag | Model determining method for electrical network, involves approximating transmission behavior of memory afflicted system in region of system bandwidth to non-linear transmission behavior of electrical network |
| CN105260556A (en) * | 2015-10-28 | 2016-01-20 | 浙江大学 | Bridge crane modeling method adopting hairpin mutation operation RNA genetic algorithm |
| CN105354379A (en) * | 2015-11-02 | 2016-02-24 | 浙江大学 | Modeling method for bridge crane support vector machine of hairpin crossover operation RNA genetic algorithm |
Families Citing this family (39)
| Publication number | Priority date | Publication date | Assignee | Title |
|---|---|---|---|---|
| US20030125914A1 (en) * | 2001-12-28 | 2003-07-03 | Tan Du | System simulation using dynamic step size and iterative model |
| US20030200134A1 (en) * | 2002-03-29 | 2003-10-23 | Leonard Michael James | System and method for large-scale automatic forecasting |
| US20040086001A1 (en) * | 2002-10-30 | 2004-05-06 | Miao George J. | Digital shaped gaussian monocycle pulses in ultra wideband communications |
| JP2005158019A (en) * | 2003-10-30 | 2005-06-16 | Matsushita Electric Ind Co Ltd | Antenna design method and antenna using the same |
| US20060122820A1 (en) * | 2004-12-03 | 2006-06-08 | The Mitre Corporation | Scripting language for domain-specific modification of a simulation model |
| US7457729B2 (en) * | 2005-01-11 | 2008-11-25 | Verigy (Singapore) Pte. Ltd. | Model based testing for electronic devices |
| US8010324B1 (en) * | 2005-05-09 | 2011-08-30 | Sas Institute Inc. | Computer-implemented system and method for storing data analysis models |
| US8005633B2 (en) * | 2006-02-06 | 2011-08-23 | Verigy (Singapore) Pte. Ltd. | Excitation signal generator for improved accuracy of model-based testing |
| US7711734B2 (en) * | 2006-04-06 | 2010-05-04 | Sas Institute Inc. | Systems and methods for mining transactional and time series data |
| US20080086668A1 (en) * | 2006-10-05 | 2008-04-10 | Jefferson Stanley T | Model-based testing method and system using embedded models |
| US8112302B1 (en) | 2006-11-03 | 2012-02-07 | Sas Institute Inc. | Computer-implemented systems and methods for forecast reconciliation |
| BRPI0622194A2 (en) * | 2006-12-11 | 2012-01-03 | Dytech Ensa S L | internal combustion engine egr appliance |
| US8041552B2 (en) * | 2007-04-10 | 2011-10-18 | Intergrated Device Technology, Inc. | Behavioral modeling of high speed differential signals based on physical characteristics |
| US20090216611A1 (en) * | 2008-02-25 | 2009-08-27 | Leonard Michael J | Computer-Implemented Systems And Methods Of Product Forecasting For New Products |
| CN101430309B (en) * | 2008-11-14 | 2012-03-21 | 西安建筑科技大学 | Environmental quality evaluation method based on rough set-RBF neural network |
| US8631040B2 (en) | 2010-02-23 | 2014-01-14 | Sas Institute Inc. | Computer-implemented systems and methods for flexible definition of time intervals |
| US9336493B2 (en) | 2011-06-06 | 2016-05-10 | Sas Institute Inc. | Systems and methods for clustering time series data based on forecast distributions |
| US9047559B2 (en) | 2011-07-22 | 2015-06-02 | Sas Institute Inc. | Computer-implemented systems and methods for testing large scale automatic forecast combinations |
| US8930166B1 (en) * | 2011-12-06 | 2015-01-06 | Lockheed Martin Corporation | Method and apparatus for efficient extraction of information from signals |
| US9087306B2 (en) | 2012-07-13 | 2015-07-21 | Sas Institute Inc. | Computer-implemented systems and methods for time series exploration |
| US9244887B2 (en) | 2012-07-13 | 2016-01-26 | Sas Institute Inc. | Computer-implemented systems and methods for efficient structuring of time series data |
| US9147218B2 (en) | 2013-03-06 | 2015-09-29 | Sas Institute Inc. | Devices for forecasting ratios in hierarchies |
| US9934259B2 (en) | 2013-08-15 | 2018-04-03 | Sas Institute Inc. | In-memory time series database and processing in a distributed environment |
| CN103853894B (en) * | 2014-03-26 | 2017-04-12 | 上海航天电子通讯设备研究所 | RBF (radial basis function) algorithm-based bait bullet delay casting time precision calculating method |
| US10169720B2 (en) | 2014-04-17 | 2019-01-01 | Sas Institute Inc. | Systems and methods for machine learning using classifying, clustering, and grouping time series data |
| US9892370B2 (en) | 2014-06-12 | 2018-02-13 | Sas Institute Inc. | Systems and methods for resolving over multiple hierarchies |
| US9208209B1 (en) | 2014-10-02 | 2015-12-08 | Sas Institute Inc. | Techniques for monitoring transformation techniques using control charts |
| US9418339B1 (en) | 2015-01-26 | 2016-08-16 | Sas Institute, Inc. | Systems and methods for time series analysis techniques utilizing count data sets |
| US9837970B2 (en) | 2015-03-04 | 2017-12-05 | King Fahd University Of Petroleum And Minerals | Behavioral model and predistorter for modeling and reducing nonlinear effects in power amplifiers |
| US10983682B2 (en) | 2015-08-27 | 2021-04-20 | Sas Institute Inc. | Interactive graphical user-interface for analyzing and manipulating time-series projections |
| US10474775B2 (en) | 2015-08-31 | 2019-11-12 | Keysight Technologies, Inc. | Method and system for modeling an electronic device under test (DUT) using a kernel method |
| CN106202734A (en) * | 2016-07-14 | 2016-12-07 | 中国人民解放军国防科学技术大学 | global sensitivity analysis method based on Gaussian radial basis function |
| JP6822281B2 (en) * | 2017-03-31 | 2021-01-27 | 富士通株式会社 | Input data generators, methods and programs |
| US10331490B2 (en) | 2017-11-16 | 2019-06-25 | Sas Institute Inc. | Scalable cloud-based time series analysis |
| US10338994B1 (en) | 2018-02-22 | 2019-07-02 | Sas Institute Inc. | Predicting and adjusting computer functionality to avoid failures |
| US10255085B1 (en) | 2018-03-13 | 2019-04-09 | Sas Institute Inc. | Interactive graphical user interface with override guidance |
| US10685283B2 (en) | 2018-06-26 | 2020-06-16 | Sas Institute Inc. | Demand classification based pipeline system for time-series data forecasting |
| US10560313B2 (en) | 2018-06-26 | 2020-02-11 | Sas Institute Inc. | Pipeline system for time-series data forecasting |
| US10985951B2 (en) | 2019-03-15 | 2021-04-20 | The Research Foundation for the State University | Integrating Volterra series model and deep neural networks to equalize nonlinear power amplifiers |
Family Cites Families (7)
| Publication number | Priority date | Publication date | Assignee | Title |
|---|---|---|---|---|
| US4635207A (en) | 1984-11-19 | 1987-01-06 | Ici Americas Inc. | Field measuring system |
| ZA955605B (en) * | 1994-07-13 | 1996-04-10 | Qualcomm Inc | System and method for simulating user interference received by subscriber units in a spread spectrum communication network |
| US5706402A (en) * | 1994-11-29 | 1998-01-06 | The Salk Institute For Biological Studies | Blind signal processing system employing information maximization to recover unknown signals through unsupervised minimization of output redundancy |
| US5847952A (en) * | 1996-06-28 | 1998-12-08 | Honeywell Inc. | Nonlinear-approximator-based automatic tuner |
| US6029090A (en) | 1997-01-27 | 2000-02-22 | Herbst; Ewa | Multi-functional electrical stimulation system |
| US5946482A (en) * | 1997-05-16 | 1999-08-31 | Hewlett-Packard Company | Method and apparatus for using parameters to simulate an electronic circuit |
| US5872540A (en) * | 1997-06-26 | 1999-02-16 | Electro-Radiation Incorporated | Digital interference suppression system for radio frequency interference cancellation |
-
2000
- 2000-02-23 US US09/511,930 patent/US6775646B1/en not_active Expired - Fee Related
-
2001
- 2001-02-23 EP EP01301681A patent/EP1128293A3/en not_active Withdrawn
- 2001-02-23 JP JP2001049145A patent/JP2001319178A/en active Pending
Cited By (10)
| Publication number | Priority date | Publication date | Assignee | Title |
|---|---|---|---|---|
| US6892155B2 (en) | 2002-11-19 | 2005-05-10 | Agilent Technologies, Inc. | Method for the rapid estimation of figures of merit for multiple devices based on nonlinear modeling |
| EP1345136A1 (en) * | 2003-01-15 | 2003-09-17 | Agilent Technologies Inc | Modeling an electronic device |
| US7379856B2 (en) | 2003-01-15 | 2008-05-27 | Verigy (Singapore) Pte. Ltd. | Modeling an electronic device |
| DE102005020318A1 (en) * | 2005-05-02 | 2006-11-16 | Infineon Technologies Ag | Model determining method for electrical network, involves approximating transmission behavior of memory afflicted system in region of system bandwidth to non-linear transmission behavior of electrical network |
| DE102005020318B4 (en) * | 2005-05-02 | 2007-02-22 | Infineon Technologies Ag | Method for determining a model for an electrical network and use of the method |
| US7657405B2 (en) | 2005-05-02 | 2010-02-02 | Infineon Technologies Ag | Method for determining a model for an electrical network and use of the method |
| CN105260556A (en) * | 2015-10-28 | 2016-01-20 | 浙江大学 | Bridge crane modeling method adopting hairpin mutation operation RNA genetic algorithm |
| CN105260556B (en) * | 2015-10-28 | 2017-11-24 | 浙江大学 | The overhead crane modeling method of hair clip mutation operation RNA genetic algorithm |
| CN105354379A (en) * | 2015-11-02 | 2016-02-24 | 浙江大学 | Modeling method for bridge crane support vector machine of hairpin crossover operation RNA genetic algorithm |
| CN105354379B (en) * | 2015-11-02 | 2017-12-05 | 浙江大学 | The overhead crane model construction of SVM method of hair clip crossover operation RNA genetic algorithm |
Also Published As
| Publication number | Publication date |
|---|---|
| EP1128293A3 (en) | 2002-11-27 |
| JP2001319178A (en) | 2001-11-16 |
| US6775646B1 (en) | 2004-08-10 |
Similar Documents
| Publication | Publication Date | Title |
|---|---|---|
| US6775646B1 (en) | Excitation signal and radial basis function methods for use in extraction of nonlinear black-box behavioral models | |
| US6850871B1 (en) | Method and apparatus for extraction of nonlinear black-box behavioral models from embeddings of the time-domain measurements | |
| Carroll et al. | Construction of neural nets using the Radon transform | |
| Gilmore et al. | Nonlinear circuit analysis using the method of harmonic balance—A review of the art. Part I. Introductory concepts | |
| MXPA01003920A (en) | Generating a nonlinear model and generating drive signals for simulation testing using the same. | |
| US6772185B1 (en) | Time-series predicting method using wavelet number series and device thereof | |
| US7295961B2 (en) | Method for generating a circuit model | |
| Lang et al. | Evaluation of output frequency responses of nonlinear systems under multiple inputs | |
| Unbehauen et al. | Identification of continuous-time systems: A tutorial | |
| US6892155B2 (en) | Method for the rapid estimation of figures of merit for multiple devices based on nonlinear modeling | |
| CN112001059B (en) | Method and device for establishing broadband model of flexible DC converter valve submodule | |
| Napolitano et al. | Algorithms for analysis of signals with time-warped cyclostationarity | |
| Stoynov | Structural spectral analysis of electrochemical impedance | |
| US7027941B2 (en) | Device and method for calculating electro-magnetic field intensity by cooperation of circuit analyses and electro-magnetic wave analyses | |
| CN115470818A (en) | Method and system for pattern recognition of high-order modulation signals based on variational mode decomposition | |
| US9697321B2 (en) | Method of identifying a value of an unknown circuit component in an analog circuit | |
| El-Yazeed et al. | A preprocessor for analog circuit fault diagnosis based on Prony's method | |
| Blanco-Murillo et al. | A method for informed selection of memory-length and nonlinearity-order parameters in Volterra–Wiener systems from exponential sweep excitations | |
| US6973403B1 (en) | Method and system for identification of system response parameters for finite impulse response systems | |
| Pettanice et al. | Time and frequency macromodeling techniques for electromagnetic systems with propagation delays | |
| Grivet-Talocia et al. | A comparison of reduced-order techniques for complex interconnects modeling | |
| US7143015B1 (en) | Method and system for rapid identification of multiple input systems | |
| Yang et al. | Efficient finite-difference method for quasi-periodic steady-state and small signal analyses | |
| Rahmani et al. | Computation of time-domain impulse-response from band-limited ship power distribution models using wavelet transformation | |
| Bracken et al. | Asymptotic waveform evaluation for S-domain solution of electromagnetic devices |
Legal Events
| Date | Code | Title | Description |
|---|---|---|---|
| PUAI | Public reference made under article 153(3) epc to a published international application that has entered the european phase |
Free format text: ORIGINAL CODE: 0009012 |
|
| AK | Designated contracting states |
Kind code of ref document: A2 Designated state(s): AT BE CH CY DE DK ES FI FR GB GR IE IT LI LU MC NL PT SE TR |
|
| AX | Request for extension of the european patent |
Free format text: AL;LT;LV;MK;RO;SI |
|
| RIN1 | Information on inventor provided before grant (corrected) |
Inventor name: TUFILLARO, NICHOLAS B. Inventor name: WALKER, DAVID M. |
|
| RAP1 | Party data changed (applicant data changed or rights of an application transferred) |
Owner name: AGILENT TECHNOLOGIES, INC. (A DELAWARE CORPORATION |
|
| PUAL | Search report despatched |
Free format text: ORIGINAL CODE: 0009013 |
|
| AK | Designated contracting states |
Kind code of ref document: A3 Designated state(s): AT BE CH CY DE DK ES FI FR GB GR IE IT LI LU MC NL PT SE TR |
|
| AX | Request for extension of the european patent |
Free format text: AL;LT;LV;MK;RO;SI |
|
| 17P | Request for examination filed |
Effective date: 20030527 |
|
| AKX | Designation fees paid |
Designated state(s): DE FR GB |
|
| 17Q | First examination report despatched |
Effective date: 20050704 |
|
| RAP1 | Party data changed (applicant data changed or rights of an application transferred) |
Owner name: AGILENT TECHNOLOGIES, INC. |
|
| GRAP | Despatch of communication of intention to grant a patent |
Free format text: ORIGINAL CODE: EPIDOSNIGR1 |
|
| STAA | Information on the status of an ep patent application or granted ep patent |
Free format text: STATUS: THE APPLICATION IS DEEMED TO BE WITHDRAWN |
|
| 18D | Application deemed to be withdrawn |
Effective date: 20080610 |