EP1118945A1 - Method and system for measuring heart rate variability - Google Patents
Method and system for measuring heart rate variability Download PDFInfo
- Publication number
- EP1118945A1 EP1118945A1 EP01100173A EP01100173A EP1118945A1 EP 1118945 A1 EP1118945 A1 EP 1118945A1 EP 01100173 A EP01100173 A EP 01100173A EP 01100173 A EP01100173 A EP 01100173A EP 1118945 A1 EP1118945 A1 EP 1118945A1
- Authority
- EP
- European Patent Office
- Prior art keywords
- intervals
- heartbeat
- hrv
- patient
- heart rate
- Prior art date
- Legal status (The legal status is an assumption and is not a legal conclusion. Google has not performed a legal analysis and makes no representation as to the accuracy of the status listed.)
- Withdrawn
Links
- 238000000034 method Methods 0.000 title claims description 34
- 230000014509 gene expression Effects 0.000 claims abstract description 6
- 238000012545 processing Methods 0.000 claims abstract description 4
- 238000005259 measurement Methods 0.000 claims description 10
- 230000002889 sympathetic effect Effects 0.000 claims description 3
- 230000001747 exhibiting effect Effects 0.000 claims 1
- 210000001002 parasympathetic nervous system Anatomy 0.000 claims 1
- 210000002820 sympathetic nervous system Anatomy 0.000 claims 1
- 206010019280 Heart failures Diseases 0.000 description 6
- 210000003403 autonomic nervous system Anatomy 0.000 description 6
- 238000004364 calculation method Methods 0.000 description 5
- 230000004217 heart function Effects 0.000 description 5
- 206010042434 Sudden death Diseases 0.000 description 4
- 230000002567 autonomic effect Effects 0.000 description 3
- 230000000747 cardiac effect Effects 0.000 description 3
- 230000001419 dependent effect Effects 0.000 description 3
- 239000011159 matrix material Substances 0.000 description 3
- 230000005405 multipole Effects 0.000 description 3
- 230000001575 pathological effect Effects 0.000 description 3
- 230000001105 regulatory effect Effects 0.000 description 3
- 230000000007 visual effect Effects 0.000 description 3
- 238000004458 analytical method Methods 0.000 description 2
- 238000010586 diagram Methods 0.000 description 2
- 208000037265 diseases, disorders, signs and symptoms Diseases 0.000 description 2
- 230000000694 effects Effects 0.000 description 2
- 238000005516 engineering process Methods 0.000 description 2
- 238000011156 evaluation Methods 0.000 description 2
- 230000001771 impaired effect Effects 0.000 description 2
- 238000007689 inspection Methods 0.000 description 2
- 210000005036 nerve Anatomy 0.000 description 2
- 230000001734 parasympathetic effect Effects 0.000 description 2
- 238000004393 prognosis Methods 0.000 description 2
- 238000011002 quantification Methods 0.000 description 2
- 238000011179 visual inspection Methods 0.000 description 2
- 241001364929 Havel River virus Species 0.000 description 1
- 206010040738 Sinus arrest Diseases 0.000 description 1
- 206010049418 Sudden Cardiac Death Diseases 0.000 description 1
- 230000002159 abnormal effect Effects 0.000 description 1
- 230000001800 adrenalinergic effect Effects 0.000 description 1
- 230000032683 aging Effects 0.000 description 1
- 230000003542 behavioural effect Effects 0.000 description 1
- 210000000748 cardiovascular system Anatomy 0.000 description 1
- 230000000052 comparative effect Effects 0.000 description 1
- 230000001276 controlling effect Effects 0.000 description 1
- 125000004122 cyclic group Chemical group 0.000 description 1
- 230000006735 deficit Effects 0.000 description 1
- 230000000994 depressogenic effect Effects 0.000 description 1
- 238000001514 detection method Methods 0.000 description 1
- 238000003745 diagnosis Methods 0.000 description 1
- 201000010099 disease Diseases 0.000 description 1
- 208000035475 disorder Diseases 0.000 description 1
- 239000003814 drug Substances 0.000 description 1
- 230000004064 dysfunction Effects 0.000 description 1
- 210000004907 gland Anatomy 0.000 description 1
- 238000011835 investigation Methods 0.000 description 1
- 230000005404 monopole Effects 0.000 description 1
- 208000010125 myocardial infarction Diseases 0.000 description 1
- 230000002093 peripheral effect Effects 0.000 description 1
- 238000011160 research Methods 0.000 description 1
- 230000000284 resting effect Effects 0.000 description 1
- 230000033764 rhythmic process Effects 0.000 description 1
- 230000035945 sensitivity Effects 0.000 description 1
- 210000002460 smooth muscle Anatomy 0.000 description 1
- 238000001228 spectrum Methods 0.000 description 1
- 208000024891 symptom Diseases 0.000 description 1
- 230000001515 vagal effect Effects 0.000 description 1
- 210000001186 vagus nerve Anatomy 0.000 description 1
- 210000001835 viscera Anatomy 0.000 description 1
Images


Classifications
-
- A—HUMAN NECESSITIES
- A61—MEDICAL OR VETERINARY SCIENCE; HYGIENE
- A61B—DIAGNOSIS; SURGERY; IDENTIFICATION
- A61B5/00—Measuring for diagnostic purposes; Identification of persons
- A61B5/02—Detecting, measuring or recording for evaluating the cardiovascular system, e.g. pulse, heart rate, blood pressure or blood flow
- A61B5/024—Measuring pulse rate or heart rate
- A61B5/0245—Measuring pulse rate or heart rate by using sensing means generating electric signals, i.e. ECG signals
Definitions
- the present invention relates to a method and a system for measuring heart rate variability (HRV).
- HRV heart rate variability
- HRV has been in use for many years as part of clinical, prognostic work; there are international guidelines for evaluating conventional HRV parameters.
- the conventional parameters are partly frequency domain parameters (power spectra), and partly time domain parameters (various RMS estimates). These methods, though in general successful, are not always conclusive.
- Fig. 1 illustrates an ECG signal wave.
- the electro-physiological features of the heart are generally measured by an electrocardiograph, and the electro-physiological recording of heart function is known as the ECG or EKG.
- the six features P, Q, R, S, T, U (Fig. 1) describe the sequence of two cycles wherein the R potential is the highest peak. It is therefore easy to distinguish the other five features and the R-peak of the next sequence.
- the R-R distance is measured in milliseconds and represents the inverse heart rate (HR).
- the HR is normally not constant, but continually oscillates around its mean level. These short-term cyclic changes are primarily caused by cardiac autonomic modulation.
- the calculation of HR and its variability can be used to estimate autonomic activity as such, and in particular, to evaluate autonomic nervous system influences on heart functions.
- the autonomic nervous system comprises all of the efferent nerves through the visceral organs, including the cardiovascular system, the glands, and the peripheral involuntary muscles.
- the ANS is generally described as a combination of two main systems that balances and interacts: the sympathetic, regulated by adrenergic activities, and the parasympathetic, cholinergically regulated.
- One of the main nerves controlling the activity of the heart is the fast-acting, parasympathetic Vagus nerve.
- HRV heart rate
- the commercially available medical device for detection of HVR is the Holter 24-hour recording and analysis instrument.
- a Holter instrument monitor continuously records heart patterns from electrodes attached to the patient for a 24-hour period.
- the Holter recording technique records the ECG on analog magnetic tape, and a Holter scanner analyzes the tape 60 or 120 times to produce a final report.
- a Holter scanner report may contain statistical calculations of the heart activity and a detailed report of abnormal cardiological events, such as sinus pauses and propped beats.
- a limiting factor of this technology is the long, 24-hour measurement time and the lack of a graphic print-out summarizing the entire examination period as well as a mathematical evaluation of the total measurement.
- U.S. Patent No. 5,682,901 discloses a method and apparatus for measuring autonomic activity of a patient during a short duration.
- the method utilizes a visual description of the recurrence plot and separates between different pathological states, according to different patterns.
- the method suffers from the fact that the figures of the recurrence plots do not allow the inspection of the density of the data points, which varies over the whole contour, but only renders information of the general shape of the plot.
- the method and apparatus of Kamen include performing a calculation of the correlation dimension in order to quantify the degree of heart failure, but such a calculation necessitates a dimension that is partly based on a visual, subjective inspection. Such a visual inspection is known to be unreliable.
- the patient is placed in a resting position on a table and electrodes attached to the patient are connected to a recorder 2, either by wires or by means of wireless technology.
- a recorder 2 Any instruments that can measure and record the R-R distance with the sensitivity and accuracy of 1 msec can be applied, such as, for example, a conventional ECG apparatus, a Holter 24-hour recorder, or a specifically designed instrument.
- the recording is made for a predetermined period of time, from 15 minutes to 24 hours.
- the recorded R-R intervals can then be obtained from an ECG by a PQRS detector 4, or from a specific dedicated recorder, and are transferred to a processing system 6, which may be a personal computer equipped with a software program which detects the R peaks, calculates the R-R intervals between adjacent peaks in msec, and processes the data obtained.
- detector 4 may also include terminal 14 for inputting R-R intervals from other sources, and a patient data bank file 16 for future use.
- the plots and calculations, together with clinical and personal data regarding the patient, will be presented on a screen 8; a printer 10 can provide a printout.
- the R-R interval data is plotted in a two- or three-dimensional recurrence or Poincaré plot 12 (Fig. 3), as an illustration of the HRV.
- a specific mathematical procedure called the Quadrupole Moment Method (QMM) as will be described below, a certain index or value Q det , a quantitative measure for the HRV, is calculated.
- the patient's ECG is collected, recorded by the recorder 2 and digitized at 18.
- the R-R intervals are measured and arranged in a two-dimensional array, e.g., in columns, where one column is the number of the interval, represented by the integers 1, 2, 3 ..., and the second column is the R-R interval expressed in msec, typically between 500-1500 msec for each R-R interval.
- the detrending is achieved by calculating the local average value of the R-R time series in a running window, typically of the length 2 m , where m is a positive integer. This average value is subtracted from the R-R series at the center position of the running window, resulting in the locally detrended R-R interval time series.
- the first R-R interval is marked as a point on a two-dimensional coordinate system 20, wherein the X coordinate is the first R-R interval and the Y coordinate is the second interval.
- the second interval is hereafter marked as the next X coordinate and the consecutive interval as the next Y-coordinate.
- This procedure is continued, the Y coordinate being permanently switched to an X-coordinate in the following point.
- the procedure starts from the first number in the file and obviously ends with the last.
- This procedure is termed "detrending," meaning that every deviation in the heart rate variability is measured relative to an overall average and there is no due consideration given to short term local fluctuations that are not caused by internal variables of the heart rhythm, but are enforced by external conditions.
- Detrending becomes especially crucial in measurements over an extended period of time, e.g., 24 hours, and in every measurement where the patients measured are left in uncontrolled conditions.
- the importance of detrending resides in the accuracy of both prognosis and diagnosis, which depend thereon.
- the evolving recurrence plot 22 of scattered points in Fig. 4 exhibits the density of the points.
- Each data point in the recurrence plot 12 (Fig. 3) is assigned a unit mass.
- the first term in equation (1) is the monopole, and represents the number of data points, which is irrelevant to the analysis of the HRV.
- the second term is the gravitational dipole moment and vanishes by choosing the origin of the coordinate system in the center of the mass.
- the first significant term is hence the third term in the equation (1), the quadrupole moment. This moment is expressed as a 2 x 2 matrix and is rendered independent of the number of data points by dividing it by the number of data points. By diagonalization, the off-diagonal elements of this matrix are set equal to zero.
- This procedure defines, in fact, a new coordinate axis, the Principal Axis.
- the two non-vanishing terms are symbolized by Q xx and Q yy .
- the expressions are given in equation (2).
- the multipole expansion has to be continued.
- the recurrence plot is constructed from the n's dimensional vector R-R i , R-R i+1 , R-R i+2 , ... R-R i+n .
- the multipole expansion is performed on the solution of the Laplace Equation in n dimensions.
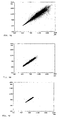
- a patient with a minimal risk of sudden death comparable to that of a healthy individual, will have a recurrence plot as shown in Fig. 5A ; a patient with an increased risk will have a recurrence plot as shown in Fig. 5B , and a patient with a high risk will have a recurrence plot as shown in Fig. 5C .
Landscapes
- Health & Medical Sciences (AREA)
- Life Sciences & Earth Sciences (AREA)
- Engineering & Computer Science (AREA)
- Cardiology (AREA)
- Heart & Thoracic Surgery (AREA)
- Surgery (AREA)
- Physiology (AREA)
- Biophysics (AREA)
- Pathology (AREA)
- Biomedical Technology (AREA)
- Signal Processing (AREA)
- Medical Informatics (AREA)
- Molecular Biology (AREA)
- Physics & Mathematics (AREA)
- Animal Behavior & Ethology (AREA)
- General Health & Medical Sciences (AREA)
- Public Health (AREA)
- Veterinary Medicine (AREA)
- Measurement And Recording Of Electrical Phenomena And Electrical Characteristics Of The Living Body (AREA)
- Measuring Pulse, Heart Rate, Blood Pressure Or Blood Flow (AREA)
- Measuring And Recording Apparatus For Diagnosis (AREA)
Abstract
Description
- The present invention relates to a method and a system for measuring heart rate variability (HRV).
- The study of HRV has been in use for many years as part of clinical, prognostic work; there are international guidelines for evaluating conventional HRV parameters. The conventional parameters are partly frequency domain parameters (power spectra), and partly time domain parameters (various RMS estimates). These methods, though in general successful, are not always conclusive.
- Over the last few years, new methods of analyzing R-R intervals of PQRS plots representative of the human heartbeat wave have appeared, all of them showing improved diagnostic and prognostic performance. It has been shown that so-called scale-dependent methods outperform scale-independent measures with respect to separating healthy subjects from patients suffering from certain cardiac dysfunctions. But in clinical practice, it is of interest to examine whether, within a group of heart patients, one can extract a subgroup of patients who are at risk, e.g., with respect to sudden cardiac death, rather than to verify the presumably known fact that they do not belong to a group of healthy subjects. It has been shown that, while scale-dependent methods worked in the former case, one had to use scale-independent measures in the latter case.
- In practical medicine, recurrence plots of the R-R intervals are used for diagnostic purposes by visual inspection. Since the density of the points is ignored in a visual presentation of the plot, sometimes similar patterns are found for recordings with different HRV's. Although some attempts have been made to include the density of points, this procedure is performed manually and is thus dependent on the performer's skills. Hence, crucial information about the topology of the recurrence plot might be lost.
- Fig. 1 illustrates an ECG signal wave. The electro-physiological features of the heart are generally measured by an electrocardiograph, and the electro-physiological recording of heart function is known as the ECG or EKG. The six features P, Q, R, S, T, U (Fig. 1) describe the sequence of two cycles wherein the R potential is the highest peak. It is therefore easy to distinguish the other five features and the R-peak of the next sequence. The R-R distance is measured in milliseconds and represents the inverse heart rate (HR). The HR is normally not constant, but continually oscillates around its mean level. These short-term cyclic changes are primarily caused by cardiac autonomic modulation.
- The calculation of HR and its variability can be used to estimate autonomic activity as such, and in particular, to evaluate autonomic nervous system influences on heart functions. The autonomic nervous system (ANS) comprises all of the efferent nerves through the visceral organs, including the cardiovascular system, the glands, and the peripheral involuntary muscles. The ANS is generally described as a combination of two main systems that balances and interacts: the sympathetic, regulated by adrenergic activities, and the parasympathetic, cholinergically regulated. One of the main nerves controlling the activity of the heart is the fast-acting, parasympathetic Vagus nerve.
- It is generally accepted today that HRV measurement is also a valuable tool for the determination of the status of the ANS. Changes in vagal activity cause immediate large changes in instantaneous HR, whereas changes in sympathetic activities are associated with more gradual, slow changes.
- The measurement of HR and its rhythmicity, HRV, are commonly used as a diagnostic tool in cardiology. A stable heart rate is a sign that the heart does not respond to external influences, which responses are mainly regulated by the ANS. Such a situation is dangerous for the individual and is considered to be a pathological symptom. Research has indicated that a quantification of HRV, the discrete beat-to-beat variability in the heart, plays an important prognostic role as an indicator of risk associated with a large variety of diseases, behavioral disorders, mortality and also aging, independent of other risk factors.
- Depressed, low HRV has been shown to be a powerful predictor of cardiac events after myocardial infarct. It is therefore crucial to establish a measure of HRV and to quantitatively classify the HRVs of different pathological cases, in order to discriminate between healthy HRV profiles and those of patients at risk.
- The commercially available medical device for detection of HVR is the Holter 24-hour recording and analysis instrument. A Holter instrument monitor continuously records heart patterns from electrodes attached to the patient for a 24-hour period. The Holter recording technique records the ECG on analog magnetic tape, and a Holter scanner analyzes the tape 60 or 120 times to produce a final report. A Holter scanner report may contain statistical calculations of the heart activity and a detailed report of abnormal cardiological events, such as sinus pauses and propped beats. A limiting factor of this technology is the long, 24-hour measurement time and the lack of a graphic print-out summarizing the entire examination period as well as a mathematical evaluation of the total measurement.
- U.S. Patent No. 5,682,901 (Kamen) discloses a method and apparatus for measuring autonomic activity of a patient during a short duration. The method utilizes a visual description of the recurrence plot and separates between different pathological states, according to different patterns. The method, however, suffers from the fact that the figures of the recurrence plots do not allow the inspection of the density of the data points, which varies over the whole contour, but only renders information of the general shape of the plot. The method and apparatus of Kamen include performing a calculation of the correlation dimension in order to quantify the degree of heart failure, but such a calculation necessitates a dimension that is partly based on a visual, subjective inspection. Such a visual inspection is known to be unreliable.
- It is therefore a broad object of the present invention to provide an accurate method and system for measuring HRV over a relatively short period of time of 60 minutes or less.
- It is a further object of the present invention to provide a method and a system for measuring HRV, giving results which are more precise and easier to evaluate.
- It is a still further object of the present invention to provide a method and system enabling a prognosis of the status of a patient with a history of heart failure or impaired heart function, by quantification of the degree of heart failure or heart function impairment.
- It is a yet further object of the present invention to provide a method and a system allowing for the classification of patients with a history of heart failure or impaired heart function into the following three groups, ordered according to the risk of death due to heart failure: (1) patients with a minimal risk of sudden death, comparable to that of healthy individuals; (2) patients with an increased risk of sudden death, and (3) patients with a high risk of sudden death.
- In accordance with the present invention, there is therefore provided a system for measuring heart rate variability (HRV) of a patient, comprising recording means for obtaining and recording heartbeat-to-heartbeat intervals for a predetermined period of time; processing means for digitizing said intervals, forming a recurrence plot, and assigning an unit mass to each point on the plot representing a measured interval, and calculating the determinant by the expression
- Qxx is the quadrupole moment relative to the X axis of the principal coordinate,
- Qyy is the quadrupole moment relative to the Y axis of the principal coordinate; and
- Qdet is the product of Qxx and Qyy.
-
- The invention further provides a method for measuring the heart rate variability (HRV) of a patient, comprising collecting data of heartbeat-to-heartbeat intervals; determining the intervals during a predetermined period of time; generating a recurrence plot from said determined intervals, and calculating the determinant by the expression
- Qxx is the quadrupole moment relative to the X axis of the principal coordinate,
- Qyy is the quadrupole moment relative to the Y axis of the principal coordinate; and
- Qdet is the product of Qxx and Qyy.
-
- The invention will now be described in connection with certain preferred embodiments with reference to the following illustrative figures so that it may be more fully understood.
- With specific reference now to the figures in detail, it is stressed that the particulars shown are by way of example and for purposes of illustrative discussion of the preferred embodiments of the present invention only, and are presented in the cause of providing what is believed to be the most useful and readily understood description of the principles and conceptual aspects of the invention. In this regard, no attempt is made to show structural details of the invention in more detail than is necessary for a fundamental understanding of the invention, the description taken with the drawings making apparent to those skilled in the art how the several forms of the invention may be embodied in practice.
- In the drawings:
- Fig. 1
- is an illustration of a conventional electrocardiograph measurement;
- Fig. 2
- is a block diagram of the system according to the present invention for measuring HRV;
- Fig. 3
- illustrates a recurrence or Poincaré plot;
- Fig. 4
- is a block diagram of the method of the present invention for measuring HRV; and
- Figs. 5A-5C
- are recurrence plots indicative of patients with various degrees of risk due to heart failure.
- The system of measuring HRV according to the present invention will now be described with reference to Fig. 2.
- The patient is placed in a resting position on a table and electrodes attached to the patient are connected to a
recorder 2, either by wires or by means of wireless technology. Any instruments that can measure and record the R-R distance with the sensitivity and accuracy of 1 msec can be applied, such as, for example, a conventional ECG apparatus, a Holter 24-hour recorder, or a specifically designed instrument. The recording is made for a predetermined period of time, from 15 minutes to 24 hours. - The recorded R-R intervals can then be obtained from an ECG by a PQRS detector 4, or from a specific dedicated recorder, and are transferred to a
processing system 6, which may be a personal computer equipped with a software program which detects the R peaks, calculates the R-R intervals between adjacent peaks in msec, and processes the data obtained. Optionally, detector 4 may also include terminal 14 for inputting R-R intervals from other sources, and a patientdata bank file 16 for future use. The plots and calculations, together with clinical and personal data regarding the patient, will be presented on a screen 8; aprinter 10 can provide a printout. - The R-R interval data is plotted in a two- or three-dimensional recurrence or Poincaré plot 12 (Fig. 3), as an illustration of the HRV. By using a specific mathematical procedure called the Quadrupole Moment Method (QMM) as will be described below, a certain index or value Qdet, a quantitative measure for the HRV, is calculated.
- Referring now to Fig. 4, the method according to the present invention will be described.
- The patient's ECG is collected, recorded by the
recorder 2 and digitized at 18. From the digitized ECG, the R-R intervals are measured and arranged in a two-dimensional array, e.g., in columns, where one column is the number of the interval, represented by theintegers 1, 2, 3 ..., and the second column is the R-R interval expressed in msec, typically between 500-1500 msec for each R-R interval. The detrending is achieved by calculating the local average value of the R-R time series in a running window, typically of thelength 2m, where m is a positive integer. This average value is subtracted from the R-R series at the center position of the running window, resulting in the locally detrended R-R interval time series. - The first R-R interval, together with the second R-R interval, is marked as a point on a two-dimensional coordinate
system 20, wherein the X coordinate is the first R-R interval and the Y coordinate is the second interval. The second interval is hereafter marked as the next X coordinate and the consecutive interval as the next Y-coordinate. This procedure is continued, the Y coordinate being permanently switched to an X-coordinate in the following point. The procedure starts from the first number in the file and obviously ends with the last. This procedure is termed "detrending," meaning that every deviation in the heart rate variability is measured relative to an overall average and there is no due consideration given to short term local fluctuations that are not caused by internal variables of the heart rhythm, but are enforced by external conditions. Detrending becomes especially crucial in measurements over an extended period of time, e.g., 24 hours, and in every measurement where the patients measured are left in uncontrolled conditions. The importance of detrending resides in the accuracy of both prognosis and diagnosis, which depend thereon. - The evolving
recurrence plot 22 of scattered points in Fig. 4 exhibits the density of the points. Each data point in the recurrence plot 12 (Fig. 3) is assigned a unit mass. The two-dimensional body is then analyzed in terms of a gravitational, multi-pole expansion :
wherein: - ρ(r') is the density of mass (here equal to 1) at the point (r');
-
r is the position vector of the observation point; -
r ' is the position vector of the mass at r'; - d2
r ' is an infinitesimal area around r'; - M is a number of masses;
- Qij is the normalized quadrupole moment:

- xi is the X or Y coordinate of the vector
r i; and - xixj is the product of two such coordinates.
-
- For the principal axis:geometrical description by Qdet ≡ Qxx·Qyy.

- The first term in equation (1) is the monopole, and represents the number of data points, which is irrelevant to the analysis of the HRV. The second term is the gravitational dipole moment and vanishes by choosing the origin of the coordinate system in the center of the mass. The first significant term is hence the third term in the equation (1), the quadrupole moment. This moment is expressed as a 2 x 2 matrix and is rendered independent of the number of data points by dividing it by the number of data points. By diagonalization, the off-diagonal elements of this matrix are set equal to zero. This procedure defines, in fact, a new coordinate axis, the Principal Axis. The two non-vanishing terms are symbolized by Qxx and Qyy. The expressions are given in equation (2).
- Finally, the determinant of the matrix Qdet = Qxx·Qyy is calculated at 24. This determinant is one of the parameters which can be used in the further investigation of the state of the heart of the patient whose ECG has been measured.
- In certain cases, as with different-shaped recurrence plots for different detrending scales, the multipole expansion has to be continued.
- More comparative parameters are extracted from a higher dimensional recurrence plot, i.e., for n's dimension, the recurrence plot is constructed from the n's dimensional vector R-Ri, R-Ri+1, R-Ri+2, ... R-Ri+n. Here, the multipole expansion is performed on the solution of the Laplace Equation in n dimensions.
- Eventually, diagnostic and prognostic evaluation is performed at 26, on the basis of the measurement results. For example, as seen in Figs. 5A to 5C, a patient with a minimal risk of sudden death, comparable to that of a healthy individual, will have a recurrence plot as shown in Fig. 5A; a patient with an increased risk will have a recurrence plot as shown in Fig. 5B, and a patient with a high risk will have a recurrence plot as shown in Fig. 5C.
- It will be evident to those skilled in the art that the invention is not limited to the details of the foregoing illustrated embodiments and that the present invention may be embodied in other specific forms without departing from the spirit or essential attributes thereof. The present embodiments are therefore to be considered in all respects as illustrative and not restrictive, the scope of the invention being indicated by the appended claims rather than by the foregoing description, and all changes which come within the meaning and range of equivalency of the claims are therefore intended to be embraced therein.
Claims (13)
- A system for measuring heart rate variability (HRV) of a patient, said system comprising:recording means for obtaining and recording heartbeat-to-heartbeat intervals for a predetermined period of time;processing means for digitizing said intervals, forming a recurrence plot, and assigning a unit mass to each point on the plot representing a measured interval, andcalculating the determinant by the expressionQxx is the quadrupole moment relative to the X axis of the principal coordinate,Qyy is the quadrupole moment relative to the Y axis of the principal coordinate; andQdet is the product of Qxx and Qyy.
- The system as claimed in claim 1, wherein said recording means further comprises an input terminal for inputting data concerning heartbeat-to-heartbeat intervals obtained from other sources.
- The system as claimed in claim 1, wherein said recurrence plot is formed on a screen.
- The system as claimed in claim 1, wherein said recurrence plot is produced by a printer.
- The system as claimed in claim 1, further comprising a patient data bank file for future use.
- A method for measuring the heart rate variability (HRV) of a patient, said method comprising:wherein:collecting data of heartbeat-to-heartbeat intervals;determining the intervals during a predetermined period of time;generating a recurrence plot from said determined intervals, andcalculating the determinant by the expressionQxx is the quadrupole moment relative to the X axis of the principal coordinate,Qyy is the quadrupole moment relative to the Y axis of the principal coordinate; andQdet is the product of Qxx and Qyy.
- The method as claimed in claim 6, further comprising digitizing said intervals prior to generating a recurrence plot.
- The method as claimed in claim 6, further comprising exhibiting said recurrence plot on a screen.
- The method as claimed in claim 6, further comprising printing said recurrence plot.
- The method as claimed in claim 6, evaluating the state of the patient's sympathetic and parasympathetic nervous system, based on the HRV measurements obtained.
- The method as claimed in claim 6, further comprising transferring the HRV measurements and calculated determinant to a patient data bank file.
- A system for measuring heart rate variability, substantially as hereinbefore described and with reference to the accompanying drawings.
- A method for measuring heart rate variability, substantially as hereinbefore described and with reference to the accompanying drawings.
Applications Claiming Priority (2)
| Application Number | Priority Date | Filing Date | Title |
|---|---|---|---|
| IL13412300 | 2000-01-19 | ||
| IL13412300A IL134123A (en) | 2000-01-19 | 2000-01-19 | Method and system for measuring heart rate variability |
Publications (1)
| Publication Number | Publication Date |
|---|---|
| EP1118945A1 true EP1118945A1 (en) | 2001-07-25 |
Family
ID=11073727
Family Applications (1)
| Application Number | Title | Priority Date | Filing Date |
|---|---|---|---|
| EP01100173A Withdrawn EP1118945A1 (en) | 2000-01-19 | 2001-01-16 | Method and system for measuring heart rate variability |
Country Status (7)
| Country | Link |
|---|---|
| US (1) | US6731974B2 (en) |
| EP (1) | EP1118945A1 (en) |
| JP (1) | JP4668505B2 (en) |
| AU (1) | AU2701801A (en) |
| CA (1) | CA2397086C (en) |
| IL (1) | IL134123A (en) |
| WO (1) | WO2001052715A2 (en) |
Cited By (4)
| Publication number | Priority date | Publication date | Assignee | Title |
|---|---|---|---|---|
| WO2004043538A1 (en) * | 2002-11-11 | 2004-05-27 | Medtronic, Inc. | Algorithms for detecting atrial arrhythmias from discriminatory signatures of ventricular cycle lengths |
| EP1477114A1 (en) * | 2003-05-13 | 2004-11-17 | GME Rechte und Beteiligungen GmbH | Device and method for detecting atrial fibrillation |
| WO2005043628A3 (en) * | 2003-10-31 | 2005-07-14 | Wom World Of Medicine Ag | Diagnosis and monitoring of the cardiovascular system |
| CN103209637A (en) * | 2010-08-05 | 2013-07-17 | 莱福尔心脏病诊断有限公司 | Method for measuring heart rate variability |
Families Citing this family (13)
| Publication number | Priority date | Publication date | Assignee | Title |
|---|---|---|---|---|
| US8412315B2 (en) * | 2002-03-01 | 2013-04-02 | Christine Ross | Analysis of heart rate variability data in animals for health conditions assessment |
| CA2560294C (en) * | 2004-03-18 | 2014-05-27 | Helicor Inc. | Methods and devices for relieving stress |
| US7430313B2 (en) * | 2004-05-04 | 2008-09-30 | Zbilut Joseph P | Methods using recurrence quantification analysis to analyze and generate images |
| WO2006029438A1 (en) * | 2004-09-16 | 2006-03-23 | The University Of Queensland | A medical monitoring system |
| US20060178588A1 (en) * | 2005-01-03 | 2006-08-10 | Lee Brody | System and method for isolating effects of basal autonomic nervous system activity on heart rate variability |
| US8002711B2 (en) * | 2005-03-18 | 2011-08-23 | Respironics, Inc. | Methods and devices for relieving stress |
| US8504143B2 (en) | 2008-12-15 | 2013-08-06 | Vitalcare Medical Ltd. | Method and system for measuring heart rate variability |
| US8620418B1 (en) | 2013-01-04 | 2013-12-31 | Infobionic, Inc. | Systems and methods for processing and displaying patient electrocardiograph data |
| US9901266B2 (en) | 2015-03-06 | 2018-02-27 | Greatbatch Ltd. | Apparatus and method for personalized cardiac signal processing |
| JP6997581B2 (en) * | 2017-10-12 | 2022-01-17 | 日本光電工業株式会社 | Biometric information processing equipment, biometric information processing methods, programs and storage media |
| US20220323022A1 (en) * | 2019-09-10 | 2022-10-13 | University Of Occupational And Environmental Health, Japan | Core body temperature estimating device, core body temperature estimating method, and non-transitory computer readable medium |
| JP7433428B2 (en) * | 2020-06-05 | 2024-02-19 | 三菱電機株式会社 | Biosignal processing device, monitoring system, and monitoring method |
| JP7520670B2 (en) * | 2020-09-30 | 2024-07-23 | 日本光電工業株式会社 | Biological information processing device, biological information processing method, and biological information processing program |
Citations (2)
| Publication number | Priority date | Publication date | Assignee | Title |
|---|---|---|---|---|
| DE4320519A1 (en) * | 1993-06-22 | 1995-01-05 | Max Delbrueck Centrum | Method of diagnosing cardiac dysrhythmias |
| US5682901A (en) | 1993-08-03 | 1997-11-04 | Kamen; Peter Walter | Method and apparatus for measuring autonomic activity of a patient |
Family Cites Families (12)
| Publication number | Priority date | Publication date | Assignee | Title |
|---|---|---|---|---|
| US4018219A (en) * | 1975-11-03 | 1977-04-19 | American Home Products Corporation | Heart rate variability measurement |
| US5769793A (en) * | 1989-09-08 | 1998-06-23 | Steven M. Pincus | System to determine a relative amount of patternness |
| US5201321A (en) * | 1991-02-11 | 1993-04-13 | Fulton Keith W | Method and apparatus for diagnosing vulnerability to lethal cardiac arrhythmias |
| US5333615A (en) * | 1992-06-22 | 1994-08-02 | William Craelius | Apparatus for digitally recording and analyzing electrocardial and other bioelectric signals |
| JP3196871B2 (en) * | 1994-09-30 | 2001-08-06 | アトムメディカル株式会社 | Diagnostic device |
| US5560368A (en) * | 1994-11-15 | 1996-10-01 | Berger; Ronald D. | Methodology for automated QT variability measurement |
| US5609158A (en) * | 1995-05-01 | 1997-03-11 | Arrhythmia Research Technology, Inc. | Apparatus and method for predicting cardiac arrhythmia by detection of micropotentials and analysis of all ECG segments and intervals |
| US5755671A (en) * | 1995-10-05 | 1998-05-26 | Massachusetts Institute Of Technology | Method and apparatus for assessing cardiovascular risk |
| US5749900A (en) * | 1995-12-11 | 1998-05-12 | Sulzer Intermedics Inc. | Implantable medical device responsive to heart rate variability analysis |
| US6035233A (en) * | 1995-12-11 | 2000-03-07 | Intermedics Inc. | Implantable medical device responsive to heart rate variability analysis |
| US5995868A (en) * | 1996-01-23 | 1999-11-30 | University Of Kansas | System for the prediction, rapid detection, warning, prevention, or control of changes in activity states in the brain of a subject |
| US6026320A (en) * | 1998-06-08 | 2000-02-15 | Cardiac Pacemakers, Inc. | Heart rate variability as an indicator of exercise capacity |
-
2000
- 2000-01-19 IL IL13412300A patent/IL134123A/en not_active IP Right Cessation
-
2001
- 2001-01-16 US US09/760,594 patent/US6731974B2/en not_active Expired - Lifetime
- 2001-01-16 EP EP01100173A patent/EP1118945A1/en not_active Withdrawn
- 2001-01-18 JP JP2001552772A patent/JP4668505B2/en not_active Expired - Lifetime
- 2001-01-18 WO PCT/IL2001/000051 patent/WO2001052715A2/en not_active Ceased
- 2001-01-18 AU AU27018/01A patent/AU2701801A/en not_active Abandoned
- 2001-01-18 CA CA002397086A patent/CA2397086C/en not_active Expired - Lifetime
Patent Citations (2)
| Publication number | Priority date | Publication date | Assignee | Title |
|---|---|---|---|---|
| DE4320519A1 (en) * | 1993-06-22 | 1995-01-05 | Max Delbrueck Centrum | Method of diagnosing cardiac dysrhythmias |
| US5682901A (en) | 1993-08-03 | 1997-11-04 | Kamen; Peter Walter | Method and apparatus for measuring autonomic activity of a patient |
Non-Patent Citations (2)
| Title |
|---|
| HNATKOVA KATERINA ET AL.: "Numeric Processing of Lorenz Plots of R-R INtervals From Long-term ECGs", JOURNAL OF ELECTROCARDIOLOGY, vol. 28 Supplement, 1995, pages 74-80, XP001001487 * |
| MARCIANO F ET AL: "Quantification of Poincare' maps for the evaluation of heart rate variability", COMPUTERS IN CARDIOLOGY 1994, COMPUTERS IN CARDIOLOGY 1994, BETHESDA, MD, USA, 25-28 SEPT. 1994, 1995, Los Alamitos, CA, USA, IEEE Comput. Soc. Press, USA, pages 577 - 580, XP002166711, ISBN: 0-8186-6570-X * |
Cited By (9)
| Publication number | Priority date | Publication date | Assignee | Title |
|---|---|---|---|---|
| WO2004043538A1 (en) * | 2002-11-11 | 2004-05-27 | Medtronic, Inc. | Algorithms for detecting atrial arrhythmias from discriminatory signatures of ventricular cycle lengths |
| US7031765B2 (en) | 2002-11-11 | 2006-04-18 | Medtronic, Inc | Algorithms for detecting atrial arrhythmias from discriminatory signatures of ventricular cycle lengths |
| EP1477114A1 (en) * | 2003-05-13 | 2004-11-17 | GME Rechte und Beteiligungen GmbH | Device and method for detecting atrial fibrillation |
| US7353057B2 (en) | 2003-05-13 | 2008-04-01 | Gme Rechte Und Beteiligungen Gmbh | Apparatus and method for detecting atrial fibrillation |
| WO2005043628A3 (en) * | 2003-10-31 | 2005-07-14 | Wom World Of Medicine Ag | Diagnosis and monitoring of the cardiovascular system |
| CN103209637A (en) * | 2010-08-05 | 2013-07-17 | 莱福尔心脏病诊断有限公司 | Method for measuring heart rate variability |
| CN103209637B (en) * | 2010-08-05 | 2016-06-29 | 莱福尔心脏病诊断有限公司 | Methods Used to Measure Heart Rate Variability |
| US9386930B2 (en) | 2010-08-05 | 2016-07-12 | Lev-El Diagnostics of Heart Diseases Ltd. | Apparatus and method of processing a subject-specific value based on beat-to-beat information |
| US10016141B2 (en) | 2010-08-05 | 2018-07-10 | Lev-El Diagnostics of Heart Diseases Ltd. | Apparatus and method of processing a subject-specific value based on beat-to-beat information |
Also Published As
| Publication number | Publication date |
|---|---|
| WO2001052715A2 (en) | 2001-07-26 |
| CA2397086C (en) | 2005-10-18 |
| US6731974B2 (en) | 2004-05-04 |
| CA2397086A1 (en) | 2001-07-26 |
| US20010008954A1 (en) | 2001-07-19 |
| AU2701801A (en) | 2001-07-31 |
| JP2004523250A (en) | 2004-08-05 |
| JP4668505B2 (en) | 2011-04-13 |
| IL134123A (en) | 2005-06-19 |
| WO2001052715A3 (en) | 2002-01-17 |
| IL134123A0 (en) | 2001-04-30 |
Similar Documents
| Publication | Publication Date | Title |
|---|---|---|
| US6731974B2 (en) | Method and system for measuring heart rate variability | |
| US7412283B2 (en) | Method and system for processing electrocardial signals | |
| US6389308B1 (en) | System and device for multi-scale analysis and representation of electrocardiographic data | |
| EP0468999B1 (en) | Cerebral biopotential analysis system and method | |
| US6280395B1 (en) | System and method for determining muscle dysfunction | |
| US5159932A (en) | Myocardial ischemia detection system | |
| US5570696A (en) | Method and apparatus for assessing myocardial electrical stability | |
| US20030093002A1 (en) | Function indicator for autonomic nervous system based on phonocardiogram | |
| US8041416B2 (en) | Method and apparatus for determining susceptibility for arrhythmias using wedensky modulated electrocardiography and alternans analysis | |
| US6607480B1 (en) | Evaluation system for obtaining diagnostic information from the signals and data of medical sensor systems | |
| EP0489010A1 (en) | Cardiac biopotential analysis system and method | |
| EP1639497B1 (en) | Method and apparatus for extracting causal information from a chaotic time series | |
| US20020156392A1 (en) | Method and apparatus for inspecting biological rhythms | |
| US6223073B1 (en) | Noninvasive method for identifying coronary disfunction utilizing electrocardiography derived data | |
| Swapna et al. | ECG signal generation and heart rate variability signal extraction: Signal processing, features detection, and their correlation with cardiac diseases | |
| US20080125666A1 (en) | Medical Monitoring System | |
| JP4369955B2 (en) | Diagnostic system, diagnostic program | |
| JPS61272034A (en) | Apparatus for measuring respiration and recirculation functions | |
| Ghista et al. | ECG waveform and heart rate variability signal analysis to detect cardiac arrhythmias | |
| EP0896282A1 (en) | A noninvasive method for identifying coronary disfunction utilizing electrocardiography derived data | |
| Eshankulova et al. | STUDY AND COMPARE PARAMETERS OF TREMOR ACTIVITY OF ANTAGONIST MUSCLES IN PATIENTS WITH ESSENTIAL TREMOR AND PARKINSON'S DISEASE USING CROSS SPECTRAL ANALYSIS OF ELECTROMYOGRAMS | |
| JP2004350952A (en) | Autonomic nervous activity evaluation apparatus and method, autonomic nervous activity evaluation program | |
| SU1718801A1 (en) | Method for diagnosing heart vegetative regulation disorders | |
| Nagenthiran et al. | Heart depolarization vector locus cardiogram and its clinical diagnostic applications | |
| Danev et al. | A new approach to health risk assessment by means of heart rate variability |
Legal Events
| Date | Code | Title | Description |
|---|---|---|---|
| PUAI | Public reference made under article 153(3) epc to a published international application that has entered the european phase |
Free format text: ORIGINAL CODE: 0009012 |
|
| AK | Designated contracting states |
Kind code of ref document: A1 Designated state(s): AT BE CH CY DE DK ES FI FR GB GR IE IT LI LU MC NL PT SE TR |
|
| AX | Request for extension of the european patent |
Free format text: AL;LT;LV;MK;RO;SI |
|
| 17P | Request for examination filed |
Effective date: 20020118 |
|
| AKX | Designation fees paid |
Free format text: AT BE CH CY DE DK ES FI FR GB GR IE IT LI LU MC NL PT SE TR |
|
| 17Q | First examination report despatched |
Effective date: 20061016 |
|
| STAA | Information on the status of an ep patent application or granted ep patent |
Free format text: STATUS: THE APPLICATION IS DEEMED TO BE WITHDRAWN |
|
| 18D | Application deemed to be withdrawn |
Effective date: 20090801 |