EP1110502A2 - Clinical research workstation - Google Patents
Clinical research workstation Download PDFInfo
- Publication number
- EP1110502A2 EP1110502A2 EP00311370A EP00311370A EP1110502A2 EP 1110502 A2 EP1110502 A2 EP 1110502A2 EP 00311370 A EP00311370 A EP 00311370A EP 00311370 A EP00311370 A EP 00311370A EP 1110502 A2 EP1110502 A2 EP 1110502A2
- Authority
- EP
- European Patent Office
- Prior art keywords
- database
- ecg
- window
- record
- file
- Prior art date
- Legal status (The legal status is an assumption and is not a legal conclusion. Google has not performed a legal analysis and makes no representation as to the accuracy of the status listed.)
- Withdrawn
Links
- 238000011160 research Methods 0.000 title claims abstract description 41
- 238000000034 method Methods 0.000 claims abstract description 14
- 238000005259 measurement Methods 0.000 claims description 31
- 230000006870 function Effects 0.000 claims description 23
- 230000004044 response Effects 0.000 claims description 17
- 230000004913 activation Effects 0.000 claims description 13
- 239000006185 dispersion Substances 0.000 claims description 9
- 230000003936 working memory Effects 0.000 claims description 8
- 230000015654 memory Effects 0.000 claims description 5
- 230000000875 corresponding effect Effects 0.000 description 21
- 238000004458 analytical method Methods 0.000 description 17
- 238000002565 electrocardiography Methods 0.000 description 13
- 230000000284 resting effect Effects 0.000 description 6
- 230000033764 rhythmic process Effects 0.000 description 6
- 238000012552 review Methods 0.000 description 4
- 230000036772 blood pressure Effects 0.000 description 3
- 238000001914 filtration Methods 0.000 description 3
- 230000000004 hemodynamic effect Effects 0.000 description 3
- 239000003550 marker Substances 0.000 description 3
- 238000012545 processing Methods 0.000 description 3
- 238000002106 pulse oximetry Methods 0.000 description 3
- 230000000747 cardiac effect Effects 0.000 description 2
- 230000002861 ventricular Effects 0.000 description 2
- 238000012935 Averaging Methods 0.000 description 1
- 208000020446 Cardiac disease Diseases 0.000 description 1
- 238000004891 communication Methods 0.000 description 1
- 238000004590 computer program Methods 0.000 description 1
- 230000001276 controlling effect Effects 0.000 description 1
- 238000013523 data management Methods 0.000 description 1
- 238000013500 data storage Methods 0.000 description 1
- 238000010586 diagram Methods 0.000 description 1
- 201000010099 disease Diseases 0.000 description 1
- 208000037265 diseases, disorders, signs and symptoms Diseases 0.000 description 1
- 239000003814 drug Substances 0.000 description 1
- 208000019622 heart disease Diseases 0.000 description 1
- 238000013507 mapping Methods 0.000 description 1
- 239000011159 matrix material Substances 0.000 description 1
- 238000000513 principal component analysis Methods 0.000 description 1
- 238000012950 reanalysis Methods 0.000 description 1
- 238000010183 spectrum analysis Methods 0.000 description 1
- 239000013589 supplement Substances 0.000 description 1
Images


Classifications
-
- A—HUMAN NECESSITIES
- A61—MEDICAL OR VETERINARY SCIENCE; HYGIENE
- A61B—DIAGNOSIS; SURGERY; IDENTIFICATION
- A61B5/00—Measuring for diagnostic purposes; Identification of persons
- A61B5/74—Details of notification to user or communication with user or patient; User input means
- A61B5/7475—User input or interface means, e.g. keyboard, pointing device, joystick
-
- A—HUMAN NECESSITIES
- A61—MEDICAL OR VETERINARY SCIENCE; HYGIENE
- A61B—DIAGNOSIS; SURGERY; IDENTIFICATION
- A61B5/00—Measuring for diagnostic purposes; Identification of persons
-
- A—HUMAN NECESSITIES
- A61—MEDICAL OR VETERINARY SCIENCE; HYGIENE
- A61B—DIAGNOSIS; SURGERY; IDENTIFICATION
- A61B5/00—Measuring for diagnostic purposes; Identification of persons
- A61B5/24—Detecting, measuring or recording bioelectric or biomagnetic signals of the body or parts thereof
- A61B5/316—Modalities, i.e. specific diagnostic methods
- A61B5/318—Heart-related electrical modalities, e.g. electrocardiography [ECG]
- A61B5/339—Displays specially adapted therefor
-
- A—HUMAN NECESSITIES
- A61—MEDICAL OR VETERINARY SCIENCE; HYGIENE
- A61B—DIAGNOSIS; SURGERY; IDENTIFICATION
- A61B5/00—Measuring for diagnostic purposes; Identification of persons
- A61B5/74—Details of notification to user or communication with user or patient; User input means
- A61B5/742—Details of notification to user or communication with user or patient; User input means using visual displays
- A61B5/7435—Displaying user selection data, e.g. icons in a graphical user interface
Definitions
- This invention relates to analysis of electrocardiograms and other physiological data.
- the present invention is directed to an apparatus and a method for taking multiple physiological signals from different sources as input, applying multiple algorithms in its core and generating results which are exported for use in clinical studies and research.
- the apparatus has a built-in database and a built-in spreadsheet to provide a unified platform for all clinical research in the medical field, including, but not limited to, clinical core laboratory work and high-end clinical research.
- the preferred embodiment of the invention is a clinical research workstation capable of handling a wide range of physiological signals including, but not limited to, resting electrocardiogram (ECG), ambulatory ECG, stress ECG, signal-averaged ECG, intra-cardiac electrical and hemodynamic signals, pulse oximetry signals, blood pressure signals, cardiac output signals, electroen-cephalogram, electro-oculogram, etc. Analysis of each of these physiological signals is supported in one or more separate modules.
- ECG resting electrocardiogram
- ambulatory ECG ambulatory ECG
- stress ECG stress ECG
- signal-averaged ECG intra-cardiac electrical and hemodynamic signals
- pulse oximetry signals blood pressure signals
- cardiac output signals electroen-cephalogram
- electro-oculogram electro-oculogram
- the research workstation in accordance with the preferred embodiment is also capable of accepting physiological data from a variety of data sources, such as medical devices and systems, including, but not limited to, electrocardiographs, continuous 12-lead ST segment monitors, Holter recorders, stress ECG systems, defibrillators, patient monitors, home healthcare devices, medical data storage/management systems, etc.
- data sources such as medical devices and systems, including, but not limited to, electrocardiographs, continuous 12-lead ST segment monitors, Holter recorders, stress ECG systems, defibrillators, patient monitors, home healthcare devices, medical data storage/management systems, etc.
- the research workstation has the capability to export any user-selected data in many output formats and different configurations.
- Output data will include, but is not limited to, patient demographic information, measurements and waveform signals of both processed and raw data stored in the data file.
- many measurements and waveforms will also be generated by processing the stored data in the research workstation. Users can select any combination of measurements from a built-in spreadsheet by highlighting the ones they need.
- a batch processing can be used to export the patient demographics, measurements and/or waveform data from the whole directory or a selected database from a built-in Open Database Connectivity (ODBC) database.
- ODBC Open Database Connectivity
- the system will be able to evaluate new parameters using different algorithms. For example, some high-risk cardiac disease indicators such as signal-averaged ECG parameters, QT dispersion, T wave alternans, and heart rate variability, all from the same patient, can be evaluated at the same time.
- some high-risk cardiac disease indicators such as signal-averaged ECG parameters, QT dispersion, T wave alternans, and heart rate variability, all from the same patient, can be evaluated at the same time.
- Algorithms which can be optionally built into the research workstation include, but are not limited to, the following: (1) new measurements with and without user-defined re-analysis from physiological data including, but not limited to, resting ECG, ambulatory ECG, stress ECG, intra-cardiac electrical and hemodynamic signals, and ECG, pulse oximetry and blood pressure signals from neo-natal, pediatric and adult patient monitors and defibrillators; (2) interpretation and re-analysis of resting ECG; (3) QT dispersion and T wave alternans; (4) multilead vector ECG analysis; (5) signal-averaged ECG processing; (6) ECG mapping and modeling; (7) signal filtering and spectral analysis; and (8) heart-rate variability.
- the research workstation has a built-in ODBC database (Microsoft Access database).
- ODBC database Microsoft Access database
- the key parameters are stored automatically into the database, and they can be retrieved, sorted and filtered within the system.
- reviewing and editing the measurements and interpretation are very convenient. For example, a few simple operations such as, clicking "go forward” and “go backward” buttons will lead the researcher through physiological data files one by one.
- the system has a built-in spreadsheet for selecting for export, reviewing and plotting any of the measurements.
- the spreadsheet is compatible with standard data analysis software, including, but not limited to, Microsoft Excel and SAS (statistical analysis software) packages, and can be directly saved as a file compatible with standard data analysis software.
- researchers can perform most analysis and plotting inside the system, and the spreadsheet interacts with the built-in database seamlessly. A trend of a selected group of physiological parameters/measurements can also be plotted.
- the clinical research workstation provides standardized coding/scoring of physiological data, including, but not limited to, Minnesota code, and NOVACODE for resting ECG.
- the research workstation also provides essential functions needed in core laboratories for clinical studies, including, but not limited to, measuring, reviewing and editing of modifiable time markers in physiological waveforms such as waveform onsets, peaks and offsets, re-analysis based on user-modified markers and serial comparison.
- the research workstation software disclosed herein can help physicians advance studies in areas such as disease epidemiology, pharmaceutical research and out-come-based analysis. Using this software, physicians can transform a standard computer with a database program such as Microsoft Access and a spreadsheet program such as Microsoft Excel into an ECG research workstation that allows them to quickly and easily study large volumes of ECG data.
- the research workstation software enables physicians to store, access, review and plot ECG data with point-and-click efficiency.
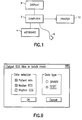
- the preferred embodiment of the invention comprises research workstation software installed on a computer system.
- a typical computer system is generally depicted in FIG. 1 and comprises a computer 2, a keyboard 4, a mouse 6, a display monitor 8 and a printer 10.
- the software of the preferred embodiment requires the following software: an operating system such as Microsoft Windows 95 or 98, or Windows NT 3.51 or 4.0; a database program such as Microsoft Access for Windows; and a spreadsheet program such as Microsoft Excel for Windows.
- ECG research workstation incorporates ECG analysis programs such as 12SL from GE Marquette Medical Systems, Inc., which is a computer program for analyzing simultaneously acquired 12-lead ECGs. It makes precise measurements of recorded cardiac signals, then provides an interpretation of the ECG waveforms using ECG interpretation criteria for both rhythm and morphology.
- ECG analysis programs such as 12SL from GE Marquette Medical Systems, Inc., which is a computer program for analyzing simultaneously acquired 12-lead ECGs. It makes precise measurements of recorded cardiac signals, then provides an interpretation of the ECG waveforms using ECG interpretation criteria for both rhythm and morphology.
- the clinical research workstation software in accordance with the preferred embodiment is used to review and export ECG waveforms, interpretations and measurements for research purposes.
- the main functions of the research workstation software include: (1) acquiring ECG files from devices and systems; (2) reviewing the ECG waveforms, interpretation and measurements; (3) selecting the ECGs based on user-defined criteria (e.g., age, gender, measurements, interpretation); (4) re-measuring and re-analyzing stored ECGs; and (5) exporting the analysis, measurements and waveform data from the stored ECG files or re-measured/re-analyzed results in a user-selected format.
- database includes patient information, parameter data and path names for locating raw ECG (actual waveform) files stored in memory.
- record and “file” will be used interchangeably.
- class and "group” will be used interchangeably to refer to groups of records/files in the database.
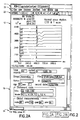
- FIG. 2 An ECG research workstation window is presented in FIG. 2, showing the window as it appears on the computer display screen when the computer is running the research workstation software of the preferred embodiment.
- the title bar 11 contains the title name for the ECG research workstation work area, and the close, maximize and minimize buttons for the ECG research workstation window.
- the window is divided into four quadrants: the upper left-hand quadrant is the Signal window 12, the upper right-hand quadrant is the Modify window 14, the lower left-hand quadrant is the Database window 16, and the lower right-hand quadrant is the Results window 18.
- the windows can be resized by placing the cursor over the intersection of the window borders or over a horizontal or vertical window border and then dragging the cursor using the mouse 6.
- the Signal window 12 displays 12-lead ECG data as a standard, median or rhythm strip.
- the Modify window 14 displays and modifies the appearance of a selected signal from the Signal window 12.
- the Database window 16 displays the records of the Microsoft Access database. With the Database window active, the user can: (1) perform 12SL re-analysis on a group of ECGs automatically; (2) save the results to the database; and (3) review the data.
- the Results window 18 displays 12SL results and parameters.
- the menu bar 20 displays pulldown menu options.
- the available pulldown menus include File, View, Database, DataSheet, Windows and Help menus.
- the tool bar 22 provides quick access to commonly used features.
- the buttons (i.e., tool icons) on the tool bar are available depending upon the function being performed and which window is active. Most of these functions are also available from the pulldown menus.
- the status bar 24 displays research workstation status information.
- the tool bar 22 preferably includes an Open button which opens an ECG file and a Save button which saves the current ECG file. ECG files can also be opened and saved by clicking on Open and Save selections in the File menu.
- the ECG waveforms appear in the signal window 12
- a selected one of those displayed wave-forms appears in the Modify window 14
- the raw waveform data is processed using the ECG analysis program in accordance with the option selected in the Modify window, and the analysis results are displayed in spreadsheet format in the Results window 18.
- Major parameters such as patient name, ID, and age appear in the Database window 16 when an ECG file is opened.
- the Signal window 12 appears in the upper left-hand corner of the ECG research workstation window. It displays the raw, unprocessed waveforms.
- the ECG signals from an opened ECG file can be displayed in one of three formats, the format being selectable by clicking on a corresponding button on the tool bar menu 22, i.e., the Standard ECG Plot, Median ECGs and Rhythm ECGs buttons.
- the Standard ECG Plot button displays a standard ECG in the Signal window, which is in the format of 2.5 sec by 4, plus 10 sec of lead II and v.1.
- the Median ECGs button displays the median beats formed by the ECG analysis program.
- the Rhythm ECGs button displays the 10-sec 12-lead rhythm ECG in the Signal window.
- An individual waveform displayed in the Signal window 12 can be selected for display in the Modify window 14.
- An individual waveform is selected by clicking on it, or by using the up and down keys on the keyboard 4. Pressing the PgUp key selects the first waveform; pressing the PgDn key selects the last waveform.
- a selection bar (not shown), appearing in the form of a vertical line, is used to select a specific point in time on the ECG waveform displayed in the Signal window 12. The selection bar can also be used to take measurements. Whenever the selection bar in the Signal window 12 is moved, data changes in the status bar 24 to reflect the new position.
- the computerized analysis, measurement and interpretation information is provided by the ECG analysis program.
- the Modify window 14 provides individual lead waveform demarcation information and variable display gains, and allows for manual manipulation of automatic demarcation points and complete or partial reanalysis of the ECG data by the ECG analysis program.
- the specific lead displayed in this window is selected from the Signal window, as previously described.
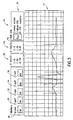
- a Modify window tool bar 26 is displayed directly above the displayed signal, as seen in FIG. 3.
- the Modify window includes a multiplicity of virtual radio buttons.
- the radio button 28 (labeled “pon”) is used to modify the P onset markers; the radio button 30 (labeled “poff”) is used to modify the P offset markers; the radio button 32 (labeled “qon”) is used to modify the Q onset markers; the radio button 34 (labeled “qoff”) is used to modify the Q offset markers; and the radio button 36 (labeled "toff”) is used to modify the T offset marker.
- These markers appear as green lines on the ECG signal in the Modify window.
- the procedure for modifying these markers is as follows: (1) in the Modify window tool bar, click on the virtual radio button corresponding to the marker to be modified; and (2) drag the corresponding green line to the desired location.
- the Modify window tool bar can be used to modify the time and/or amplitude resolution for the signal being displayed in the Modify window.
- One set 38 of virtual radio buttons is provided for changing the time resolution along the X axis; another set 40 of virtual radio buttons is provided for changing the amplitude resolution along the Y axis.
- the three radio buttons in set 38 correspond respectively to time resolutions of 25, 50 and 100 mm/sec.
- the three radio buttons in set 40 correspond respectively to amplitude resolutions of 10, 20 and 40 mm/mV.
- the resolution can be changed by clicking the desired resolution for either the X or Y axis or for both. In response, the signal changes to conform to the new resolutions.
- the grids in the Modify window do not change size.
- Clicking on the Run button 42 runs the ECG analysis program in accordance with a selected one of three options: (1) for the option labeled "meas matrix", only part of the ECG analysis program is performed; (2) for the option labeled "whole 12SL”, the whole ECG analysis is performed, generating more than 700 different ECG measurements; and (3) for the option labeled "12SL markers", the ECG analysis program reanalyzes using the modified markers.
- the raw ECG data will be automatically processed in accordance with the option previously selected in the Modify window, i.e., without the need to click on the Run button 42.
- the results of the analysis are automatically displayed as a spreadsheet in the Results window 18.
- the desired option is selected by clicking on the corresponding virtual radio button in the set 44 in the Modify window tool bar.
- the following steps are performed: (1) click in the Modify window to activate it; (2) for each marker to be modified, click on the corresponding radio button in the Modify window tool bar and then drag the corresponding green line to the desired location; (3) select the "12SL Markers" radio button in set 44 in the Modify window tool bar; and (4) click the Run button 42.
- the results are displayed in the Results window 18, where they can be reviewed by the researcher.
- the Results window 18 appears in the lower right-hand comer of the ECG research workstation window.
- the researcher clicks the "12SL Statement” tab 46 in the Results window.
- the statement and its corresponding code are displayed as shown in FIG. 4.
- the Results window displays the measurements from resting ECGs and patient file parameters for exporting.
- the data display format can be selected either via buttons on the tool bar 22 or via items listed on a Data Sheet menu (not shown in the drawings). Selection of Sheet on the DataSheet menu displays the exported parameters file as a spreadsheet in the Results window 18. Selection of Chart on the DataSheet menu displays the parameter data in the form of a chart.
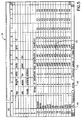
- the Results window can also be used to select parameters for export.
- the Results window 18 displays an array of selectable parameters, including an array of individual lead amplitudes and durations corresponding to the waveforms displayed in the Signal window 12.
- the selected parameters are highlight-ed. In the example shown in FIG. 5, the selected parameter is indicated by the surrounding rectangular box 52.
- a dialog box (not shown) appears on the display, asking the user whether the parameters should be exported now.
- a Save As dialog box (not shown) appears. The user then selects the appropriate directory location and types in the file name. The user then clicks Save to save the file.
- a Select ECG Source box (not shown) appears having two virtual radio buttons, one labeled "From whole directory” and the other labeled "From ECG database”. Selecting "From whole directory” will extract the ECG parameters from all folders in a selected directory. Selecting "From ECG database” will extract the ECG parameters from a selected database class. The ECG parameters are saved when an OK button in the Select ECG Source is clicked on.
- the exported parameters file can be viewed through the Selection Paras tab 50 in the Results window, e.g., in response to selection of Read Parameters in the DataSheet menu.
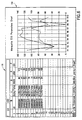
- parameters can be viewed in chart form by linking the spreadsheet data to a chart.
- the procedure for viewing parameters in chart form is as follows: (1) highlight the region in the Results window which is to be linked to a chart; (2) select Link Chart to Sheet on the Data Sheet menu to toggle the linkage between the chart values and the chart on; and (3) select Chart on the Data Sheet menu to toggle the chart display on.
- the selected data appears in chart form in the Results window 18, as shown by representative chart 54 in FIG. 6.
- the Database window 16 appears in the lower left-hand corner of the ECG research workstation window. As shown in FIG. 7, the Database window displays information contained in the database. As previously noted, the database includes the path names to raw ECG data files, not the actual waveforms themselves. In accordance with the preferred embodiment of the invention, the Database window comprises the following fields:
- the user To display a specific record in the Signal window, the user must enter the number of the record in the field next to the GOTO button 56 (see FIG. 4). Initially, the record having number 1 is displayed. Thereafter the system user can scroll through the records of the particular database group identified in the Group field by clicking on a Next Record button in the tool bar 22 (see FIG. 1).
- the toolbar also includes buttons for adding, deleting and modifying records in the database.
- the data in all of the windows changes to correspond to the new record, i.e., the waveforms for the next record are displayed in the Signal window, a selected one of those displayed waveforms is displayed in the Modify window, the computed parameters for those displayed waveforms are displayed in the Results window, and the patient information, Statement code, Global measurements and QT dispersions data fields in the Database window are updated.
- the term "global” means that they are measured across all leads.
- the QT dispersion can be automatically calculated by the computer using any well-known algorithm, such as the algorithms disclosed in U.S. Patent No. 5,792,065 and in the article by Xue et al. entitled "Algorithms for Computerized QT Analysis," J. Electrocardiology, Vol. 30 Supplement.
- the database tool bar is located in the left side of the tool bar 22.
- the buttons of the database tool bar are available only when the Database window is active.
- the database tool bar includes buttons for: displaying a record of the database; adding a record to the end of the database; deleting a record from the database; replacing a current record with a modified version.
- the database tool bar has buttons for saving files in a whole directory to a database; performing a database search; batch exporting of patient information and/or ECG data; and batch exporting selected parameters to an external file from a selected database. When the database tool bar is active, its buttons are green.
- a Database menu is provided having selections corresponding to the four functions (respectively named Read Files to Database, Select Database, Export Data and Export Parameters) set forth in the next preceding sentence of this paragraph.
- any group of database records can be loaded in working memory and reviewed by the user.
- the user may construct a new database group by defining a set of search parameters and then filtering out all data lying outside those parameters. Querying the database is useful in finding ECGs that match certain criteria.
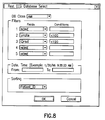
- a search for data satisfying these conditions can be performed as follows: (1) Click inside the Database window to activate it. (2) Click Select Database from the Database menu. The Rest ECG Database Select window (shown in FIG. 8) appears. This window is used when searching the database for records matching specified criteria. (3) If desired, select a database class from the popup menu. If this field is left blank, then all database records are available for the search. (4) Define the parameters for the ECGs that are sought.
- Filter 1 is used if the searcher wants to find a record for a specific patient by name or patient identification number.
- the remaining filters can be used to set search parameters, e.g., the searcher can search for all ECGs in which the ventricular heart rate is less than 100 and the QRS duration is less than 120 msec. (5) Then the date and time are entered. (6) If sorting of the data is desired, a sorting methodology can be selected from the Sorting popup menu. For example, the data gathered by the search can be sorted according to Patient ID. (7) Click the OK button. The selected records from the database are loaded in working memory and appear in the Database window. The raw ECG waveforms from the first record in the group are displayed in the Signal window; a selected one of those waveforms is displayed in the Modify window; and the parameters generated by the ECG analysis program are displayed in the Results window.
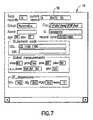
- the preferred embodiment also provides for the batch exportation of data using the following procedure: (1) Click inside the Database window to activate it. (2) Click Export Data from the Database menu. The "Output ECG files in batch mode" window (shown in FIG. 9) appears. (3) The user then selects which data he/she wants to export. The selection of "Patient info" will result in the inclusion of patient information, measurements and parameters for the raw ECG files being output.
- the raw ECG data to be included in the batch can be either median or rhythm ECG signal, depending on which of the corresponding radio buttons is selected. (4) The user then selects whether the data type will be binary data or text.
- the Select ECG Source window (previously described) appears.
- the user selects where the data is to be retrieved from. Selecting "From whole directory” will extract the data from all folders in a selected directory. Selecting "From ECG database” will extract the data from a selected database class.
- the ECG parameters are saved when an OK button in the Select ECG Source is clicked on.
- ECG files may be imported into the workstation by any conventional means, including but not limited to copying ECG files from a diskette, transferring ECG files from a PCMCIA card via local and wide area networks, wireless communication channels, and internet.
Landscapes
- Health & Medical Sciences (AREA)
- Life Sciences & Earth Sciences (AREA)
- Engineering & Computer Science (AREA)
- Molecular Biology (AREA)
- Animal Behavior & Ethology (AREA)
- Biophysics (AREA)
- Pathology (AREA)
- Biomedical Technology (AREA)
- Heart & Thoracic Surgery (AREA)
- Medical Informatics (AREA)
- Veterinary Medicine (AREA)
- Surgery (AREA)
- Physics & Mathematics (AREA)
- General Health & Medical Sciences (AREA)
- Public Health (AREA)
- Cardiology (AREA)
- Human Computer Interaction (AREA)
- Information Retrieval, Db Structures And Fs Structures Therefor (AREA)
- Medical Treatment And Welfare Office Work (AREA)
- Measurement And Recording Of Electrical Phenomena And Electrical Characteristics Of The Living Body (AREA)
- Measuring And Recording Apparatus For Diagnosis (AREA)
- User Interface Of Digital Computer (AREA)
Abstract
Description
- Group: Used to categorize ECGs in the database.
- File: Path to the directory storing the raw ECG file.
- Name: Patient name.
- ID: Patient identification number.
- Age: Patient age.
- Sex: Patient gender.
- Record time: Time the ECG was taken.
- Under the frame labeled "Statement code":
- 12SL: ECG interpretation statement codes.
- CSE: Special coding, Minnesota coding.
- Under the frame labeled "Global measurements":
- Vrate: Ventricular rate.
- PRint: PR interval.
- qrsd: QRS duration.
- Pdur: P duration.
- P-R-T axes: P, R and T axes.
- QTint: QT interval.
- Under the frame labeled "QT dispersions":
- QT-end: from the beginning of the Q wave to the end of the T wave.
- QT-peak: from the beginning of the Q wave to the peak of the T wave.
- PCAS2: Use principal component analysis to describe T wave morphology.
- Leads: Number of leads
- Total records: The number of records used in calculating QT dispersion.
- Current record: The order number of the current record in the database.
Claims (10)
- A system comprising a computer (2), a display screen (8) connected to said computer, and an operator interface (4, 6) connected to said computer, said computer comprising memory for storing a multiplicity of raw ECG files and a database comprising a respective record for each of said raw ECG files, each raw ECG file comprising data representing a plurality of ECG waveforms, and each record comprising a patient identifier, a pathname to the corresponding raw ECG file, and data representing measurements taken from said waveforms of said corresponding raw ECG file, wherein said computer is programmed to perform the following steps:loading a multiplicity of database records in working memory in response to activation of a load database records function via said operator interface; andcontrolling said display screen to concurrently display first and second windows, said first window (12) displaying a plurality of ECG waveforms from a raw ECG file identified by a pathname in one of said loaded database records, and said second window (16) displaying data from said one database record.
- The system as recited in claim 1, wherein said second window comprises a first field which is automatically loaded with a patient identifier from said database record, and a second field which is automatically loaded with an ECG interpretation code from said database record.
- The system as recited in claim 1, wherein said second window comprises a first field which is automatically loaded with a patient identifier from said database record, and a second field which is automatically loaded with a global measurement datum from said database record.
- The system as recited in claim 1, wherein said second window comprises a first field which is automatically loaded with a patient identifier from said database record, and a second field which is automatically loaded with a QT dispersion datum from said database record.
- A research workstation comprising:a display screen (8);an operator interface (4, 6);memory (2) for storing a multiplicity of raw ECG files and a database comprising a respective record for each of said raw ECG files, each raw ECG file comprising data representing a plurality of ECG waveforms, and each record comprising a patient identifier, a pathname to the corresponding raw ECG file, and data representing measurements taken from said waveforms of said corresponding raw ECG file;means (2) for loading a multiplicity of database records in working memory in response to activation of a load database records function via said operator interface; andmeans (2) for concurrently displaying first and second windows on said display screen, said first window (12) displaying a plurality of ECG waveforms from a raw ECG file identified by a pathname in one of said loaded database records, and said second window (16) displaying data from said one database record.
- The workstation as recited in claim 5, further comprising means (2) for scrolling through said raw ECG files and said database records in tandem in response to activation of a scrolling function via said operator interface, a plurality of ECG waveforms for each successive raw ECG file being successively displayed in said first window and data of a corresponding database record associated with said successive raw ECG file being successively displayed in said second window.
- The workstation as recited in claim 5 or 6, further comprising means (2) for retrieving selected records from said database in dependence on search conditions input via said operator interface and in response to activation of a database search function via said operator interface, wherein said selected records satisfy said search conditions.
- The workstation as recited in claim 7, further comprising means (2) for sorting said selected search records in accordance with a sorting function selected via said operator interface.
- A method for performing research on a workstation, comprising the steps of:storing a multiplicity of raw ECG files, each raw ECG file comprising data representing a plurality of ECG waveforms;constructing a database comprising a respective record for each of said raw ECG files, each record comprising a patient identifier, a pathname to the corresponding raw ECG file, and data representing measurements taken from said waveforms of said corresponding raw ECG file;loading a selected group of database records in working memory; andconcurrently displaying a plurality of ECG waveforms from a raw ECG file identified by a pathname in one of said loaded database records and data from said one database record.
- The method as recited in claim 9, further comprising the step of scrolling through said raw ECG files and said database records in tandem, a plurality of ECG waveforms for each successive raw ECG file and data of a corresponding database record associated with said
Applications Claiming Priority (2)
| Application Number | Priority Date | Filing Date | Title |
|---|---|---|---|
| US46982399A | 1999-12-22 | 1999-12-22 | |
| US469823 | 1999-12-22 |
Publications (2)
| Publication Number | Publication Date |
|---|---|
| EP1110502A2 true EP1110502A2 (en) | 2001-06-27 |
| EP1110502A3 EP1110502A3 (en) | 2003-03-26 |
Family
ID=23865185
Family Applications (1)
| Application Number | Title | Priority Date | Filing Date |
|---|---|---|---|
| EP00311370A Withdrawn EP1110502A3 (en) | 1999-12-22 | 2000-12-19 | Clinical research workstation |
Country Status (2)
| Country | Link |
|---|---|
| EP (1) | EP1110502A3 (en) |
| JP (1) | JP2001231760A (en) |
Cited By (3)
| Publication number | Priority date | Publication date | Assignee | Title |
|---|---|---|---|---|
| US8467859B2 (en) | 2006-09-07 | 2013-06-18 | Telozo Gmbh | Method and device for deriving and evaluating cardiovascular information from curves of the cardiac current, in particular for applications in telemedicine |
| CN110379161A (en) * | 2019-07-18 | 2019-10-25 | 中南大学 | A kind of city road network traffic flow amount distribution method |
| EP3698708A4 (en) * | 2018-02-24 | 2021-12-08 | Shanghai Yocaly Health Management Co., Ltd. | ECG INFORMATION PROCESSING PROCEDURES AND ECG WORKSTATION |
Families Citing this family (5)
| Publication number | Priority date | Publication date | Assignee | Title |
|---|---|---|---|---|
| US7199802B2 (en) * | 2003-10-24 | 2007-04-03 | Microsoft Corporation | Multiple-mode window presentation system and process |
| US7925070B2 (en) | 2004-03-30 | 2011-04-12 | Sysmex Corporation | Method for displaying virtual slide and terminal device for displaying virtual slide |
| JP4578135B2 (en) * | 2004-03-30 | 2010-11-10 | シスメックス株式会社 | Specimen image display method and specimen image display program |
| JP5048038B2 (en) * | 2009-11-05 | 2012-10-17 | シスメックス株式会社 | Blood cell classification result display method and blood cell classification result display program |
| JP7638704B2 (en) * | 2020-12-28 | 2025-03-04 | フクダ電子株式会社 | Holter electrocardiogram recording device |
Citations (1)
| Publication number | Priority date | Publication date | Assignee | Title |
|---|---|---|---|---|
| US5792065A (en) | 1997-03-18 | 1998-08-11 | Marquette Medical Systems, Inc. | Method and apparatus for determining T-wave marker points during QT dispersion analysis |
Family Cites Families (5)
| Publication number | Priority date | Publication date | Assignee | Title |
|---|---|---|---|---|
| US5277188A (en) * | 1991-06-26 | 1994-01-11 | New England Medical Center Hospitals, Inc. | Clinical information reporting system |
| US5520191A (en) * | 1994-10-07 | 1996-05-28 | Ortivus Medical Ab | Myocardial ischemia and infarction analysis and monitoring method and apparatus |
| JP3083465B2 (en) * | 1995-09-06 | 2000-09-04 | フクダ電子株式会社 | Patient information analysis management system and method |
| US6004276A (en) * | 1997-03-03 | 1999-12-21 | Quinton Instrument Company | Open architecture cardiology information system |
| US6416471B1 (en) * | 1999-04-15 | 2002-07-09 | Nexan Limited | Portable remote patient telemonitoring system |
-
2000
- 2000-12-19 EP EP00311370A patent/EP1110502A3/en not_active Withdrawn
- 2000-12-20 JP JP2000386524A patent/JP2001231760A/en active Pending
Patent Citations (1)
| Publication number | Priority date | Publication date | Assignee | Title |
|---|---|---|---|---|
| US5792065A (en) | 1997-03-18 | 1998-08-11 | Marquette Medical Systems, Inc. | Method and apparatus for determining T-wave marker points during QT dispersion analysis |
Cited By (4)
| Publication number | Priority date | Publication date | Assignee | Title |
|---|---|---|---|---|
| US8467859B2 (en) | 2006-09-07 | 2013-06-18 | Telozo Gmbh | Method and device for deriving and evaluating cardiovascular information from curves of the cardiac current, in particular for applications in telemedicine |
| EP3698708A4 (en) * | 2018-02-24 | 2021-12-08 | Shanghai Yocaly Health Management Co., Ltd. | ECG INFORMATION PROCESSING PROCEDURES AND ECG WORKSTATION |
| US11783924B2 (en) | 2018-02-24 | 2023-10-10 | Shanghai Lepu CloudMed Co., LTD | ECG information processing method and ECG workstation |
| CN110379161A (en) * | 2019-07-18 | 2019-10-25 | 中南大学 | A kind of city road network traffic flow amount distribution method |
Also Published As
| Publication number | Publication date |
|---|---|
| JP2001231760A (en) | 2001-08-28 |
| EP1110502A3 (en) | 2003-03-26 |
Similar Documents
| Publication | Publication Date | Title |
|---|---|---|
| EP1110503B1 (en) | Clinical research workstation | |
| JP4493310B2 (en) | Method and apparatus for performing interactive annotation and measurement functions of time series data by automatic marking | |
| JP4493311B2 (en) | Method and apparatus for performing interactive annotation and measurement functions of time series data with automatic marker sequence creation | |
| JP5057635B2 (en) | Method and apparatus for performing interactive annotation and measurement functions of time series data for centralized analysis and review | |
| JP5057636B2 (en) | Method and apparatus for performing interactive annotation and measurement functions of time series data | |
| CN111433860B (en) | User interface for analyzing an electrocardiogram | |
| EP1227752B1 (en) | Myocardial analysis and monitoring method and apparatus | |
| JP5468724B2 (en) | Multi-layer system for cardiac medical and patient monitoring data analysis | |
| WO2022070109A1 (en) | Electrocardiogram processing system for detecting and/or predicting cardiac events | |
| CN110448295B (en) | Electrocardiographic waveform editing and displaying method and device and computer equipment | |
| US12376778B2 (en) | ECG features for type ahead editing and automatic update for report interpretation | |
| WO2021173555A2 (en) | System and methods for cloud-based interactive graphic editing on ecg data | |
| EP1110502A2 (en) | Clinical research workstation | |
| Vicente et al. | ECGlab: User friendly ECG/VCG analysis tool for research environments | |
| US20060161066A1 (en) | Feature-based editing for electrocardiography | |
| EP1406198A2 (en) | Method and apparatus for interactive annotation and measurement of time series data | |
| CN108478214A (en) | A kind of antialiasing stacking method and device for electrocardiogram (ECG) data analysis | |
| CN110968717A (en) | Dynamic electrocardiogram data retrieval method and device, storage medium and processor | |
| JPH08206089A (en) | Organism information collecting/recording device | |
| CN107103191A (en) | The masterplate system analyzed available for electrocardiogram (ECG) data | |
| JP2021027918A (en) | Waveform display apparatus, waveform display method and waveform display program | |
| JP3047849B2 (en) | Confirmation and correction processing method of ECG analysis result and ECG information processing apparatus therefor | |
| Lymberis et al. | Communication and interoperability for serial comparison in continuous health care–the new challenges | |
| CN107092789A (en) | Electrocardiogram (ECG) data analysis tool system and application method | |
| CN117224135A (en) | Electrocardiogram blood pressure correlation processing method, detection assembly and readable storage medium |
Legal Events
| Date | Code | Title | Description |
|---|---|---|---|
| PUAI | Public reference made under article 153(3) epc to a published international application that has entered the european phase |
Free format text: ORIGINAL CODE: 0009012 |
|
| AK | Designated contracting states |
Kind code of ref document: A2 Designated state(s): AT BE CH CY DE DK ES FI FR GB GR IE IT LI LU MC NL PT SE TR |
|
| AX | Request for extension of the european patent |
Free format text: AL;LT;LV;MK;RO;SI |
|
| PUAL | Search report despatched |
Free format text: ORIGINAL CODE: 0009013 |
|
| AK | Designated contracting states |
Kind code of ref document: A3 Designated state(s): AT BE CH CY DE DK ES FI FR GB GR IE IT LI LU MC NL PT SE TR Designated state(s): AT BE CH CY DE DK ES FI FR GB GR IE IT LI LU MC NL PT SE TR |
|
| AX | Request for extension of the european patent |
Extension state: AL LT LV MK RO SI |
|
| 17P | Request for examination filed |
Effective date: 20030926 |
|
| AKX | Designation fees paid |
Designated state(s): CH DE FR GB LI |
|
| STAA | Information on the status of an ep patent application or granted ep patent |
Free format text: STATUS: THE APPLICATION IS DEEMED TO BE WITHDRAWN |
|
| 18D | Application deemed to be withdrawn |
Effective date: 20040701 |