EP1107157A2 - System and method for performing predictive analysis - Google Patents
System and method for performing predictive analysis Download PDFInfo
- Publication number
- EP1107157A2 EP1107157A2 EP00480088A EP00480088A EP1107157A2 EP 1107157 A2 EP1107157 A2 EP 1107157A2 EP 00480088 A EP00480088 A EP 00480088A EP 00480088 A EP00480088 A EP 00480088A EP 1107157 A2 EP1107157 A2 EP 1107157A2
- Authority
- EP
- European Patent Office
- Prior art keywords
- predictive
- objects
- variables
- data
- variable
- Prior art date
- Legal status (The legal status is an assumption and is not a legal conclusion. Google has not performed a legal analysis and makes no representation as to the accuracy of the status listed.)
- Withdrawn
Links
Images



Classifications
-
- G—PHYSICS
- G06—COMPUTING OR CALCULATING; COUNTING
- G06Q—INFORMATION AND COMMUNICATION TECHNOLOGY [ICT] SPECIALLY ADAPTED FOR ADMINISTRATIVE, COMMERCIAL, FINANCIAL, MANAGERIAL OR SUPERVISORY PURPOSES; SYSTEMS OR METHODS SPECIALLY ADAPTED FOR ADMINISTRATIVE, COMMERCIAL, FINANCIAL, MANAGERIAL OR SUPERVISORY PURPOSES, NOT OTHERWISE PROVIDED FOR
- G06Q40/00—Finance; Insurance; Tax strategies; Processing of corporate or income taxes
- G06Q40/04—Trading; Exchange, e.g. stocks, commodities, derivatives or currency exchange
Definitions
- the present invention relates to a system and method for performing predictive analysis and more particularly to such system and method for stock market predictive analysis.
- Some statistical methods based on neural networks offer more robustness such as the generic method described in U.S.5,461,699 from Arbabi and al. in which a system for forecasting combines a neural network with a statistical forecast.
- a neural network having an input layer, a hidden layer, and an output layer with each layer having one or more nodes is presented. Each node in the input layer is connected to each node in the hidden layer and each node in the hidden layer is connected to each node in the output layer. Each connection between nodes has an associated weight.
- One node in the input layer is connected to a statistical forecast that is produced by a statistical model. All other nodes in the input layer are connected to a different historical datum from the set of historical data.
- the neural network being operative by outputting a forecast, the output of the output layer nodes, when presented with input data.
- the weights associated with the connections of the neural network are first adjusted by a training device.
- the training device applies a plurality of training sets to the neural network, each training set consisting of historical data, an associated statistical output and a desired forecast, with each set of training data the training device determines a difference between the forecast produced by the neural network given the training data and the desired forecast, the training device then adjusts the weights of the neural network based on the difference.
- a data processing system and method for selecting securities and constructing an investment portfolio is based on a set of artificial neural networks which are designed to model and track the performance of each security in a given capital market and output a parameter which is related to the expected risk adjusted return for the security.
- Each artificial neural network is trained using a number of fundamental and price and volume history input parameters about the security and the underlying index.
- the system combines the expected return/appreciation potential data for each security via an optimization process to construct an investment portfolio which satisfies predetermined aggregate statistics.
- the data processing system receives input from the capital market and periodically evaluates the performance of the investment portfolio, rebalancing it whenever necessary to correct performance degradation.
- a problem associated with these non parametric processes is to correctly determine which variables are significant for the prediction.
- the present invention is directed towards solving these aforementioned problems. It is therefore an object of the invention to provide a method for generating predictive models which is computed over groups of stocks to provide a global view of stocks market.
- This object is achieved by a robust iterative method which uses parametric models to provide clear and easy interpretable results.
- the present invention discloses a method and system for generating predictive models on evolutive data.
- the method runs in a data processing system comprising a processor and data storage means containing a database of stock market raw transactional data.
- the method consists in creating a table of evolutive data from the raw transactional data.
- the table comprises a plurality of objects to be observed over a predefined period of time and a set of computational variables over which the plurality of objects are observed at successive discrete time points.
- the computational variables comprise a first variable to be predicted and a plurality of predictive variables.
- Temporary predictive models are build over the predefined period of time for each object within the table wherein each temporary predictive model provides a factor weight associated to each predictive variable.
- a cluster of the plurality of objects is performed based on the factor weight associated to each predictive variable wherein each cluster includes a subset of the plurality of objects, and for each subset of the plurality of objects, a predictive model is build using the set of computational variables over the predefined period of time.
- the predictive models are build by applying a logistic regression method or by using a generalized linear model or an ordered probit model.
- the set of computational variables is preferably determined using a stepwise method while the clustering of the plurality of objects is performed either by using a hierarchical clustering or a relational analysis or a k-means method.
- Figure 1 is a block diagram of a typical digital computer utilized by a preferred embodiment of the invention.
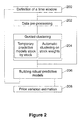
- FIG. 2 is an overview of the predictive process according to the present invention.
- Figure 3 is a simplified representation of raw transactional data table as used by the process of the invention.
- Figure 4 illustrates a 'bid and ask' curve for the preferred embodiment.
- Figures 5-a and 5-b are detailed flow charts of the clustering step to be used in the predictive process of figure 2.
- FIG. 1 illustrates an environment in which a preferred embodiment of the present invention operates.
- the preferred embodiment of the present invention operates on a computer platform 105.
- the computer platform 105 includes hardware units 108, including one or more Central Processing Unit (CPU) 110, a Random Access Memory (RAM) 109, and an input/output (I/O) interface 111.
- the computer platform 105 runs with an operating system 106, and may include micro instruction code 107.
- a data base management system 100 may be part of the micro instruction code 107 or an application program to be executed via the operating system.
- Raw transactional data giving status information relative to the particular application may be stored in any kind of local or remote data storage 113. Remote data storage may be accessible through modems and communication lines (not shown).
- the data may be collected from various sources and media such as written information, experts evaluations, or in-house historical.
- Various peripheral units 112 like terminals, disks or scanners may be connected to the computer platform 105 for inputting the data.
- the computer platform 105 could be a server terminal connected to multiple clients CPU.
- a user or an actor wishing to process the method of the invention would access the system through the I/O interface 111.
- the I/O interface circuit could be as well a remote terminal with Internet like connection.
- the prediction process is now described with reference to figure 2.
- the process starts at step 200, wherein a time window is defined for the learning phase of the prediction model.
- a time window is defined for the learning phase of the prediction model.
- raw transactional data are collected to be later processed to provide a prediction model for a specific variable.
- the model is further operated by users for predicting the specific variable.
- the time window extends over one day, but any other time period may be defined, such as days or months depending on the particular application.
- the raw transactional data are preprocessed to be arranged in a table of evolutive data.
- the raw transactional data are a collection of information relating to the order books as it is now described with reference to figure 3.
- Figure 3 is a simplified example of transactional data organized in a matrix 300 comprising 8 rows of stocks (301-1 to 301-8) and by 6 columns (302,303,304-1 to 304-4).
- a first variable 'Stock' identifies the objects (the stocks) contained within the rows.
- the second column 303 is named 'Snapshot' to store the discrete time values (the snapshots) at which the stocks are observed (for example each five seconds along the time window, i.e. 24 hours).
- Column 304-3 gives the proposed price for buying this stock at the first snapshot, for example 10,1.
- the last column contains the value of the proposed selling price 10,5 at the first snapshot.
- the value of the observed parameters 304-1 to 304-4 are stored for the same stock S1 but at the next snapshot, i.e. at 9.05 am.
- the table is filled with each observation and at the end of the observation time period, the last row 300-8 contains the values of the measured parameters for the last stock S2 at the last snapshot (9.15 am).
- the information contained within table 300 is first exploited in the form of the well-known 'bid and ask' curves in order to compute a set of computational variables associated to each object (each stock) at each snapshot.
- the set of variables comprises a first variable for which the prediction is sought (the variable to be predicted) and a plurality of predictive variables which reveals some interesting characteristics of the 'bid and ask' curves.
- the plurality of predictive variables are exploited during the process of the present invention as it will be detailed later.
- the variable to be predicted is the stock price variation between two consecutive snapshots (t, t+1).
- Figure 4 is a simplified representation of 'bid and ask' curves at a snapshot 't'.
- the abscissa of curve 400 details the quantities of stocks proposed by actors for buying (Q_buy) or for selling (Q_Sel) the stocks.
- the ordinate of curve 400 details the prices of stocks as proposed by actors for buying (P_buy) or for selling (P_Sel) the stocks.
- the lower curve illustrates the 'bid' curve while the higher curve illustrates the 'ask' curve. From curves 400, two groups of predictive variables are computed, a static group and a dynamic group.
- Static group includes predictive variables well-known in the field of stock exchange such as the spread, the depth, the median price, the buying slope and the selling slope which are described on a 'bid and ask' curves at a particular snapshot 't'.
- Dynamic group includes predictive variables which describe variations between two 'bid and ask' curves at two different snapshots, for example between snapshot 't' and snapshot 't-1' or between snapshot 't' and snapshot 't-2'.
- One preferred dynamic variable is the price and the quantity of a given stock at a given snapshot 't' as compared to a 'bid and ask' curve of a previous snapshot 't-1'.
- Other dynamic predictive variables may be computed such as for example the price variation between snapshot 't-1' and snapshot 't'.
- the initial collected parameters 304-1 to 304-4 which relate to the prices and the quantities of stocks proposed by actors either for buying or for selling are normalized before the static and the dynamic predictive variables are computed.
- Std-P_Sel1 (t) P_Sel1 (t) / Med-price (t)
- Std-P_Buy1(t) P_Buy1(t) / Med-price (t)
- the preprocessing step provides a set of computational variables including a first variable to be predicted and a plurality of static and dynamic predictive variables for each stock and each snapshot.
- the rows of the transactional data table are preferably filtered to select a number of rows having highest (positive or negative) values of the variable to be predicted.
- a guided clustering of the data transformed by the preprocessing is performed in two operations.
- a temporary predictive model is computed for each stock over the set of snapshots.
- Each temporary predictive model provides a ponderation value or factor weight for each predictive variable.
- an automatic clustering of the stocks is performed based on the ponderation value associated to each stock.
- Figure 5-a and 5-b illustrates in more details the guided clustering operation 204.
- step 500 a well-known stepwise logistic regression is performed on each stock over the set of snapshots. The result provides for each stock an intermediate temporary predictive model and a subset of the most discriminant predictive variables.
- generalized linear models or ordered probit models may be used to provide the intermediate temporary predictive model in well-known fashion.
- Step 500 is run for all the stocks and for each stock the associated subset of the most discriminant predictive variables is stored within a memory area of the database system management 100.
- a new subset is selected among the whole subsets of the most discriminant predictive variables.
- the new subset includes the most frequently stored discriminant predictive variables.
- a logistic regression is performed in a well known manner on each stock with the new subset of the most frequently stored discriminant predictive variables. The result provides for each stock a temporary predictive model giving a ponderation value for each predictive variable.
- the computed weights are temporary stored within a memory area of the database system management 100.
- the stocks are clustered into several groups denoted (510,512,514,516) based on the factor weights.
- the clusters of stocks may be displayed to the users to offer a global view of the stock market.
- step 206 consists in building a robust predictive model for each group of stocks (clusters 510 to 516) previously computed in step 204. For each cluster, a stepwise logistic regression is performed over a subset of the transformed data previously issued from step 202 and containing all stocks of the considered group with the corresponding snapshots. The result of step 206 provides a robust model for each group of stocks.
- step 208 the robust predictive models are stored in local or remote databases to be run by a user to estimate the trend of the variable to be predicted.
- the process may loop back from step 206 to step 200 to update the robust predictive models if new raw transactional data are presented to the database system management 100.
Landscapes
- Business, Economics & Management (AREA)
- Accounting & Taxation (AREA)
- Finance (AREA)
- Engineering & Computer Science (AREA)
- Development Economics (AREA)
- Economics (AREA)
- Marketing (AREA)
- Strategic Management (AREA)
- Technology Law (AREA)
- Physics & Mathematics (AREA)
- General Business, Economics & Management (AREA)
- General Physics & Mathematics (AREA)
- Theoretical Computer Science (AREA)
- Financial Or Insurance-Related Operations Such As Payment And Settlement (AREA)
- Information Retrieval, Db Structures And Fs Structures Therefor (AREA)
Abstract
Description
The present invention is directed towards solving these aforementioned problems. It is therefore an object of the invention to provide a method for generating predictive models which is computed over groups of stocks to provide a global view of stocks market.
It is obviously to be understood that for simplification of the description, only 8 rows and 6 columns are illustrated, but it is not to be interpreted as a limitation by the skill person and in application the number of rows and columns may be extended.
Other dynamic predictive variables may be computed such as for example the price variation between snapshot 't-1' and snapshot 't'.
In the preferred embodiment, the initial collected parameters 304-1 to 304-4 which relate to the prices and the quantities of stocks proposed by actors either for buying or for selling are normalized before the static and the dynamic predictive variables are computed.
the standardized buying price value is calculated as follows:
In a first step, a temporary predictive model is computed for each stock over the set of snapshots. Each temporary predictive model provides a ponderation value or factor weight for each predictive variable. In a second step, an automatic clustering of the stocks is performed based on the ponderation value associated to each stock.
On
Claims (25)
- In a data processing system comprising a processor and data storage means containing a database of raw transactional data, a method for generating predictive models on evolutive data, the method comprising the steps of:a) creating a table of evolutive data from the raw transactional data, the table comprising a plurality of objects to be observed over a predefined period of time and a set of computational variables over which the plurality of objects are observed at successive discrete time points, said computational variables comprising a first variable to be predicted and a plurality of predictive variables;b) for each object within the table building a temporary predictive model over the predefined period of time, each temporary predictive model providing a factor weight associated to each predictive variable;c) clustering the plurality of objects based on the factor weight associated to each predictive variable, each cluster including a subset of the plurality of objects; andd) for each subset of the plurality of objects, building a predictive model over the predefined period of time using the set of computational variables.
- The method of claim 1 wherein the step of creating a table further comprising the steps of:a1) extracting from the database a plurality of objects to be observed over a predefined period of time;a2) generating a set of computational variables from the raw transactional data comprising a first variable to be predicted and a plurality of predictive variables; anda3) computing at successive discrete time points the value of each variable for the plurality of objects.
- The method of claim 1 or 2 wherein the plurality of predictive variables comprises static variables and dynamic variables.
- The method of claim 1 wherein step b) of building temporary predictive models comprises the step of applying a method from the group of logistic regression or generalized linear model or ordered probit model.
- The method of claim 1 wherein step d) of building predictive models comprises the step of applying a method from the group of logistic regression or generalized linear model or ordered probit model.
- The method of claim 1 wherein the set of computational variables is determined using a stepwise method.
- The method of claim 1 wherein step c) of clustering the plurality of objects is performed using a hierarchical clustering.
- The method of claim 1 wherein step c) of clustering the plurality of objects is performed using relational analysis.
- The method of claim 1 wherein step c) of clustering the plurality of objects is performed using a k-means method.
- The method of claim 1 wherein the predictive models are build using neural networks.
- The method of claim 1 further comprising the step of storing the predictive models in a database for user access.
- The method of claim 11 wherein the predictive models are used for intra day analysis of stock market.
- In a data processing system comprising a processor and data storage means containing a database of raw transactional data, a system for generating predictive models on evolutive data comprising:a) means for creating a table of evolutive data from the raw transactional data, the table comprising a plurality of objects to be observed over a predefined period of time and a set of computational variables over which the plurality of objects are observed at successive discrete time points, said computational variables comprising a first variable to be predicted and a plurality of predictive variables;b) means for building a temporary predictive model over the predefined period of time for each object within the table, each temporary predictive model providing a factor weight associated to each predictive variable;c) means for clustering the plurality of objects based on the factor weight associated to each predictive variable, each cluster including a subset of the plurality of objects; andd) means using the set of computational variables for building a predictive model over the predefined period of time for each subset of the plurality of objects.
- The system of claim 13 wherein the means for creating a table further comprising:a1) means for extracting from the database a plurality of objects to be observed over a predefined period of time;a2) means for generating a set of computational variables from the raw transactional data comprising a first variable to be predicted and a plurality of predictive variables; anda3) means for computing at successive discrete time points the value of each variable for the plurality of objects.
- The system of claim 13 or 14 wherein the plurality of predictive variables comprises static variables and dynamic variables.
- The system of claim 13 wherein said means for building temporary predictive models further comprises means for applying either a logistic regression or a generalized linear model or an ordered probit model.
- The system of claim 13 wherein said means for building predictive models further comprises means for applying either a logistic regression or a generalized linear model or an ordered probit model.
- The system of claim 13 wherein the set of computational variables is determined using a stepwise method.
- The system of claim 13 wherein step c) of clustering the plurality of objects is performed using a hierarchical clustering.
- The system of claim 13 wherein step c) of clustering the plurality of objects is performed using relational analysis.
- The system of claim 13 wherein step c) of clustering the plurality of objects is performed using a k-means method.
- The system of claim 13 wherein the predictive models are build using neural networks.
- The system of claim 13 further comprising means for storing the predictive models in a database for user access.
- The system of claim 23 wherein the predictive models are used for intra day analysis of stock market.
- A computer program product stored in memory executable by a processor for generating predictive models on evolutive data, in a database stored in a data processing system and containing raw transactional data, the product comprising:a) means for creating a table of evolutive data from the raw transactional data, the table comprising a plurality of objects to be observed over a predefined period of time and a set of computational variables over which the plurality of objects are observed at successive discrete time points, said computational variables comprising a first variable to be predicted and a plurality of predictive variables;b) means for building a temporary predictive model over the predefined period of time for each object within the table, each temporary predictive model providing a factor weight associated to each predictive variable;c) means for clustering the plurality of objects based on the factor weight associated to each predictive variable, each cluster including a subset of the plurality of objects; andd) means using the set of computational variables for building a predictive model over the predefined period of time for each subset of the plurality of objects.
Priority Applications (1)
| Application Number | Priority Date | Filing Date | Title |
|---|---|---|---|
| EP00480088A EP1107157A3 (en) | 1999-12-01 | 2000-09-28 | System and method for performing predictive analysis |
Applications Claiming Priority (3)
| Application Number | Priority Date | Filing Date | Title |
|---|---|---|---|
| EP99480129 | 1999-12-01 | ||
| EP99480129 | 1999-12-01 | ||
| EP00480088A EP1107157A3 (en) | 1999-12-01 | 2000-09-28 | System and method for performing predictive analysis |
Publications (2)
| Publication Number | Publication Date |
|---|---|
| EP1107157A2 true EP1107157A2 (en) | 2001-06-13 |
| EP1107157A3 EP1107157A3 (en) | 2001-11-28 |
Family
ID=26073665
Family Applications (1)
| Application Number | Title | Priority Date | Filing Date |
|---|---|---|---|
| EP00480088A Withdrawn EP1107157A3 (en) | 1999-12-01 | 2000-09-28 | System and method for performing predictive analysis |
Country Status (1)
| Country | Link |
|---|---|
| EP (1) | EP1107157A3 (en) |
Cited By (12)
| Publication number | Priority date | Publication date | Assignee | Title |
|---|---|---|---|---|
| FR2835632A1 (en) * | 2002-02-06 | 2003-08-08 | France Telecom | SYSTEM FOR PREDICTIVE ANALYSIS OF TEMPORAL INFORMATION FLOWS |
| WO2006050245A3 (en) * | 2004-11-02 | 2007-10-25 | Eagleforce Associates | System and method for predictive analysis and predictive analysis markup language |
| US7333997B2 (en) | 2003-08-12 | 2008-02-19 | Viziant Corporation | Knowledge discovery method with utility functions and feedback loops |
| US7398270B1 (en) | 2001-01-31 | 2008-07-08 | Choi Lawrence J | Method and system for clustering optimization and applications |
| US7421419B2 (en) | 2005-04-12 | 2008-09-02 | Viziant Corporation | System and method for evidence accumulation and hypothesis generation |
| EP1627275A4 (en) * | 2003-03-05 | 2008-09-03 | Morgan Stanley | Intelligent simulation analysis method and system |
| US7801836B2 (en) | 2006-09-27 | 2010-09-21 | Infosys Technologies Ltd. | Automated predictive data mining model selection using a genetic algorithm |
| US20150032665A1 (en) * | 2011-08-26 | 2015-01-29 | Morgan Stanley & Co. Llc | Computer-based systems and methods for computing market-adjusted elasticities for accounts |
| US9684490B2 (en) | 2015-10-27 | 2017-06-20 | Oracle Financial Services Software Limited | Uniform interface specification for interacting with and executing models in a variety of runtime environments |
| CN109145033A (en) * | 2009-09-25 | 2019-01-04 | 阿德南·法科 | Computer system and computer-implemented method |
| US10699233B1 (en) * | 2015-07-22 | 2020-06-30 | Wells Fargo Bank, N.A. | Dynamic prediction modeling |
| CN112508304A (en) * | 2020-12-22 | 2021-03-16 | 上海浦东发展银行股份有限公司 | Transaction object liquidity prediction method, device, equipment and storage medium |
Family Cites Families (4)
| Publication number | Priority date | Publication date | Assignee | Title |
|---|---|---|---|---|
| JPH0567119A (en) * | 1991-07-12 | 1993-03-19 | Hitachi Ltd | Merchandise analyzing system |
| JPH05342191A (en) * | 1992-06-08 | 1993-12-24 | Mitsubishi Electric Corp | System for predicting and analyzing economic time sequential data |
| US5461699A (en) * | 1993-10-25 | 1995-10-24 | International Business Machines Corporation | Forecasting using a neural network and a statistical forecast |
| US5761442A (en) * | 1994-08-31 | 1998-06-02 | Advanced Investment Technology, Inc. | Predictive neural network means and method for selecting a portfolio of securities wherein each network has been trained using data relating to a corresponding security |
-
2000
- 2000-09-28 EP EP00480088A patent/EP1107157A3/en not_active Withdrawn
Cited By (17)
| Publication number | Priority date | Publication date | Assignee | Title |
|---|---|---|---|---|
| US7398270B1 (en) | 2001-01-31 | 2008-07-08 | Choi Lawrence J | Method and system for clustering optimization and applications |
| WO2003067463A3 (en) * | 2002-02-06 | 2004-05-27 | France Telecom | System for predictive analysis of time series data flows |
| US7299214B2 (en) | 2002-02-06 | 2007-11-20 | France Telecom | System for predictive analysis of time series data flows |
| FR2835632A1 (en) * | 2002-02-06 | 2003-08-08 | France Telecom | SYSTEM FOR PREDICTIVE ANALYSIS OF TEMPORAL INFORMATION FLOWS |
| US7865415B2 (en) | 2003-03-05 | 2011-01-04 | Morgan Stanley | Intelligent simulation analysis method and system |
| EP1627275A4 (en) * | 2003-03-05 | 2008-09-03 | Morgan Stanley | Intelligent simulation analysis method and system |
| US7333997B2 (en) | 2003-08-12 | 2008-02-19 | Viziant Corporation | Knowledge discovery method with utility functions and feedback loops |
| US7389282B2 (en) | 2004-11-02 | 2008-06-17 | Viziant Corporation | System and method for predictive analysis and predictive analysis markup language |
| WO2006050245A3 (en) * | 2004-11-02 | 2007-10-25 | Eagleforce Associates | System and method for predictive analysis and predictive analysis markup language |
| US7421419B2 (en) | 2005-04-12 | 2008-09-02 | Viziant Corporation | System and method for evidence accumulation and hypothesis generation |
| US7801836B2 (en) | 2006-09-27 | 2010-09-21 | Infosys Technologies Ltd. | Automated predictive data mining model selection using a genetic algorithm |
| CN109145033A (en) * | 2009-09-25 | 2019-01-04 | 阿德南·法科 | Computer system and computer-implemented method |
| US20150032665A1 (en) * | 2011-08-26 | 2015-01-29 | Morgan Stanley & Co. Llc | Computer-based systems and methods for computing market-adjusted elasticities for accounts |
| US10699233B1 (en) * | 2015-07-22 | 2020-06-30 | Wells Fargo Bank, N.A. | Dynamic prediction modeling |
| US11610169B1 (en) | 2015-07-22 | 2023-03-21 | Wells Fargo Bank, N.A. | Dynamic prediction modeling |
| US9684490B2 (en) | 2015-10-27 | 2017-06-20 | Oracle Financial Services Software Limited | Uniform interface specification for interacting with and executing models in a variety of runtime environments |
| CN112508304A (en) * | 2020-12-22 | 2021-03-16 | 上海浦东发展银行股份有限公司 | Transaction object liquidity prediction method, device, equipment and storage medium |
Also Published As
| Publication number | Publication date |
|---|---|
| EP1107157A3 (en) | 2001-11-28 |
Similar Documents
| Publication | Publication Date | Title |
|---|---|---|
| AU2022211812A1 (en) | Method and system of dynamic model selection for time series forecasting | |
| US20050033709A1 (en) | Adaptive learning enhancement to automated model maintenance | |
| WO2018222308A1 (en) | Time-based features and moving windows sampling for machine learning | |
| KR102409041B1 (en) | portfolio asset allocation reinforcement learning method using actor critic model | |
| CN111667307A (en) | Method and device for forecasting sales volume of wealth management products | |
| Sriram | Leveraging artificial intelligence and machine learning for next-generation credit risk assessment models | |
| CN119741117A (en) | Decision support method and system based on big data and intelligent algorithm | |
| CN121903691A (en) | Dynamic optimization method and system for full-channel sales promotion combination based on multi-agent reinforcement learning | |
| CN118332195B (en) | Intelligent recommendation method, device and storage medium for personalized consumption data prediction | |
| CN120931111A (en) | Enterprise budget dynamic analysis and optimization method based on multimode generation antagonism network and variational Bayesian optimization | |
| CN119850190A (en) | Pumped storage device maintenance strategy evaluation method, device, computer device, readable storage medium and program product | |
| CN117853158A (en) | Enterprise operation data prediction method and device based on dynamic cost-benefit analysis | |
| CN116644237A (en) | Investment configuration recommendation method, device, equipment and medium based on artificial intelligence | |
| CN116167646A (en) | Evaluation method, device, equipment and storage medium based on transaction algorithm | |
| CN115330490A (en) | Product recommendation method and device, storage medium and equipment | |
| Chaveesuk et al. | Economic valuation of capital projects using neural network metamodels | |
| He et al. | Case Study: Corporación Favorita Grocery Sales Forecasting | |
| CN119887266B (en) | Data value analysis method and system based on machine learning | |
| CN111651672A (en) | Time-interval user activity recommendation method and device based on deep learning | |
| CN119865786B (en) | Model training method and device and recommendation method for operator package | |
| Fan | Model Uncertainty of Stock Market Based on CNN Predictions | |
| Liu | Machine learning for short-term water demand predictions | |
| Surekha et al. | Arbitrage: Stock Market Comparative Analysis | |
| Aboluwodi et al. | Forecasting Real Estate Performance during the COVID-19 Pandemic Crisis: A Comparison of Statistical and Machine Learning Models | |
| Zou | Rapid Discovery Approach of Abnormal Stocks Based on Temporal Convolutional Autoencoder |
Legal Events
| Date | Code | Title | Description |
|---|---|---|---|
| PUAI | Public reference made under article 153(3) epc to a published international application that has entered the european phase |
Free format text: ORIGINAL CODE: 0009012 |
|
| AK | Designated contracting states |
Kind code of ref document: A2 Designated state(s): DE FR GB Kind code of ref document: A2 Designated state(s): AT BE CH CY DE DK ES FI FR GB GR IE IT LI LU MC NL PT SE |
|
| AX | Request for extension of the european patent |
Free format text: AL;LT;LV;MK;RO;SI |
|
| PUAL | Search report despatched |
Free format text: ORIGINAL CODE: 0009013 |
|
| AK | Designated contracting states |
Kind code of ref document: A3 Designated state(s): AT BE CH CY DE DK ES FI FR GB GR IE IT LI LU MC NL PT SE |
|
| AX | Request for extension of the european patent |
Free format text: AL;LT;LV;MK;RO;SI |
|
| 17P | Request for examination filed |
Effective date: 20020116 |
|
| 17Q | First examination report despatched |
Effective date: 20020327 |
|
| AKX | Designation fees paid | ||
| RBV | Designated contracting states (corrected) |
Designated state(s): DE FR GB |
|
| REG | Reference to a national code |
Ref country code: DE Ref legal event code: 8566 |
|
| STAA | Information on the status of an ep patent application or granted ep patent |
Free format text: STATUS: THE APPLICATION IS DEEMED TO BE WITHDRAWN |
|
| 18D | Application deemed to be withdrawn |
Effective date: 20030523 |