EP1097674B1 - Method and apparatus for adapting imaging system operation based on pixel intensity histogram - Google Patents
Method and apparatus for adapting imaging system operation based on pixel intensity histogram Download PDFInfo
- Publication number
- EP1097674B1 EP1097674B1 EP00309775A EP00309775A EP1097674B1 EP 1097674 B1 EP1097674 B1 EP 1097674B1 EP 00309775 A EP00309775 A EP 00309775A EP 00309775 A EP00309775 A EP 00309775A EP 1097674 B1 EP1097674 B1 EP 1097674B1
- Authority
- EP
- European Patent Office
- Prior art keywords
- pixel intensity
- histogram
- gray
- condition
- values
- Prior art date
- Legal status (The legal status is an assumption and is not a legal conclusion. Google has not performed a legal analysis and makes no representation as to the accuracy of the status listed.)
- Expired - Lifetime
Links
- 238000000034 method Methods 0.000 title claims description 22
- 238000003384 imaging method Methods 0.000 title description 6
- 238000013507 mapping Methods 0.000 claims description 26
- 238000013144 data compression Methods 0.000 claims description 15
- 238000012285 ultrasound imaging Methods 0.000 claims description 14
- 230000004044 response Effects 0.000 claims description 9
- 230000001934 delay Effects 0.000 claims description 4
- 239000000523 sample Substances 0.000 description 21
- 230000006870 function Effects 0.000 description 13
- 238000005457 optimization Methods 0.000 description 10
- 239000013598 vector Substances 0.000 description 7
- 238000007906 compression Methods 0.000 description 6
- 230000006835 compression Effects 0.000 description 6
- 230000008569 process Effects 0.000 description 6
- 210000003484 anatomy Anatomy 0.000 description 4
- 238000002604 ultrasonography Methods 0.000 description 4
- 230000000875 corresponding effect Effects 0.000 description 3
- 238000010304 firing Methods 0.000 description 3
- 230000006641 stabilisation Effects 0.000 description 3
- 238000011105 stabilization Methods 0.000 description 3
- 230000009466 transformation Effects 0.000 description 3
- 230000001131 transforming effect Effects 0.000 description 3
- 238000004458 analytical method Methods 0.000 description 2
- 238000001514 detection method Methods 0.000 description 2
- 238000010586 diagram Methods 0.000 description 2
- 238000012886 linear function Methods 0.000 description 2
- 230000002792 vascular Effects 0.000 description 2
- 230000003466 anti-cipated effect Effects 0.000 description 1
- 238000013459 approach Methods 0.000 description 1
- 230000017531 blood circulation Effects 0.000 description 1
- 230000008859 change Effects 0.000 description 1
- 230000002596 correlated effect Effects 0.000 description 1
- 238000007405 data analysis Methods 0.000 description 1
- 230000000881 depressing effect Effects 0.000 description 1
- 238000003745 diagnosis Methods 0.000 description 1
- 238000002592 echocardiography Methods 0.000 description 1
- 230000000694 effects Effects 0.000 description 1
- 230000007246 mechanism Effects 0.000 description 1
- 238000012544 monitoring process Methods 0.000 description 1
- 238000003825 pressing Methods 0.000 description 1
- 229920006395 saturated elastomer Polymers 0.000 description 1
- 238000012546 transfer Methods 0.000 description 1
Images

Classifications
-
- G—PHYSICS
- G01—MEASURING; TESTING
- G01S—RADIO DIRECTION-FINDING; RADIO NAVIGATION; DETERMINING DISTANCE OR VELOCITY BY USE OF RADIO WAVES; LOCATING OR PRESENCE-DETECTING BY USE OF THE REFLECTION OR RERADIATION OF RADIO WAVES; ANALOGOUS ARRANGEMENTS USING OTHER WAVES
- G01S7/00—Details of systems according to groups G01S13/00, G01S15/00, G01S17/00
- G01S7/52—Details of systems according to groups G01S13/00, G01S15/00, G01S17/00 of systems according to group G01S15/00
- G01S7/52017—Details of systems according to groups G01S13/00, G01S15/00, G01S17/00 of systems according to group G01S15/00 particularly adapted to short-range imaging
- G01S7/52053—Display arrangements
- G01S7/52057—Cathode ray tube displays
- G01S7/5206—Two-dimensional coordinated display of distance and direction; B-scan display
-
- A—HUMAN NECESSITIES
- A61—MEDICAL OR VETERINARY SCIENCE; HYGIENE
- A61B—DIAGNOSIS; SURGERY; IDENTIFICATION
- A61B8/00—Diagnosis using ultrasonic, sonic or infrasonic waves
- A61B8/06—Measuring blood flow
-
- A—HUMAN NECESSITIES
- A61—MEDICAL OR VETERINARY SCIENCE; HYGIENE
- A61B—DIAGNOSIS; SURGERY; IDENTIFICATION
- A61B8/00—Diagnosis using ultrasonic, sonic or infrasonic waves
- A61B8/13—Tomography
-
- G—PHYSICS
- G06—COMPUTING; CALCULATING OR COUNTING
- G06T—IMAGE DATA PROCESSING OR GENERATION, IN GENERAL
- G06T5/00—Image enhancement or restoration
- G06T5/40—Image enhancement or restoration by the use of histogram techniques
-
- G06T5/92—
-
- G—PHYSICS
- G06—COMPUTING; CALCULATING OR COUNTING
- G06T—IMAGE DATA PROCESSING OR GENERATION, IN GENERAL
- G06T2207/00—Indexing scheme for image analysis or image enhancement
- G06T2207/10—Image acquisition modality
- G06T2207/10016—Video; Image sequence
-
- G—PHYSICS
- G06—COMPUTING; CALCULATING OR COUNTING
- G06T—IMAGE DATA PROCESSING OR GENERATION, IN GENERAL
- G06T2207/00—Indexing scheme for image analysis or image enhancement
- G06T2207/10—Image acquisition modality
- G06T2207/10132—Ultrasound image
-
- G—PHYSICS
- G06—COMPUTING; CALCULATING OR COUNTING
- G06T—IMAGE DATA PROCESSING OR GENERATION, IN GENERAL
- G06T2207/00—Indexing scheme for image analysis or image enhancement
- G06T2207/30—Subject of image; Context of image processing
- G06T2207/30004—Biomedical image processing
Definitions
- This invention generally relates to ultrasound imaging for the purpose of medical diagnosis.
- the invention relates to methods for imaging tissue and blood flow by detecting ultrasonic echoes reflected from a scanned region of interest in a human body.
- Conventional ultrasound scanners are capable of operating in different imaging modes.
- the B mode two-dimensional images can be generated in which the brightness of each display pixel is derived from the value or amplitude of a respective acoustic data sample representing the echo signal returned from a respective focal position within a scan region.
- an ultrasound transducer array is activated to transmit beams focused at respective focal positions in a scan plane.
- the echo signals detected by the transducer array elements are fed to respective receive channels of a receiver beam-former, which converts the analog signals to digital signals, imparts the proper receive focus time delays and sums the time-delayed digital signals.
- the resulting vector of raw acoustic data samples represents the total ultrasonic energy reflected from a succession of ranges along a receive beam direction.
- two or more receive beams can be acquired following each transmit firing.
- each vector of raw acoustic data samples is envelope detected and the resulting acoustic data is compressed (e.g., using a logarithmic compression curve).
- the compressed acoustic data is output to a scan converter, which transforms the acoustic data format into a video data format suitable for display on a monitor having a conventional array of rows and columns of pixels.
- This video data is referred herein as "raw pixel intensity data”.
- the frames of raw pixel intensity data are mapped to a gray scale for video display.
- Each gray-scale image frame hereinafter referred to as "gray-scale pixel intensity data" is then sent to the video monitor for display.
- a conventional ultrasound imaging system typically employs a variety of gray maps, which are simple transfer functions of raw pixel intensity data to display gray-scale values. Multiple gray maps are supported so that different maps may be used depending on the range of pixel intensities. For example, if a given application tends to generate mainly low raw pixel intensities, then a gray map which dedicates more gray-scale values to low raw pixel intensity values is desired since it improves the contrast across this range. Therefore, it is typical to default to a different gray map depending on the application. However, this is not always effective since the user can scan any anatomy in any application, acoustic data varies from patient to patient, and the raw pixel intensity values depend on other system settings such as dynamic range. Due to these factors, the gray maps tend to be conservative with respect to how many gray-scale values are dedicated to the anticipated primary pixel intensity range.
- a "one-touch" automatic tissue optimization (ATO) method which allows the system user to adjust the contrast by pressing a so-called ATO button on an operator interface.
- ATO button When the user has positioned the probe over the anatomy of interest, depressing an ATO button triggers the host computer inside the ultrasound imaging system to retrieve the current frame of raw pixel intensity data, analyze its pixel intensity histogram within a user-specified region of interest (ROI), and then automatically scale and/or shift the gray mapping (i.e., raw pixel intensity to gray-scale pixel intensity mapping) such that pre-defined "optimal" upper and lower gray-scale levels map to some upper and lower bounds of the pixel intensity histogram respectively.
- the ultimate goal is to more fully utilize the available gray-scale levels (256 levels for an 8-bit display system) to display the pixel intensity data, thereby improving the display tissue contrast.
- a method for automatically optimizing a set of operating parameters in an ultrasound imaging system comprising the steps of: (a) computing a respective pixel intensity histogram for each one of ( N +1) most recent image frames; (b) determining whether a first condition is satisfied, said first condition being that the N -th and ( N +1)-th most recent image frames have pixel intensity histograms which are different to at least a predetermined degree; (c) if said first condition is satisfied, determining whether a second condition is satisfied, said second condition being that the N most recent image frames have pixel intensity histograms which are stabilized; and (d) optimizing a set of operating parameters in response to said first and second conditions being satisfied.
- the set of operating parameters may comprise gray mapping values.
- Gray mapping values may be optimized in dependence on a measured characteristic of at least one stabilized pixel intensity histogram.
- the set of operating parameters may comprise data compression values.
- the set of operating parameters may comprise beam-forming time delays.
- the set of operating parameters may comprise scaling values.
- the method may further comprise the step of comparing pixel intensity histograms using one or more statistical distribution descriptors.
- an ultrasound imaging system comprising: means for computing a respective pixel intensity histogram for each one of ( N +1) most recent image frames; means for determining whether a first condition is satisfied, said first condition being that the N -th and ( N +1)-th most recent image frames have pixel intensity histograms which are different to at least a predetermined degree; means for determining whether a second condition is satisfied, said second condition being that the N most recent image frames have pixel intensity histograms which are stabilized; and means for optimizing a set of operating parameters in response to said first and second conditions being satisfied.
- the set of operating parameters may comprise gray mapping values.
- Gray mapping values may be optimized in dependence on a measured characteristic of at least one stabilized pixel intensity histogram.
- the set of operating parameters may comprise data compression values.
- the present invention is a method and an apparatus for optimizing operating parameters in an ultrasound imaging system in response to the occurrence of predetermined changes in the pixel intensity histogram of successive image frames.
- mapping, compression, scaling or beam-forming parameters can be adjusted based on pixel intensity histogram characteristics determined by the computer.
- the method in accordance with the preferred embodiment comprises the steps of monitoring changes in the pixel intensity histogram of successive image frames, which may be indicative of probe movements, and when appropriate, automatically triggering optimization of the operating parameters.
- the assumptions are as follows: (1) as long as the pixel intensity histogram is changing (the ultrasound probe is moving), the sonographer is doing general looking around; and (2) when the pixel intensity histogram has evolved into a new, stable form for a preset amount of time (the probe is held still again), the sonographer has found something interesting to look at.
- the relevant operating parameters are optimized.
- the compression curve and/or the gray mapping are automatically optimized (e.g., set to values which optimize contrast in the displayed image).
- the beam-forming parameters or the scaling parameters can be automatically adjusted to display an image in a zoom mode.
- the pixel intensity histogram analysis and the optimization of the operating parameters in dependence on the histogram analysis results are performed by the host computer incorporated in the ultrasound imaging system.
- probe motion may not always cause large changes in the pixel intensity histogram, especially if the probe remains in good contact with the skin surface and the underlying tissue characteristics happen to be quite uniform. If the pixel intensity histogram has changed a lot, however, chances are that significant probe motion has occurred.
- the triggering mechanism for image optimization is based on pixel intensity histogram changes and not probe motion per se. In the case of the data compression curve and gray mapping, as long as the pixel intensity histogram remains relatively unchanged, there is no need for re-optimization regardless of probe motion.
- the invention makes ultrasound imaging systems easier to use. Examination times will be shortened due to less downtime spent optimizing the mapping parameters.
- the invention will also facilitate standardization or reproduciblity of exams done by different sonographers. Finally, the invention allows "hands free” scanning during surgical, vascular and other applications where both hands are already busy or sterile.
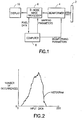
- an ultrasound imaging system comprises a transducer array 2, a beam-former 4, a B-mode image processor 6, a computer 8 and a display monitor 10.
- the transducer array 2 comprises a multiplicity of transducer elements which are activated by a transmitter in beam-former 4 to transmit an ultrasound beam focused at a transmit focal position.
- the return RF signals are detected by the transducer elements and then dynamically focused at successive ranges along a scan line by a receiver in beam-former 4 to form a receive vector of raw acoustic data samples.
- the beam-former output data (I/Q or RF) for each scan line is passed through a B-mode image processor 6, which processes the raw acoustic data into pixel image data in a format suitable for display by the display monitor 10.
- System control is centered in a computer 8, which accepts operator inputs through an operator interface (not shown), analyzes the acquired data and controls the various subsystems based on operator inputs and the results of data analysis.
- the host computer 8 performs one or more of the following functions: (1) providing transmit and beam-forming parameters to the beam-former 4; (2) providing a new gray map to the B-mode image processor 6; (3) retrieving an image frame from memory, re-scaling that image frame and then sending the re-scaled image to the display monitor for display in a zoom mode; and (4) providing a new data compression curve to the B-mode image processor 6.
- the gray map, beam-forming parameters and compression curves are provided in the form of lookup tables stored in random access memory.
- FIG. 1 depicts separate paths for the communications to and from the host computer 8, it will be readily appreciated that these communications may take place over a common channel or system bus.
- the computer is programmed to retrieve successive image frames of raw pixel intensity data from image processor 6 and then compute a respective histogram for each image frame.
- a typical pixel intensity histogram is shown in FIG. 2.
- Computing a histogram involves the steps of dividing the range of possible pixel intensity values into a series of non-overlapping bins of equal length, assigning each pixel intensity value in the image frame to a respective bin having that value, and counting the number of pixels in each bin for that image frame.
- FIG. 2 is a graph of the number of occurrences as a function of pixel intensity values.
- Successive histograms are stored in buffer memory in computer 8. The computer repeatedly compares the current histogram with the preceding histogram.
- the computer automatically re-optimizes the mapping and/or compression parameters and sends those re-optimized parameters to the image processor 6.
- the image processor 6 uses those mapping parameters when it processes subsequent image frames of acoustic data.
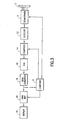
- FIG. 3 shows a signal path of a B-mode ultrasound imaging system.
- the received RF (or its equivalent I/Q pair) data output by the beam-former 4 is envelope detected by detector 12 on a vector-by-vector basis.
- the detected data is compressed in data compression block 14 (which preferably comprises a lookup table loaded by the computer 8 into a random access memory) to reduce the dynamic range for a pixel value (typically 8 bits) display.
- ALM acoustic line memory
- a scan converter 18 transforms the R - ⁇ or X-Y acoustic data format into an X-Y pixel or video data format, thus forming the pixel intensity data.
- the image data to be analyzed is already in X-Y format.
- the pixel intensity data is then mapped into gray-scale values by the gray map 20 for display on monitor 10.
- the gray mapping also comprises a lookup table loaded into random access memory by the computer.
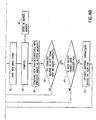
- FIG. 4 shows a flowchart of the steps of the method in accordance with the preferred embodiment.
- a new image frame is read out by the system computer either directly from the X-Y display memory in the scan converter (as shown in FIG. 3) or through a cine memory (not shown in FIG. 3).
- the image pixel intensity histogram within a predefined ROI e.g., a large central ROI within the image frame
- the image pixel intensity histogram within a predefined ROI is computed by counting the number of pixels that fall within each pixel value bin. For an 8-bit pixel display, the smallest pixel value is zero and the largest pixel value is 255.
- the pixel bin size of the pixel intensity histogram can be set larger than unity (e.g., 5).
- the pixel intensity histogram of that new image frame is stored in buffer memory (step 26), which already stores the pixel intensity histograms for previous image frames.
- the next step in the process is to compare the histogram of the new image frame with the histogram of at least one previous image frames (step 28). This can be done using any of the standard statistical distribution descriptors, including the mean, standard deviation, skewness, and kurtosis.
- the p -th percentile point of the pixel intensity histogram is also a useful attribute.
- the 5-th percentile point of the pixel intensity histogram may be very sensitive to image data dropouts (i.e., many pixels become zero) that occur when the probe is lifted off of the skin surface.
- a combination of different histogram descriptors may be used, or even the entire histogram may be used to detect (step 30) when predetermined changes have occurred between the pixel intensity histogram (PIH) of at least one previous image frame and the pixel intensity histogram of the new image frame. If the changes in selected histogram attributes (e.g., the 5-th and 90-th percentile points) have not exceeded some predetermined threshold or thresholds, then the routine returns to step 22 and the process resumes the sequence of steps for the next image frame. If the changes in the selected histogram attributes exceed the predetermined threshold or thresholds, then the image is considered to have changed due to relative motion of the probe and the anatomy of interest. This initiates the next series of steps (starting with step 32 in FIG. 4) aimed at detecting when the image pixel intensity histogram becomes stable again (i.e., probe motion has subsided).
- PHI pixel intensity histogram
- step 32 a new image frame is read out by the system computer.
- the image pixel intensity histogram is within the predefined ROI is again computed (step 34) in the manner previously described with reference to step 24. Again the resulting pixel intensity histogram is stored in buffer memory (step 36). That histogram is then compared with the histogram of the previous image frame in step 38, using any of techniques previously described with reference to step 28. A combination of different histogram descriptors may be used, or even the entire histogram may be used to detect (step 40) when the pixel intensity histogram of the new image frame is stabilized relative to the pixel intensity histogram of the previous image frame with no major dropouts.
- step 30 If the changes in selected histogram attributes (e.g., the 5-th and 90-th percentile points) are not within some predetermined tolerance (preferably different than the threshold used in step 30), then the routine returns to step 32 and the process resumes the following sequence of steps for the next image frame. If the changes in the selected histogram attributes are with the predetermined tolerance, then step 42 is performed to determine whether the probe is not moving.
- some predetermined tolerance preferably different than the threshold used in step 30
- the criterion for triggering an image re-optimization, employed in step 42, is that the N most recent frames all show the same pixel intensity histogram statistics to within some predefined tolerance(s), wherein N is a positive integer greater than 2.
- the value of N may be based on the frame rate and a predefined amount of time (e.g., 2 sec).
- a re-optimization of the gray mapping function is executed.
- the gray map can be scaled/ shifted to map the upper and lower bounds of the pixel intensity histogram to some optimal upper and lower gray levels respectively.
- Such a gray map adjustment is basically known in the art, but will be described later in detail for the sake of completeness.
- mapping function may also include the data compression curve applied to each data vector in block 14 (see FIG. 3). This is typically a logarithmic function. For example, if the 90-th percentile point of the pixel intensity histogram is found to be approaching 255, the image display is likely to be saturated with blooming white pixels. In this case, the input dynamic range of the compression curve may be automatically increased to accommodate the large pixel values before further gray map adjustments are made.
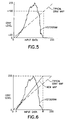
- FIG. 5 shows a raw data histogram (indicated by the jagged solid line) with a typical gray map superimposed thereon (indicated by the dashed line).
- This typical gray map outputs a gray-scale value equal to the input value.
- roughly 171 (20 through 190) gray-scale values out of 256 (0 to 255) are used.
- 67% of the gray-scale values are used.
- the ATO function is designed to provide a more optimal gray mapping in such circumstances.
- the ATO function is automatically activated by the computer in response to detecting a sequence of pixel intensity histograms satisfying the foregoing conditions.
- the gray mapping is re-optimized based upon certain characteristics of one or more pixel intensity histograms.
- the raw pixel intensity data is contrast adjusted by transforming each value into the corresponding gray-scale value established by the re-optimized mapping.
- the raw pixel intensity values outside the new gray map input range are mapped to a minimum (0) or a maximum (255) gray-scale value. As a result, the contrast of the raw pixel intensity data of greatest interest is increased.
- the computer 8 can utilize the last M pixel intensity histogram computed in performing the algorithm shown in FIG. 4, where M is any positive integer.
- the computer can construct a new pixel intensity histogram based on the pixel intensity data of a new image frame.
- the computer determines the end points of the histogram by searching from each direction.
- the range of raw pixel intensity values between the end points is the map input range.
- the computer then compresses (or expands) an existing gray map to fit the new map input range, e.g., the end points 0 and 255 of the gray-scale value range are correlated to the end points of the map input range.
- Each raw pixel intensity value is then assigned a gray-scale value in accordance with this newly generated gray map.
- the search from each end can continue until some percentage of the raw pixel intensity data has been found. If different criteria are used at the lower and higher ends, this enables clipping of the raw pixel intensity data having the lowest and the highest values.
- the end points of the histogram can be established by calculating the standard deviation of the data and finding the end points associated with a particular number of standard deviations. Rather than transforming the old map into the new map using the end points of the new map input range, it is possible to generate an entirely new map between the end points of the new map input range.
- a multiplicity of gray maps can be stored in memory, the computer selecting the most suitable one of the stored maps and sending it to the processor which performs the gray-scale mapping.
- a new gray map can be generated by transforming an old gray map comprising a table of input and output values.
- the old map is a linear function (indicated by the dashed line in FIG. 6)
- the new map will also be a linear function (indicated by the straight solid line in FIG. 6).
- the old map is a nonlinear function
- the new map generated from the old map will also be a nonlinear function.
- a map transformation algorithm is used to compress (or expand) that nonlinear function to fit within the new map input range, e.g., the range from A to B in FIG. 6.
- each input value x new of the new map is processed to arrive at a corresponding new map output value y new .
- the new map output value y new is obtained by inputting the index l into the old gray map to obtain the corresponding old map output value. The latter value is then transferred into the new map. This process is repeated until output values for all of the new map input values between the end values A and B have been derived from the old map. Using this technique, the old map can be compressed (or expanded) to fit within the new map input range determined from the raw data histogram.
- the search from each end can continue until some percentage of raw data is found. If different criteria are used at the lower and higher ends, this enables clipping of, for example, the lowest 5% of raw data and the highest 0.3% of raw data.
- This technique can be applied in the transformation of an old gray map (using the map transformation algorithm described above) or in the creation of a new gray map.
- the end points can be established by calculating the standard deviation of the raw data and then finding the end points associated with a particular number of standard deviations. There is no restriction that the same criteria be used at each end.
- the data compression curve is automatically optimized (e.g., set to values which optimize contrast in the displayed image). This is preferably accomplished by writing a new data compression lookup table into random access memory in the data compression block.
- the host computer may select a suitable data compression lookup table from a multiplicity of pre-stored tables or may generate a new data compression lookup table.
- the data compression curve can be optimized by itself or in combination with optimization of the gray-scale mapping function.
- the invention is not limited, however, to optimization of mapping or data compression parameters in response to detection of probe movement followed by probe stabilization.
- the imaging mode can also be controlled in this manner. For example, a zoom mode can be initiated whenever the pixel intensity histograms indicate that the probe has stabilized. Stabilization is presumed to mean that the sonographer has found an anatomical region of interest.
- the host computer will adapt the transmit parameters so that a region of interest reduced in size is scanned, for example, by increasing the vector density and/or by increasing the number of transmit focal zones per unit depth within the region of interest and not scanning outside the region of interest.
- the computer may be programmed to automatically return the system to a non-zoom mode when probe movement is resumed.
- the zooming effect can be achieved by scaling a region of interest in an image frame.
- ( N +1) most recent image frames means ( N +1) image frames acquired successively in time, the oldest image frame being the ( N +1)-th most recent image frame and the newest image frame being the first most recent image frame.
Description
- This invention generally relates to ultrasound imaging for the purpose of medical diagnosis. In particular, the invention relates to methods for imaging tissue and blood flow by detecting ultrasonic echoes reflected from a scanned region of interest in a human body.
- Conventional ultrasound scanners are capable of operating in different imaging modes. In the B mode, two-dimensional images can be generated in which the brightness of each display pixel is derived from the value or amplitude of a respective acoustic data sample representing the echo signal returned from a respective focal position within a scan region.
- In the B-mode imaging, an ultrasound transducer array is activated to transmit beams focused at respective focal positions in a scan plane. After each transmit firing, the echo signals detected by the transducer array elements are fed to respective receive channels of a receiver beam-former, which converts the analog signals to digital signals, imparts the proper receive focus time delays and sums the time-delayed digital signals. For each transmit firing, the resulting vector of raw acoustic data samples represents the total ultrasonic energy reflected from a succession of ranges along a receive beam direction. Alternatively, in multi-line acquisition two or more receive beams can be acquired following each transmit firing.
- In conventional B-mode imaging, each vector of raw acoustic data samples is envelope detected and the resulting acoustic data is compressed (e.g., using a logarithmic compression curve). The compressed acoustic data is output to a scan converter, which transforms the acoustic data format into a video data format suitable for display on a monitor having a conventional array of rows and columns of pixels. This video data is referred herein as "raw pixel intensity data". The frames of raw pixel intensity data are mapped to a gray scale for video display. Each gray-scale image frame, hereinafter referred to as "gray-scale pixel intensity data", is then sent to the video monitor for display.
- A conventional ultrasound imaging system typically employs a variety of gray maps, which are simple transfer functions of raw pixel intensity data to display gray-scale values. Multiple gray maps are supported so that different maps may be used depending on the range of pixel intensities. For example, if a given application tends to generate mainly low raw pixel intensities, then a gray map which dedicates more gray-scale values to low raw pixel intensity values is desired since it improves the contrast across this range. Therefore, it is typical to default to a different gray map depending on the application. However, this is not always effective since the user can scan any anatomy in any application, acoustic data varies from patient to patient, and the raw pixel intensity values depend on other system settings such as dynamic range. Due to these factors, the gray maps tend to be conservative with respect to how many gray-scale values are dedicated to the anticipated primary pixel intensity range.
- A "one-touch" automatic tissue optimization (ATO) method is known which allows the system user to adjust the contrast by pressing a so-called ATO button on an operator interface. When the user has positioned the probe over the anatomy of interest, depressing an ATO button triggers the host computer inside the ultrasound imaging system to retrieve the current frame of raw pixel intensity data, analyze its pixel intensity histogram within a user-specified region of interest (ROI), and then automatically scale and/or shift the gray mapping (i.e., raw pixel intensity to gray-scale pixel intensity mapping) such that pre-defined "optimal" upper and lower gray-scale levels map to some upper and lower bounds of the pixel intensity histogram respectively. The ultimate goal is to more fully utilize the available gray-scale levels (256 levels for an 8-bit display system) to display the pixel intensity data, thereby improving the display tissue contrast.
- In the one-touch ATO approach, however, if the probe or ROI is moved to another location, the user is required to press the ATO button again to re-optimize the gray mapping based on the new tissue data. A more fully automated version of this feature is desirable because during a clinical exam, the sonographer often needs to move the probe around a lot to find or study multiple anatomical features, and in many clinical applications such as vascular and surgical applications, both of the sonographer's hands are already busy or sterilized.
- According to a first aspect of the invention, there is provided a method for automatically optimizing a set of operating parameters in an ultrasound imaging system, comprising the steps of: (a) computing a respective pixel intensity histogram for each one of (N+1) most recent image frames; (b) determining whether a first condition is satisfied, said first condition being that the N-th and (N+1)-th most recent image frames have pixel intensity histograms which are different to at least a predetermined degree; (c) if said first condition is satisfied, determining whether a second condition is satisfied, said second condition being that the N most recent image frames have pixel intensity histograms which are stabilized; and (d) optimizing a set of operating parameters in response to said first and second conditions being satisfied.
- The set of operating parameters may comprise gray mapping values.
- Gray mapping values may be optimized in dependence on a measured characteristic of at least one stabilized pixel intensity histogram.
- The set of operating parameters may comprise data compression values.
- The set of operating parameters may comprise beam-forming time delays.
- The set of operating parameters may comprise scaling values.
- The method may further comprise the step of comparing pixel intensity histograms using one or more statistical distribution descriptors.
- According to a second aspect of the invention, there is provided an ultrasound imaging system comprising: means for computing a respective pixel intensity histogram for each one of (N+1) most recent image frames; means for determining whether a first condition is satisfied, said first condition being that the N-th and (N +1)-th most recent image frames have pixel intensity histograms which are different to at least a predetermined degree; means for determining whether a second condition is satisfied, said second condition being that the N most recent image frames have pixel intensity histograms which are stabilized; and means for optimizing a set of operating parameters in response to said first and second conditions being satisfied.
- The set of operating parameters may comprise gray mapping values.
- Gray mapping values may be optimized in dependence on a measured characteristic of at least one stabilized pixel intensity histogram.
- The set of operating parameters may comprise data compression values.
- Thus, the present invention is a method and an apparatus for optimizing operating parameters in an ultrasound imaging system in response to the occurrence of predetermined changes in the pixel intensity histogram of successive image frames. In the course of optimization, mapping, compression, scaling or beam-forming parameters can be adjusted based on pixel intensity histogram characteristics determined by the computer.
- The method in accordance with the preferred embodiment comprises the steps of monitoring changes in the pixel intensity histogram of successive image frames, which may be indicative of probe movements, and when appropriate, automatically triggering optimization of the operating parameters. The assumptions are as follows: (1) as long as the pixel intensity histogram is changing (the ultrasound probe is moving), the sonographer is doing general looking around; and (2) when the pixel intensity histogram has evolved into a new, stable form for a preset amount of time (the probe is held still again), the sonographer has found something interesting to look at. In response to satisfaction of these two conditions, the relevant operating parameters are optimized. In accordance with one preferred embodiment, the compression curve and/or the gray mapping are automatically optimized (e.g., set to values which optimize contrast in the displayed image). In accordance with other preferred embodiments, the beam-forming parameters or the scaling parameters can be automatically adjusted to display an image in a zoom mode. In accordance with the preferred embodiments, the pixel intensity histogram analysis and the optimization of the operating parameters in dependence on the histogram analysis results are performed by the host computer incorporated in the ultrasound imaging system.
- It should be noted that in practice, probe motion may not always cause large changes in the pixel intensity histogram, especially if the probe remains in good contact with the skin surface and the underlying tissue characteristics happen to be quite uniform. If the pixel intensity histogram has changed a lot, however, chances are that significant probe motion has occurred. Thus, the triggering mechanism for image optimization is based on pixel intensity histogram changes and not probe motion per se. In the case of the data compression curve and gray mapping, as long as the pixel intensity histogram remains relatively unchanged, there is no need for re-optimization regardless of probe motion.
- The invention makes ultrasound imaging systems easier to use. Examination times will be shortened due to less downtime spent optimizing the mapping parameters. The invention will also facilitate standardization or reproduciblity of exams done by different sonographers. Finally, the invention allows "hands free" scanning during surgical, vascular and other applications where both hands are already busy or sterile.
- The invention will now be described in greater detail, by way of example, with reference to the drawings, in which:-
- FIG. 1 is a block diagram generally showing an ultrasound imaging system.
- FIG. 2 is a graph representing a pixel intensity histogram, the pixel intensity values being plotted along the horizontal axis and the number of occurrences within each bin being plotted along the vertical axis.
- FIG. 3 is a block diagram showing in greater detail an ultrasound imaging system.
- FIG. 4 is a flowchart showing the steps of a dynamic image optimizing algorithm in accordance with the preferred embodiment of the invention.
- FIG. 5 is a graph showing a conventional gray map superimposed on the pixel intensity histogram of FIG. 2.
- FIG. 6 is a graph showing an adaptively generated gray map superimposed on the same pixel intensity histogram.
-
- Referring to FIG. 1, an ultrasound imaging system comprises a
transducer array 2, a beam-former 4, a B-mode image processor 6, acomputer 8 and adisplay monitor 10. Thetransducer array 2 comprises a multiplicity of transducer elements which are activated by a transmitter in beam-former 4 to transmit an ultrasound beam focused at a transmit focal position. The return RF signals are detected by the transducer elements and then dynamically focused at successive ranges along a scan line by a receiver in beam-former 4 to form a receive vector of raw acoustic data samples. The beam-former output data (I/Q or RF) for each scan line is passed through a B-mode image processor 6, which processes the raw acoustic data into pixel image data in a format suitable for display by thedisplay monitor 10. - System control is centered in a
computer 8, which accepts operator inputs through an operator interface (not shown), analyzes the acquired data and controls the various subsystems based on operator inputs and the results of data analysis. In accordance with the preferred embodiments, thehost computer 8 performs one or more of the following functions: (1) providing transmit and beam-forming parameters to the beam-former 4; (2) providing a new gray map to the B-mode image processor 6; (3) retrieving an image frame from memory, re-scaling that image frame and then sending the re-scaled image to the display monitor for display in a zoom mode; and (4) providing a new data compression curve to the B-mode image processor 6. Preferably, the gray map, beam-forming parameters and compression curves are provided in the form of lookup tables stored in random access memory. Although FIG. 1 depicts separate paths for the communications to and from thehost computer 8, it will be readily appreciated that these communications may take place over a common channel or system bus. - The computer is programmed to retrieve successive image frames of raw pixel intensity data from
image processor 6 and then compute a respective histogram for each image frame. A typical pixel intensity histogram is shown in FIG. 2. Computing a histogram involves the steps of dividing the range of possible pixel intensity values into a series of non-overlapping bins of equal length, assigning each pixel intensity value in the image frame to a respective bin having that value, and counting the number of pixels in each bin for that image frame. FIG. 2 is a graph of the number of occurrences as a function of pixel intensity values. Successive histograms are stored in buffer memory incomputer 8. The computer repeatedly compares the current histogram with the preceding histogram. If there is a large change from one histogram to the next, followed by a predetermined number of image frames showing a stabilized pixel intensity histogram, then the computer automatically re-optimizes the mapping and/or compression parameters and sends those re-optimized parameters to theimage processor 6. Theimage processor 6 then uses those mapping parameters when it processes subsequent image frames of acoustic data. - Another embodiment is shown in FIG. 3, which shows a signal path of a B-mode ultrasound imaging system. The received RF (or its equivalent I/Q pair) data output by the beam-former 4 is envelope detected by
detector 12 on a vector-by-vector basis. Then the detected data is compressed in data compression block 14 (which preferably comprises a lookup table loaded by thecomputer 8 into a random access memory) to reduce the dynamic range for a pixel value (typically 8 bits) display. An acoustic line memory (ALM) 16 accumulates vectors of compressed acoustic data for one sweep across the array, to form a two-dimensional image. Ascan converter 18 transforms the R- or X-Y acoustic data format into an X-Y pixel or video data format, thus forming the pixel intensity data. In the preferred embodiment, the image data to be analyzed is already in X-Y format. The pixel intensity data is then mapped into gray-scale values by thegray map 20 for display onmonitor 10. Preferably the gray mapping also comprises a lookup table loaded into random access memory by the computer. - FIG. 4 shows a flowchart of the steps of the method in accordance with the preferred embodiment. In the
first step 22, a new image frame is read out by the system computer either directly from the X-Y display memory in the scan converter (as shown in FIG. 3) or through a cine memory (not shown in FIG. 3). In thesecond step 24, the image pixel intensity histogram within a predefined ROI (e.g., a large central ROI within the image frame) is computed by counting the number of pixels that fall within each pixel value bin. For an 8-bit pixel display, the smallest pixel value is zero and the largest pixel value is 255. To reduce statistical variability, the pixel bin size of the pixel intensity histogram can be set larger than unity (e.g., 5). The pixel intensity histogram of that new image frame is stored in buffer memory (step 26), which already stores the pixel intensity histograms for previous image frames. - The next step in the process is to compare the histogram of the new image frame with the histogram of at least one previous image frames (step 28). This can be done using any of the standard statistical distribution descriptors, including the mean, standard deviation, skewness, and kurtosis. The p-th percentile point of the pixel intensity histogram is also a useful attribute. For example, the 5-th percentile point of the pixel intensity histogram may be very sensitive to image data dropouts (i.e., many pixels become zero) that occur when the probe is lifted off of the skin surface. In general, a combination of different histogram descriptors may be used, or even the entire histogram may be used to detect (step 30) when predetermined changes have occurred between the pixel intensity histogram (PIH) of at least one previous image frame and the pixel intensity histogram of the new image frame. If the changes in selected histogram attributes (e.g., the 5-th and 90-th percentile points) have not exceeded some predetermined threshold or thresholds, then the routine returns to step 22 and the process resumes the sequence of steps for the next image frame. If the changes in the selected histogram attributes exceed the predetermined threshold or thresholds, then the image is considered to have changed due to relative motion of the probe and the anatomy of interest. This initiates the next series of steps (starting with
step 32 in FIG. 4) aimed at detecting when the image pixel intensity histogram becomes stable again (i.e., probe motion has subsided). - In
step 32, a new image frame is read out by the system computer. The image pixel intensity histogram is within the predefined ROI is again computed (step 34) in the manner previously described with reference to step 24. Again the resulting pixel intensity histogram is stored in buffer memory (step 36). That histogram is then compared with the histogram of the previous image frame instep 38, using any of techniques previously described with reference to step 28. A combination of different histogram descriptors may be used, or even the entire histogram may be used to detect (step 40) when the pixel intensity histogram of the new image frame is stabilized relative to the pixel intensity histogram of the previous image frame with no major dropouts. If the changes in selected histogram attributes (e.g., the 5-th and 90-th percentile points) are not within some predetermined tolerance (preferably different than the threshold used in step 30), then the routine returns to step 32 and the process resumes the following sequence of steps for the next image frame. If the changes in the selected histogram attributes are with the predetermined tolerance, then step 42 is performed to determine whether the probe is not moving. - The criterion for triggering an image re-optimization, employed in
step 42, is that the N most recent frames all show the same pixel intensity histogram statistics to within some predefined tolerance(s), wherein N is a positive integer greater than 2. The value of N may be based on the frame rate and a predefined amount of time (e.g., 2 sec). If the stability criterion is met, a re-optimization of the gray mapping function is executed. For example, the gray map can be scaled/ shifted to map the upper and lower bounds of the pixel intensity histogram to some optimal upper and lower gray levels respectively. Such a gray map adjustment is basically known in the art, but will be described later in detail for the sake of completeness. - In addition, the mapping function may also include the data compression curve applied to each data vector in block 14 (see FIG. 3). This is typically a logarithmic function. For example, if the 90-th percentile point of the pixel intensity histogram is found to be approaching 255, the image display is likely to be saturated with blooming white pixels. In this case, the input dynamic range of the compression curve may be automatically increased to accommodate the large pixel values before further gray map adjustments are made.
- FIG. 5 shows a raw data histogram (indicated by the jagged solid line) with a typical gray map superimposed thereon (indicated by the dashed line). This typical gray map outputs a gray-scale value equal to the input value. Given the raw data and the gray map shown in FIG. 5, roughly 171 (20 through 190) gray-scale values out of 256 (0 to 255) are used. For this example, 67% of the gray-scale values are used. The ATO function is designed to provide a more optimal gray mapping in such circumstances.
- In accordance with the preferred embodiment, the ATO function is automatically activated by the computer in response to detecting a sequence of pixel intensity histograms satisfying the foregoing conditions. When ATO is enabled, the gray mapping is re-optimized based upon certain characteristics of one or more pixel intensity histograms. Then the raw pixel intensity data is contrast adjusted by transforming each value into the corresponding gray-scale value established by the re-optimized mapping. The raw pixel intensity values outside the new gray map input range are mapped to a minimum (0) or a maximum (255) gray-scale value. As a result, the contrast of the raw pixel intensity data of greatest interest is increased.
- To accomplish the foregoing, the
computer 8 can utilize the last M pixel intensity histogram computed in performing the algorithm shown in FIG. 4, where M is any positive integer. Alternatively, the computer can construct a new pixel intensity histogram based on the pixel intensity data of a new image frame. The computer then determines the end points of the histogram by searching from each direction. The range of raw pixel intensity values between the end points is the map input range. The computer then compresses (or expands) an existing gray map to fit the new map input range, e.g., theend points - As stated above, a new gray map can be generated by transforming an old gray map comprising a table of input and output values. In the case where the old map is a linear function (indicated by the dashed line in FIG. 6), the new map will also be a linear function (indicated by the straight solid line in FIG. 6). Alternatively, if the old map is a nonlinear function, then the new map generated from the old map will also be a nonlinear function. For example, if the old gray map is a nonlinear function, a map transformation algorithm is used to compress (or expand) that nonlinear function to fit within the new map input range, e.g., the range from A to B in FIG. 6.
- More specifically, each input value x new of the new map is processed to arrive at a corresponding new map output value y new. The computer performs the following steps.
- Rather than searching for the absolute end (first non-zero input bin) from each direction, the search from each end can continue until some percentage of raw data is found. If different criteria are used at the lower and higher ends, this enables clipping of, for example, the lowest 5% of raw data and the highest 0.3% of raw data. This technique can be applied in the transformation of an old gray map (using the map transformation algorithm described above) or in the creation of a new gray map.
- Alternatively, the end points can be established by calculating the standard deviation of the raw data and then finding the end points associated with a particular number of standard deviations. There is no restriction that the same criteria be used at each end.
- Although the preferred embodiments have been described with reference to gray map generation by a host computer, it will be appreciated by persons skilled in the art that, in the alternative, the new gray map could be generated by dedicated hardware.
- In accordance with another preferred embodiment, the data compression curve is automatically optimized (e.g., set to values which optimize contrast in the displayed image). This is preferably accomplished by writing a new data compression lookup table into random access memory in the data compression block. The host computer may select a suitable data compression lookup table from a multiplicity of pre-stored tables or may generate a new data compression lookup table. The data compression curve can be optimized by itself or in combination with optimization of the gray-scale mapping function.
- The invention is not limited, however, to optimization of mapping or data compression parameters in response to detection of probe movement followed by probe stabilization. The imaging mode can also be controlled in this manner. For example, a zoom mode can be initiated whenever the pixel intensity histograms indicate that the probe has stabilized. Stabilization is presumed to mean that the sonographer has found an anatomical region of interest. In response to detection of probe stabilization, the host computer will adapt the transmit parameters so that a region of interest reduced in size is scanned, for example, by increasing the vector density and/or by increasing the number of transmit focal zones per unit depth within the region of interest and not scanning outside the region of interest. The computer may be programmed to automatically return the system to a non-zoom mode when probe movement is resumed. Alternatively, the zooming effect can be achieved by scaling a region of interest in an image frame.
- As used in the claims, the term "(N+1) most recent image frames" means (N+1) image frames acquired successively in time, the oldest image frame being the (N+1)-th most recent image frame and the newest image frame being the first most recent image frame.
Claims (9)
- The method for automatically optimizing a set of operating parameters in an ultrasound imaging system, comprising the steps of:a) computing a respective pixel intensity histogram for each one of (N+1) most recent image frames;b) determining whether a first condition is satisfied, said first condition being that the N-th and (N+1)-th most recent image frames have pixel intensity histograms which are different to at least a predetermined degree;c) if said first condition is satisfied, determining whether a second condition is satisfied, said second condition being that the N most recent image frames have pixel intensity histogram statistics which are within a predetermined tolerance; and(d) optimizing a set of operating parameters in response to said first and second conditions being satisfied.
- The method as recited in claim 1, wherein said set of operating parameters comprise gray mapping values.
- The method as recited in claim 2, wherein gray mapping values are optimized in dependence on a measured characteristic of at least one pixel intensity histogram having histogram statistics within the predetermined tolerance.
- The method as recited in claim 1, further comprising the step of comparing pixel intensity histograms using one or more statistical distribution descriptors.
- The method as recited in claim 1, wherein said set of operating parameters comprise one of data compression values, beamforming time delays and scaling values.
- An ultrasound imaging system comprising:means adapted to compute a respective pixel intensity histogram for each one of (N +1) most recent image frames;means adapted to determine whether a first condition is satisfied, said first condition being that the N-th and (N+1)-th most recent image frames have pixel intensity histograms which are different to at least a predetermined degree;means adapted to determine whether a second condition is satisfied, said second condition being that the N most recent image frames have pixel intensity histogram statistics which are within a predetermined tolerance; andmeans adapted to optimize a set of operating parameters in response to said first and second conditions being satisfied.
- The system as recited in claim 6, wherein said set of operating parameters comprise gray mapping values.
- The system as recited in claim 7, wherein gray mapping values are optimized in dependence on a measured characteristic of at least one pixel intensity histogram having statistics within the predetermined tolerance.
- The system as recited in claim 6, wherein said set of operating parameters comprise one of data compression values, beamforming time delays and scaling values.
Applications Claiming Priority (2)
| Application Number | Priority Date | Filing Date | Title |
|---|---|---|---|
| US434817 | 1999-11-05 | ||
| US09/434,817 US6542626B1 (en) | 1999-11-05 | 1999-11-05 | Method and apparatus for adapting imaging system operation based on pixel intensity histogram |
Publications (3)
| Publication Number | Publication Date |
|---|---|
| EP1097674A2 EP1097674A2 (en) | 2001-05-09 |
| EP1097674A3 EP1097674A3 (en) | 2001-07-18 |
| EP1097674B1 true EP1097674B1 (en) | 2005-08-31 |
Family
ID=23725824
Family Applications (1)
| Application Number | Title | Priority Date | Filing Date |
|---|---|---|---|
| EP00309775A Expired - Lifetime EP1097674B1 (en) | 1999-11-05 | 2000-11-03 | Method and apparatus for adapting imaging system operation based on pixel intensity histogram |
Country Status (6)
| Country | Link |
|---|---|
| US (1) | US6542626B1 (en) |
| EP (1) | EP1097674B1 (en) |
| JP (1) | JP4727031B2 (en) |
| KR (1) | KR100737040B1 (en) |
| DE (1) | DE60022292T2 (en) |
| IL (1) | IL139223A0 (en) |
Cited By (1)
| Publication number | Priority date | Publication date | Assignee | Title |
|---|---|---|---|---|
| WO2016176855A1 (en) * | 2015-05-07 | 2016-11-10 | 深圳迈瑞生物医疗电子股份有限公司 | Blood flow imaging method and system |
Families Citing this family (38)
| Publication number | Priority date | Publication date | Assignee | Title |
|---|---|---|---|---|
| KR100392094B1 (en) * | 2001-09-11 | 2003-07-22 | 주식회사 메디슨 | System for automatically optimizing input ultrasound image |
| DE10201520A1 (en) * | 2002-01-17 | 2003-07-31 | Bosch Gmbh Robert | Method and device for image error detection or display in image recording systems |
| CA2476072A1 (en) * | 2002-02-13 | 2003-09-18 | Reify Corporation | Method and apparatus for acquisition, compression, and characterization of spatiotemporal signals |
| WO2004072676A1 (en) * | 2003-02-13 | 2004-08-26 | Koninklijke Philips Electronics N.V. | Flow spectrograms synthesized from ultrasonic flow color doppler information |
| US7658714B2 (en) * | 2003-10-31 | 2010-02-09 | Siemens Medical Solutions Usa, Inc. | Intelligent ultrasound examination storage system |
| US7101336B2 (en) * | 2003-11-25 | 2006-09-05 | General Electric Company | Methods and systems for motion adaptive spatial compounding |
| US7620248B2 (en) * | 2004-11-19 | 2009-11-17 | Microsoft Corporation | System and method for validating graphical components of images |
| US7477785B2 (en) * | 2004-11-19 | 2009-01-13 | Microsoft Corporation | Fuzzy image comparator |
| US7778450B2 (en) * | 2005-01-20 | 2010-08-17 | Scimed Life Systems, Inc. | Pattern recognition systems and methods |
| US8409103B2 (en) * | 2005-05-06 | 2013-04-02 | Vasonova, Inc. | Ultrasound methods of positioning guided vascular access devices in the venous system |
| US20090118612A1 (en) | 2005-05-06 | 2009-05-07 | Sorin Grunwald | Apparatus and Method for Vascular Access |
| EP1748378B1 (en) * | 2005-07-26 | 2009-09-16 | Canon Kabushiki Kaisha | Image capturing apparatus and image capturing method |
| KR100863745B1 (en) * | 2005-08-18 | 2008-10-16 | 주식회사 메디슨 | Apparatus and method for processing an ultrasound image in an ultrasound image diagnostic system |
| WO2007072362A2 (en) * | 2005-12-19 | 2007-06-28 | Koninklijke Philips Electronics, N.V. | Automatic ultrasound scanning initiated by protocol stage |
| US20080242988A1 (en) * | 2007-03-28 | 2008-10-02 | Tetsuya Yoshida | Ultrasound diagnostic apparatus, ultrasound image processing apparatus, and ultrasound image processing method |
| WO2009003138A1 (en) | 2007-06-26 | 2008-12-31 | Vasonova, Inc. | Apparatus and method for endovascular device guiding and positioning using physiological parameters |
| US20090123068A1 (en) * | 2007-11-13 | 2009-05-14 | Himax Technologies Limited | Method for adaptively adjusting image and image processing apparatus using the same |
| JP5575370B2 (en) * | 2008-02-18 | 2014-08-20 | 株式会社東芝 | Ultrasonic diagnostic equipment |
| CN102123667B (en) * | 2008-08-19 | 2013-05-22 | 松下电器产业株式会社 | Ultrasonographic device |
| KR101083936B1 (en) * | 2008-09-26 | 2011-11-15 | 삼성메디슨 주식회사 | Apparatus and method for processing ultrasound data |
| KR101009782B1 (en) * | 2008-10-28 | 2011-01-19 | (주)메디슨 | Ultrasound system and method providing wide image mode |
| FR2949658B1 (en) * | 2009-09-07 | 2012-07-27 | Salim Mimouni | OPTICAL PLETHYSMOGRAPHIC SIGNAL CAPTURE DEVICE USING MATRIX IMAGER |
| KR101120806B1 (en) | 2010-10-21 | 2012-03-22 | 삼성메디슨 주식회사 | Ultrasound system and method for correcting dropout of elastic image |
| EP2637568B1 (en) | 2010-11-08 | 2017-04-12 | Vasonova, Inc. | Endovascular navigation system |
| CN102883101A (en) * | 2011-07-15 | 2013-01-16 | 华晶科技股份有限公司 | Image processing device and method |
| TWI472224B (en) * | 2011-07-15 | 2015-02-01 | Altek Corp | Image processing device and image processing method thereof |
| EP2846686B1 (en) | 2012-05-07 | 2018-01-03 | Vasonova, Inc. | System for detection of the superior vena cava area and the cavoatrial junction |
| US9453908B2 (en) * | 2012-06-12 | 2016-09-27 | University Of Rochester | Superresolution imaging of scatterers in pulse-echo imaging |
| JP5981246B2 (en) * | 2012-06-29 | 2016-08-31 | 東芝メディカルシステムズ株式会社 | Ultrasonic diagnostic device and sensor selection device |
| JP6025456B2 (en) * | 2012-08-28 | 2016-11-16 | キヤノン株式会社 | Subject information acquisition apparatus, display method, and program |
| KR101980537B1 (en) | 2013-07-11 | 2019-05-22 | 삼성전자주식회사 | imaging processing unit, ultrasonic imaging apparatus and image processing method |
| JP5999124B2 (en) * | 2014-02-27 | 2016-09-28 | ブラザー工業株式会社 | Control device, head mounted display, and program |
| EP3257023B1 (en) | 2015-06-23 | 2020-09-30 | Hewlett-Packard Development Company, L.P. | Image histogram compression end point pair selection based on a target color space range |
| CN108209966B (en) * | 2017-12-29 | 2021-02-12 | 深圳开立生物医疗科技股份有限公司 | Parameter adjusting method and device of ultrasonic imaging equipment |
| US10664977B2 (en) * | 2018-02-28 | 2020-05-26 | General Electric Company | Apparatus and method for image-based control of imaging system parameters |
| CN110189266B (en) * | 2019-05-09 | 2023-01-03 | 湖北工业大学 | Self-adaptive rapid image enhancement method |
| US11308609B2 (en) | 2019-12-04 | 2022-04-19 | GE Precision Healthcare LLC | System and methods for sequential scan parameter selection |
| US11488298B2 (en) | 2019-12-20 | 2022-11-01 | GE Precision Healthcare LLC | System and methods for ultrasound image quality determination |
Family Cites Families (20)
| Publication number | Priority date | Publication date | Assignee | Title |
|---|---|---|---|---|
| US5042077A (en) | 1987-10-02 | 1991-08-20 | General Electric Company | Method of highlighting subtle contrast in graphical images |
| US5224177A (en) * | 1991-10-31 | 1993-06-29 | The University Of Chicago | High quality film image correction and duplication method and system |
| JPH05146446A (en) * | 1991-11-28 | 1993-06-15 | Aloka Co Ltd | Ultrasonic picture processor |
| US5313948A (en) | 1991-11-28 | 1994-05-24 | Aloka Co., Ltd. | Ultrasonic diagnostic apparatus |
| JP2678122B2 (en) * | 1992-09-29 | 1997-11-17 | アロカ株式会社 | Ultrasound diagnostic equipment |
| JP2648771B2 (en) * | 1992-03-09 | 1997-09-03 | アロカ 株式会社 | Ultrasound image processing device |
| US5594807A (en) * | 1994-12-22 | 1997-01-14 | Siemens Medical Systems, Inc. | System and method for adaptive filtering of images based on similarity between histograms |
| US5790690A (en) * | 1995-04-25 | 1998-08-04 | Arch Development Corporation | Computer-aided method for automated image feature analysis and diagnosis of medical images |
| JPH08331504A (en) * | 1995-06-01 | 1996-12-13 | Matsushita Electric Ind Co Ltd | Dynamic image processing unit and dynamic image reproducing device |
| US5662113A (en) * | 1995-06-30 | 1997-09-02 | Siemens Medical Systems, Inc | Edge enhancement system for ultrasound images |
| JPH0975348A (en) | 1995-09-12 | 1997-03-25 | Toshiba Corp | Ultrasonic diagnostic equipment |
| US5793883A (en) | 1995-09-29 | 1998-08-11 | Siemens Medical Systems, Inc. | Method for enhancing ultrasound image |
| US6463173B1 (en) | 1995-10-30 | 2002-10-08 | Hewlett-Packard Company | System and method for histogram-based image contrast enhancement |
| JP3784109B2 (en) * | 1996-07-08 | 2006-06-07 | 株式会社日立メディコ | Ultrasound imaging device |
| US5954653A (en) * | 1997-05-07 | 1999-09-21 | General Electric Company | Method and apparatus for automatically enhancing contrast in projected ultrasound image |
| US6048311A (en) * | 1997-05-07 | 2000-04-11 | Washburn; Michael J. | Method and apparatus for ultrasound imaging using adaptive gray mapping |
| JPH11325196A (en) * | 1998-04-17 | 1999-11-26 | Mannesmann Ag | Drive unit |
| US6238341B1 (en) * | 1998-12-28 | 2001-05-29 | General Electric Company | Ultrasound probe having integrated user-operable function switch |
| US6126605A (en) * | 1998-12-31 | 2000-10-03 | General Electric Company | Ultrasound color flow display optimization by adjusting dynamic range |
| US6322505B1 (en) * | 1999-06-08 | 2001-11-27 | Acuson Corporation | Medical diagnostic ultrasound system and method for post processing |
-
1999
- 1999-11-05 US US09/434,817 patent/US6542626B1/en not_active Expired - Lifetime
-
2000
- 2000-10-23 IL IL13922300A patent/IL139223A0/en unknown
- 2000-11-02 JP JP2000335304A patent/JP4727031B2/en not_active Expired - Fee Related
- 2000-11-03 EP EP00309775A patent/EP1097674B1/en not_active Expired - Lifetime
- 2000-11-03 KR KR1020000065210A patent/KR100737040B1/en not_active IP Right Cessation
- 2000-11-03 DE DE60022292T patent/DE60022292T2/en not_active Expired - Fee Related
Cited By (1)
| Publication number | Priority date | Publication date | Assignee | Title |
|---|---|---|---|---|
| WO2016176855A1 (en) * | 2015-05-07 | 2016-11-10 | 深圳迈瑞生物医疗电子股份有限公司 | Blood flow imaging method and system |
Also Published As
| Publication number | Publication date |
|---|---|
| IL139223A0 (en) | 2001-11-25 |
| JP4727031B2 (en) | 2011-07-20 |
| DE60022292T2 (en) | 2006-06-29 |
| DE60022292D1 (en) | 2005-10-06 |
| KR100737040B1 (en) | 2007-07-09 |
| KR20010060252A (en) | 2001-07-06 |
| JP2001187057A (en) | 2001-07-10 |
| US6542626B1 (en) | 2003-04-01 |
| EP1097674A2 (en) | 2001-05-09 |
| EP1097674A3 (en) | 2001-07-18 |
Similar Documents
| Publication | Publication Date | Title |
|---|---|---|
| EP1097674B1 (en) | Method and apparatus for adapting imaging system operation based on pixel intensity histogram | |
| US6579239B1 (en) | System and method for automatic adjustment of brightness and contrast in images | |
| KR100748858B1 (en) | Image processing system and method for improving quality of images | |
| US7062714B1 (en) | Imaging system having preset processing parameters adapted to user preferences | |
| US6102859A (en) | Method and apparatus for automatic time and/or lateral gain compensation in B-mode ultrasound imaging | |
| US6346079B1 (en) | Method and apparatus for adaptive frame-rate adjustment in ultrasound imaging system | |
| JP5645628B2 (en) | Ultrasonic diagnostic equipment | |
| US6162176A (en) | Ultrasound color flow display optimization | |
| EP0952458B1 (en) | Method and apparatus for ultrasound imaging using adaptive gray mapping | |
| JPH10155795A (en) | Ultrasonic image forming system to facilitate tissue identification and method therefor | |
| EP1990009A1 (en) | Ultrasonic diagnostic equipment | |
| US11666310B2 (en) | Ultrasound diagnostic apparatus and method for controlling ultrasound diagnostic apparatus using predetermined imaging conditions for B-mode image generation | |
| US20150359507A1 (en) | Ultrasound diagnosis apparatus and ultrasound image processing method | |
| KR100863745B1 (en) | Apparatus and method for processing an ultrasound image in an ultrasound image diagnostic system | |
| JP4831538B2 (en) | Method for presenting multiple enhanced images | |
| US10918360B2 (en) | Ultrasound diagnostic apparatus and method for controlling ultrasound diagnostic apparatus | |
| US5897502A (en) | Persistence for ultrasonic flow imaging | |
| JP2000139914A (en) | Ultrasonograph | |
| US10788459B2 (en) | Ultrasound diagnostic apparatus, ultrasound image generation method, and recording medium | |
| KR100527314B1 (en) | Ultrasound imaging apparatus with transmit-focusing points selecting function and method therefor | |
| WO2020075575A1 (en) | Ultrasonic diagnostic device and control method for ultrasonic diagnostic device | |
| JPH08266538A (en) | Ultrasonic diagnostic system | |
| JP2001327496A (en) | Ultrasonic diagnosing system | |
| CN116392160A (en) | Ultrasound imaging system and ultrasound imaging method |
Legal Events
| Date | Code | Title | Description |
|---|---|---|---|
| PUAI | Public reference made under article 153(3) epc to a published international application that has entered the european phase |
Free format text: ORIGINAL CODE: 0009012 |
|
| AK | Designated contracting states |
Kind code of ref document: A2 Designated state(s): AT BE CH CY DE DK ES FI FR GB GR IE IT LI LU MC NL PT SE TR Kind code of ref document: A2 Designated state(s): DE NL |
|
| AX | Request for extension of the european patent |
Free format text: AL;LT;LV;MK;RO;SI |
|
| PUAL | Search report despatched |
Free format text: ORIGINAL CODE: 0009013 |
|
| AK | Designated contracting states |
Kind code of ref document: A3 Designated state(s): AT BE CH CY DE DK ES FI FR GB GR IE IT LI LU MC NL PT SE TR |
|
| AX | Request for extension of the european patent |
Free format text: AL;LT;LV;MK;RO;SI |
|
| RIC1 | Information provided on ipc code assigned before grant |
Free format text: 7A 61B 8/06 A, 7G 06T 5/40 B |
|
| 17P | Request for examination filed |
Effective date: 20020118 |
|
| AKX | Designation fees paid |
Free format text: DE NL |
|
| 17Q | First examination report despatched |
Effective date: 20040220 |
|
| GRAP | Despatch of communication of intention to grant a patent |
Free format text: ORIGINAL CODE: EPIDOSNIGR1 |
|
| GRAS | Grant fee paid |
Free format text: ORIGINAL CODE: EPIDOSNIGR3 |
|
| GRAA | (expected) grant |
Free format text: ORIGINAL CODE: 0009210 |
|
| AK | Designated contracting states |
Kind code of ref document: B1 Designated state(s): DE NL |
|
| REF | Corresponds to: |
Ref document number: 60022292 Country of ref document: DE Date of ref document: 20051006 Kind code of ref document: P |
|
| PLBE | No opposition filed within time limit |
Free format text: ORIGINAL CODE: 0009261 |
|
| STAA | Information on the status of an ep patent application or granted ep patent |
Free format text: STATUS: NO OPPOSITION FILED WITHIN TIME LIMIT |
|
| 26N | No opposition filed |
Effective date: 20060601 |
|
| PGFP | Annual fee paid to national office [announced via postgrant information from national office to epo] |
Ref country code: DE Payment date: 20071221 Year of fee payment: 8 |
|
| PG25 | Lapsed in a contracting state [announced via postgrant information from national office to epo] |
Ref country code: DE Free format text: LAPSE BECAUSE OF NON-PAYMENT OF DUE FEES Effective date: 20090603 |
|
| PGFP | Annual fee paid to national office [announced via postgrant information from national office to epo] |
Ref country code: NL Payment date: 20131126 Year of fee payment: 14 |
|
| REG | Reference to a national code |
Ref country code: NL Ref legal event code: V1 Effective date: 20150601 |
|
| PG25 | Lapsed in a contracting state [announced via postgrant information from national office to epo] |
Ref country code: NL Free format text: LAPSE BECAUSE OF NON-PAYMENT OF DUE FEES Effective date: 20150601 |