EP1085693A2 - Network visualization tool - Google Patents
Network visualization tool Download PDFInfo
- Publication number
- EP1085693A2 EP1085693A2 EP00118557A EP00118557A EP1085693A2 EP 1085693 A2 EP1085693 A2 EP 1085693A2 EP 00118557 A EP00118557 A EP 00118557A EP 00118557 A EP00118557 A EP 00118557A EP 1085693 A2 EP1085693 A2 EP 1085693A2
- Authority
- EP
- European Patent Office
- Prior art keywords
- elements
- network
- links
- grid
- grid arrangement
- Prior art date
- Legal status (The legal status is an assumption and is not a legal conclusion. Google has not performed a legal analysis and makes no representation as to the accuracy of the status listed.)
- Granted
Links
Images




Classifications
-
- G—PHYSICS
- G06—COMPUTING OR CALCULATING; COUNTING
- G06T—IMAGE DATA PROCESSING OR GENERATION, IN GENERAL
- G06T11/00—Two-dimensional [2D] image generation
- G06T11/20—Drawing from basic elements
- G06T11/26—Drawing of charts or graphs
-
- H—ELECTRICITY
- H04—ELECTRIC COMMUNICATION TECHNIQUE
- H04L—TRANSMISSION OF DIGITAL INFORMATION, e.g. TELEGRAPHIC COMMUNICATION
- H04L41/00—Arrangements for maintenance, administration or management of data switching networks, e.g. of packet switching networks
- H04L41/22—Arrangements for maintenance, administration or management of data switching networks, e.g. of packet switching networks comprising specially adapted graphical user interfaces [GUI]
-
- H—ELECTRICITY
- H04—ELECTRIC COMMUNICATION TECHNIQUE
- H04L—TRANSMISSION OF DIGITAL INFORMATION, e.g. TELEGRAPHIC COMMUNICATION
- H04L67/00—Network arrangements or protocols for supporting network services or applications
- H04L67/01—Protocols
- H04L67/131—Protocols for games, networked simulations or virtual reality
Definitions
- the invention concerns a scheme for visualizing networks and systems based thereon.
- Data presented as rows and columns of numbers and text, typically is raw and undifferentiated. To be useful, raw data must be organized into intelligible categories. Data can also be obscure in the sense that its relevant attributes and relationships are hidden. Normally, the user must conduct an investigation (e.g. by using appropriate data mining tools) to discover such data relationships.
- Data visualization utilizes tools, such as display space plots, to represent data within a display space defined by the coordinates of each relevant data dimensional axis.
- Trees are natural structures that appear in many applications of computer science (data structures, databases, networks, etc.). These software tools usually require textual data input and are able to format trees, make small changes to the nodes and layout, and align nodes. Most of the currently available software tools are producing 2-dimensional (2D) trees only. These tools are suited for drawing grammar trees, or trees that allow the visual inspection of networks.
- the CAM Tree is essentially a three-dimensional ROIOdex with limited ability to represent anything more than the hierarchical structure of a data base. The attributes of the data remain hidden.
- Visual presentation systems in existence today do not provide a developer or operator means of easily identifying glitches or bottlenecks in complex communication systems. For example, a developer or operator is forced to make inferences concerning the relationships between various types of hardware elements of a network that are graphically presented on a screen in order to understand how to improve the respective network.
- Site maps are site maps on the World Wide Web.
- each page is seen as a node in a network, and the links between the pages are the links in the network.
- Site maps allow a user to easily navigate through a complex site.
- they are useful to mine the information on the World Wide Web, e.g. by analyzing which sites have many incoming or outgoing links, thus identifying authority sites on a certain subject or reference sites.
- GOTTO3D a system for visualizing hierarchical structures in 3D
- R. Tamassia et. al. Graph Drawing, Symposium on Graph Drawing, GD '96, Proceedings 1997, pp. 193-198
- a bend-minimization algorithm (from a 2D graph drawing tool) is used.
- a method and apparatus are presented for displaying three-dimensional navigable display space containing an aggregation of elements and links between elements.
- a special perspective is provided by processing and displaying the data structure so that a user can see a representative overview of the entire aggregation of elements and links (or a subset thereof) that have been selected for display together on a display screen.
- the present invention is well suited for processing large amounts of information and for displaying that information graphically.
- the invention concerns a scheme and corresponding systems facilitating the visual exploration of hierarchical and non-hierarchical networks.
- the present invention provides an easily comprehensible view of the whole network or a part thereof and allows interactive editing of the network, and/or its elements, and/or its links.
- the present scheme makes abstract relationships or associations between network elements more concrete and accessible.
- the present invention may use space as a cue, e.g., by placing related elements closer together than elements that have no relationship or only a remote relationship.
- the present invention allows to introduce depths into a space such that the depth conveys distance where that elements in the foreground are in the focus of attention.
- a network is a graph comprising elements (nodes, vertices, and the like) and links (connections, edges, and the like) between some of the elements.
- An example of a network is a data structure as described in the already mentioned PCT patent application with application number PCT/IB99/00231, filed on 11 February 1999, with a priority date of 2 June 1998, which is currently assigned to the present assignee.
- the network comprises semantical units (elements) and connection objects (links) between these semantical units. This co-pending patent application is incorporated in its entirety.
- element is herein used to describe an element of a network (graph), database, data structure, or some other form of representation.
- elements are: files (e.g., computer or machine readable files), objects, information kept in a cell of a database, a database record, an image from an image repository, a multimedia object (e.g., an avi or mpeg movie), a semantical unit, or a physical network element of a communications network (such as a switch, router, node, gateway, computer, access device and so forth).
- a “link” can be a physical or logical link between elements. Such a link can describe a relationship or connection between the respective elements. There is a variety of meanings that can be assigned to a link.
- semantical units elements
- connection objects links
- network is herein used to describe any collection or aggregation of elements and links.
- a network can be a computer program-produced network (e.g., a network with application-specific information).
- communications networks e.g., comprising switches, routers, nodes, gateways, computers, access devices, or any combination thereof
- knowledge databases e.g., knowledge databases, networks or graphs representing weather data or weather maps, and the like.
- a simple network 1 is schematically represented in Figure 1.
- the network 1 consists of elements which are visualized as spheres 3, and a link which is visualized as arrow 2.
- a link 2 connects two elements 3, as illustrated in Figure 1.
- network data is used to describe some collection of data that represent the elements and links of a network.
- the network data can be structured or unstructured.
- the network data can be derived from raw data.
- Raw data are data in some idiosyncratic format. These raw data come in many forms, from spreadsheets to some input text, textual strings, output data of some application program, and so forth.
- the transformation of raw data into network data typically involves the loss or gain of information.
- Fractal hierarchical network A network is called hierarchical if, besides the normal, non-scaling links, there are also scaling links. Examples are: a license agreement, a joint project agreement, and an employment contract which are all grouped in the semantical unit (element) 'agreements' by their similarity (they are allagreements), while a liability provision, a license grant provision, and an arbitration provision are all grouped in the semantical unit (element) 'agreement' by their functional connection (they are all functional partsor elements of an agreement).
- a hierarchical network is called fractal if the following four conditions are satisfied:
- the hierarchical structure When visualizing a hierarchical network the hierarchical structure must be clearly visible, which is achieved by arranging the elements in vertically stacked layers which correspond to the levels of hierarchy.
- the visualization of the hierarchical network must be easily comprehensible, which means that the elements must be arranged in such a way that there is a near minimal entanglement and a near minimal length of links within each layer and of links between layers.
- a hierarchical network and a fractal hierarchical network it is also a requirement for a hierarchical network and a fractal hierarchical network to arrange its elements such that they are kept apart a minimal distance so that they can be clearly distinguished.
- This requirement can be fulfilled if one provides a grid (lattice with individual grid points) and requires that the elements be arranged on the grid points only. For instance as a grid one might specify a cubic or a cylindrical lattice.
- a gradient method starts with an arrangement of a plurality of elements on a predefined grid (herein referred to as current grid arrangement). These elements together with some links form a network.
- This current grid arrangement has a corresponding global value (initial global value).
- This global value corresponds to the ease of perception of the visualization of the network, i.e. of the current grid arrangement.
- the gradient method allows to produce from the current grid arrangement another grid arrangement of the plurality of elements that has a global value which is either smaller or bigger than the initial global value, thus making the visualization of the other (new) grid arrangement more easily comprehensible.
- one employs a gradient method which, depending on the implementation, reaches the minimal or maximal global value, or a near-minimal or a near-maximal global value, i.e. the optimal or a near-optimal grid arrangement, very quickly.
- a gradient method which, depending on the implementation, reaches the minimal or maximal global value, or a near-minimal or a near-maximal global value, i.e. the optimal or a near-optimal grid arrangement, very quickly.
- the threshold depends on the definition of the global value, i.e. its relation to the degree of comprehensibility of the visualization of the network.
- a near minimal entanglement of the links is deemed to have been reached if the number of crossings of links (which is a measure of the degree of entanglement) is less than 50% greater than the minimal number of crossings of links.
- the minimal entanglement of the links is reached if the number of crossings of a particular arrangement is equal to the minimum number of crossings of links.
- a near minimal length of the links is deemed to have been reached if the sum of the length of all links is less than 50% greater than the minimal length the of links.
- the minimal length of the links is reached if sum of the length of all links of a particular arrangement is equal to the minimal length of the links.
- the network data are converted into an initial data structure which represents an initial grid arrangement of the plurality of elements.
- This initial grid arrangement has an initial global value and can be generated in many different ways by placing the elements of the plurality of elements on individual grid position of a lattice.
- This lattice (which may be a square lattice or a circle lattice or a cubic lattice or a cylindrical lattice for example) may depend on various parameters, such as the resolution of the graphics display, the number of elements, the computation power of the system generating the data structure, and so forth.
- the initial grid arrangement can be a random arrangement of the elements, for example.
- a global value (global energy) is assigned to this initial grid arrangement.
- the global value depends on the initial grid arrangement of one or more elements with respect to the initial grid positions of said element(s)' neighbors and is herein referred to as initial global value.
- the initial grid arrangement is modified so as to generate another grid arrangement of the plurality of elements.
- a gradient method is employed on the global value of the grid arrangement of the plurality of elements.
- a suited gradient method allows us to find after a number of iterations a suitable arrangement (preferably the optimal arrangement) of a given network or a part thereof on a given grid.
- an optimal arrangement of the elements and links of a network is found by minimizing the total energy function of this network.
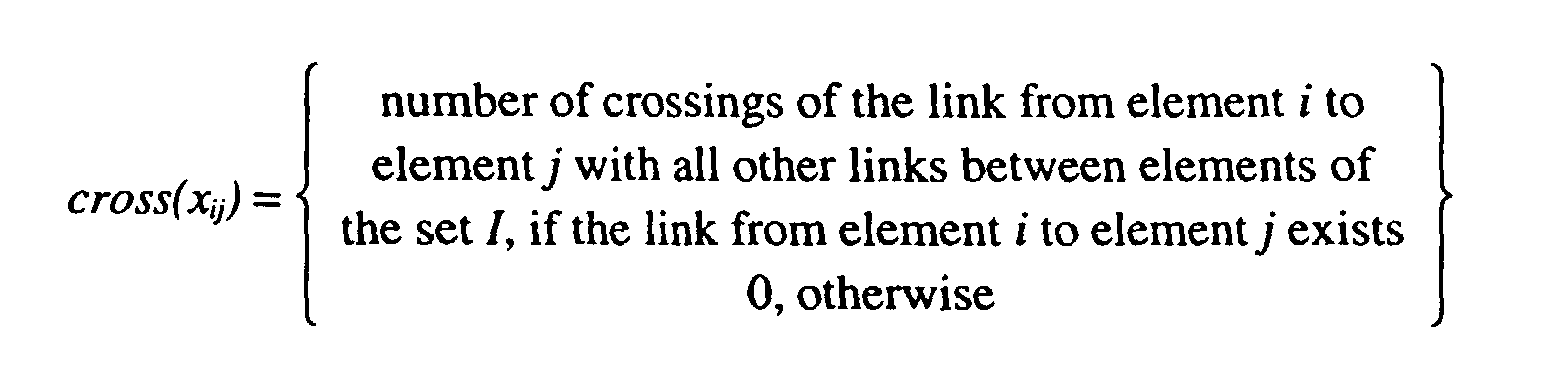
- the total energy function of the network is a function which depends on the arrangement of the elements on the grid and which measures a suitable combination of the total length of all links and the number of crossings of links. It is defined such that the smaller the result (i.e. the smaller the total energy (also called global value)) the more comprehensible the network looks.
- this total energy function may be equipped with a parameter that allows the user to continuously shift the emphasis between minimizing the total length of links and minimizing the entanglement of links.
- Other parameters or factors e.g. a weight or a potential as further down described in connection with a knowledge database, can also be factored in when computing a data structure for visualization.
- This local energy function depends on the arrangement of the neighboring elements of a given element (or several elements) on the grid and measures a suitable combination of the total length of all links to the given elements, the total number of crossings of these links with (all) other links, and the total number of links to the given element(s). This combination further obeys the property that the weighted sum of all local energies yields the total energy (global value), where the weights are the number of links for each individual element or again a suitable function thereof.
- the gradient method then consists of selecting two elements (preferably with the help of the above local energy) whose transposition reduces the total energy as much as possible, and repeating this procedure until no further reduction of the total energy can be achieved, or at least until no large reduction of the total energy is expected anymore.
- the present minimizing algorithm starts with an initial arrangement of the elements on the grid that is either obtained by randomly placing the nodes on the grid or by an arrangement algorithm that finds a reasonable first arrangement of the elements on the grid. This initial arrangement is then defined to be the current grid arrangement.
- the local energy function allows to find the element with the highest local energy for any possible arrangement of the elements on the grid. For the current arrangement it is then this element with the highest local energy that is selected for a transposition with some other element. This other element is obtained by transposing the highest local energy element with any other element in the network and selecting the transposition that yields the least total energy for the new arrangement, provided this new total energy is lower than the current total energy. Since there are only (n-1) elements to check and checking can be done in polynomial time, this is a polynomial problem. Selecting the other element which is to be transposed with the highest local energy element can be optimized by reducing the search to only neighboring elements of the highest local energy element or any similar reduction scheme.
- the algorithm is a gradient method because for any arrangement of the elements one finds a transposition that reduces the total energy. In fact, one even finds the transposition that is likely to maximally reduce the total energy. This new arrangement is then called the current arrangement and the minimizing algorithm repeats the above procedure until no transposition can be found that reduces the total energy which means that the optimal arrangement is reached. It is obvious that the repetitive use of the algorithm can be stopped at any time before the optimal arrangement is reached.
- the minimizing algorithm terminates with a final arrangement that corresponds to a local minimum of the total energy, which means that there may be a different arrangement with yet a lower total energy. It has been observed that algorithms that rely on gradient methods sometimes terminate in such local minima (e.g. back propagation learning in neural networks). In this case a simulated annealing method may be in order, which means that after each step a random shuffling of the elements is allowed, where the amount of shuffling depends on the value of a variable called temperature. This allows the algorithm to jump out of local minima traps and find the global minimum of the total energy.
- the length of a link is defined by the integer length of the shortest path through the grid. On a square lattice this would be the number of horizontal plus the number of vertical gridpoints the two elements are apart, while on a circle it would be the number of gridpoints between the two elements along the shorter of the two possible paths around the circle.
- the algorithm to determine the length may be a straightforward counting method, for example. The number of crossings of links is simply a counting problem. It can be done efficiently by a sweep-line algorithm, possibly adapted for the grid type (e.g., on a circle the standard sweep-line algorithm can be simplified by using a specific table which encodes where connections start and end).
- the elements of a network are placed on a grid for visualization.
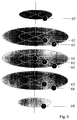
- the grid is cylindrical, resulting in a grid layout as illustrated in Figure 2.
- other grid layouts e.g. cubical, may be chosen.
- the cylindrical grid layout consists of:
- Each circle has a variable number of grid positions 53.
- the grid positions on the circle of first horizontal neighbors 4 are shown.
- the circle of first horizontal neighbors 4 has 16 grid positions.
- Elements are placed either on the central position 19, or on a grid position on a circle.
- the little lines representing the grid positions are sometimes suppressed.
- the hierarchical structure must be clearly visible. This is achieved by arranging the elements in vertically stacked layers - as shown in Figure 2 for example - which correspond to the levels of hierarchy.
- Links can be grouped as follows:
- the spheres and arrows representing the elements and links, respectively can be selectively suppressed.
- Figure 3 shows elements placed on various positions.
- Figure 4 shows a visualization of a network. Each element has been placed on the circle it belongs to, but on random grid position on this circle. Although only 1-2-links are shown (all others are suppressed), this results in an almost incomprehensible visualization of the network. Each element carries a unique identifier n xy .
- Figure 5 shows a visualization of the same network, after having been processed and generated a data structure in accordance with the present invention. Again, each element has been placed on the circle it belongs to, but now in addition it has been carefully placed on a grid position on this circle such that the resulting visualization exhibits a near minimal entanglement of the links (again, only 1-2-links are shown). These placement decisions are done by the gradient approach described below. The assignment of the unique identifiers n xy has not changed.
- This algorithm terminates in polynomial time with a near optimal arrangement of the elements on the grid positions so that the resulting visualization exhibits near minimal entanglement of the links
- step 7 the local energy by dividing by the square root of n i (instead of n i ), and in turn in step 8 the total energy by multiplying by the square root of n i (instead of n i ).
- a visualization tool that is based on the inventive scheme can be used to generate a data structure for displaying the respective network - or a portion thereof - on a display. Additional tools or routines can be employed to allow viewing of the network from different angles and view points. A user may also navigate through the network to get a better understanding of certain elements, links, and their association or relationship. Furthermore, the inventive scheme can also be used for
- Network data representing a network are generated manually. Using an appropriate editor or graphical user interface, a user may generate the network data by first defining some initial parameters of the network. This step is optional. Then, element after element is added and its relationships (links) are defined. General purpose tools or special tools can be used to do this.
- an algorithm in accordance with the present invention for example the minimizing algorithm described above, is employed to convert the network data into a data structure for display on a graphics display.
- the network data are converted into some arrangement of elements which is defined to be the current arrangement with a corresponding current global value.
- a gradient method is then employed to transform the current arrangement to an optimal arrangement with a minimal or maximal, or near-minimal or near-maximal, global value.
- the user may place new elements somewhere on the screen, preferably on an initially blank grid.
- the user then may establish links between the elements to account for the new elements' relationships among themselves.
- a graphical user interface e.g. a drag and drop technique and a snap to grid feature, may be used to do all this.
- An input network is generated from an input string which describes the new element.
- This input network is deemed to be related to the new element. It may comprise information concerning the new element's relations to existing elements in the database.
- the database may be consulted in obtaining the input network.
- the input string can be created by a user or an application, or it can be automatically generated from the new element. This can be done by a mechanism that crawls through the new element to extract information which characterizes it and/or its content. An automatic object recognition scheme might be used for that purpose.
- the content of the new element can be automatically analyzed and the result can be used to generate the input network.
- an input string is not necessarily needed.
- the database is updated with information describing or defining the new element. This can be done by associating the input network with the database, or by adding the new element or the input network to the database. If the database is of hierarchical nature and all elements are alike, then the input network which is to be added to the database preferably also has a fractal hierarchical structure.
- the user may manually add the new element directly to a network that is displayed on a screen. In order to do so, the user may place the new element somewhere on the screen, preferably in the adjacency of an element that he deems to be related to the new element. In a next step, the user then may establish links to other elements to account for the new element's relationships with these other elements.
- a graphical user interface e.g. a drag and drop technique and a snap to grid feature, may be used to do all this.
- an access pointer may be needed.
- This access pointer provides a physical or logical link (e.g. a memory address) between the new element and some other instance or element.
- the access pointer can be used for accessing the new element in the database, or for retrieving the new element from the database, or for opening the new element using an appropriate application program (e.g., a text processor), or for displaying the new element, or for performing an operation on the access pointer as such.
- an appropriate application program e.g., a text processor
- the access pointer may describe the physical or logical location where said new element is stored in the database.
- An algorithm in accordance with the present invention for example the minimizing algorithm described above, is now employed to generate a data structure which represents the minimum or maximum of the global value.
- the new arrangement of elements i.e. the arrangement of elements after the new element was added, is defined to be the current arrangement.
- an input string may be needed which contains information that helps to identify the element.
- This input string is received by the system. It may comprise keywords, or textual information.
- the keywords or textual information can either be human readable or machine readable.
- a speech recognition module can be employed such that the user can 'talk' to the system. The speech recognition module then transforms the speech into textual information which is then processed the same way as other input strings.
- Another way to improve the interaction between a user and the system is to install a camera that is used to record the user's behavior.
- An image recognition module then transforms the behavior into textual information which is then processed the same way as other input strings. In all cases the textual information may be evaluated by consulting the database.
- the input string is evaluated. This is done in order to obtain an input network which in turn defines a local network within the database.
- the local network is defined to be a portion, or segment, or set of segments of the database to which the input string is deemed to be related.
- the local network is defined such that it comprises at least one representation (e.g., a semantical unit or name) of the target element to which the input string seems to be related or associated. If no representation is found the process is stopped, or the user or system might be prompted for additional information which helps to clarify the information conveyed in the input string.
- the database may be consulted in obtaining the input network.
- the local network within the database can be defined such that it comprises representations of those elements which are in a (semantical) neighborhood (as computed from the distance function) to the element(s) of the input network.
- the local network within the database can be defined such that it comprises representations associated to the input string.
- this element is displayed.
- the element can be displayed on a screen, for example, or it can be highlighted inside the network representing the database.
- the elements can be arranged or displayed to give the user clues about their contents.
- the system may create a human-understandable output, such as a map or other kind of visual or audible representation of the elements that the system deems are related to the target element the user is looking for.
- the present minimizing algorithm may be used to find the optimal arrangment of elements and links on a screen.
- the user or the system can act upon the corresponding database element (target element) by using the access pointer that is associated with this particular element.
- the access pointer can be used for accessing the target element in the database, or for retrieving it from the database, or for opening it using an appropriate application program (e.g., a text processor), or for displaying it, or for performing an operation on the access pointer as such.
- an appropriate application program e.g., a text processor
- the access pointer may describe the physical or logical location where said target element is stored in the database.
- the user or system can act upon one or more of the respective database elements by using the access pointers that are associated with these elements. Alternatively, the user may be prompted for additional information to clarify the input string and reduce the number of elements that are deemed to be related or associated to the input string.
- the user himself may try to locate the target element on the display screen. This can be done by navigating through the displayed network and by looking for elements that the user considers to be related to the target element. After he was able to locate the respective element inside the network, the user can act upon it directly.
- An element can be acted upon using a computer mouse, a key on a computer keyboard, or a combination of keys on a computer keyboard, for example.
- An algorithm in accordance with the present invention for example the minimizing algorithm described above, can be employed to find an optimal arrangement after the user acted upon one or more elements. This is only necessary, if the user has changed aspects of the database (network). E.g. after having changed or modified an element's relationship (links) with other elements, a re-calculation of the data structure may be desirable. For this purpose an algorithm in accordance with the present invention may be employed.
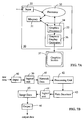
- the schematic hardware structure of a visualization system 10, according to the present invention, is shown in Figure 6A.
- the system 10 comprises a memory 11 for storing network data 12, a memory 13 for storing the corresponding data structure 14, a processor 15 (CPU), an interface 16, a bus structure 17, and input/output means 18.
- the interface 16 and input/output means 18 allow the visualization system 10 to be connected to a display screen, network, or the like.
- the system 10 is capable of receiving input through the input/output means 18 and interface 16.
- the network data 12 and the data structure 14 can likewise be stored in one and the same memory.
- a tape drive, a hard disk drive, a semiconductor memory, or any other storage system may serve as memory.
- the network data 12 and the data structure 14 coexist. It is also conceivable that the network data 12 is step-by-step transformed into the corresponding data structure 14 such that at the end of this process there is just the data structure 14 but no network data anymore.
- the corresponding logical block diagram is given in Figure 6B.
- data are received via an input 20. These data are either network data, i.e., data which represent the elements and the relationships (links) between elements, or raw data which can be used to derive network data.
- network data i.e., data which represent the elements and the relationships (links) between elements
- raw data which can be used to derive network data.
- the received data are network data 21. If the received data are raw data, then an additional logical unit (e.g. a semantic processor or meaning extractor) is required that transforms the raw data into network data 21.
- the logical block diagram of the first embodiment comprises a processing unit 22 that embodies the present minimizing algorithm.
- the processing unit 22 may be realized in hardware and/or software.
- the unit 22 receives the network data 21 and applies an algorithm in accordance with the present invention in order to generate the data structure 23.
- This data structure 23 has a plurality of elements and links between elements.
- the network data 21 are converted into some initial data structure representing an initial grid arrangement of the plurality of elements such that each element of the plurality of elements is placed on an individual grid position of a lattice.
- a global value global energy is assigned to this initial grid arrangement of the plurality of elements whereby the global value depends on the initial grid arrangement of an element with respect to the current grid positions of said element's neighbors.
- the initial grid arrangement is modified to generate another grid arrangement of the plurality of elements with a gradient method on the global value of the grid arrangement of the plurality of elements.
- the processing may be stopped and the current grid arrangement of the plurality of elements is considered to be the final one.
- the above steps may be repeated until the global value of the current grid arrangement of the plurality of elements reaches a minimum or a maximum, depending upon the implementation of the algorithm. When this minimum or maximum is reached or almost reached, the processing may finally be stopped and the current grid arrangement of the plurality of elements is considered to be the final one.
- This final grid arrangement is represented by a corresponding final data structure 23 which can be fed via output 24 to some graphics display system, or via a network or communications link to another system.
- the final data structure 23 may either have a format that can be displayed on a display without further mapping or transformation, or it may have a format that has to be mapped or transformed into image data.
- the data structure is formatted such that it can be displayed on a display screen without further transformation.
- FIG. 7A The schematic hardware structure of a visualization system 30, according to the present invention, is shown in Figure 7A.
- This system 30 comprises an input 32.
- This input 32 may receive data from a keyboard, a mouse, or some other peripheral device, or from a communications link, for example.
- the system 30 furthermore comprises a memory 31 which stores the data, network data, and data structure.
- Memory 31 may be a random access memory (RAM) for example.
- processor 35 and an output interface 33 with a graphics processor 34 and a graphics display generator 36.
- the processor 35 accesses and/or fetches, as necessary, files (e.g. the network data and data structure) and programs (e.g. a program that embodies the present invention) from memory 31.
- the graphics processor 34 can be implemented as either a hardware circuit or as a software program recalled from memory 31 and executed by the processor 35.
- the graphics processor 34 produces image data (e.g., a pixel map) from the data structure.
- image data are used by the graphics display generator 36 to produce, on graphics display 37, a graphical representation of the network data, as generated by the present minimizing algorithm.
- the image data may be stored in the memory 31, for example. There may also be a separate memory for storing the image data.
- the image data can also be stored on a storage medium (e.g. a diskette) such that they can be carried to another system. Image data can also be transmitted via a communications link, or network to another system.
- the output interface 33 is connected to a graphics display 37.
- the system 30 comprises a computer program (not shown) that, when being executed by the processor 35, controls the system 30 such that it carries out the method which - according to the present invention - transforms the network data into a data structure that can then be processed by the interface 33 so that it can be displayed on the graphics display 37. This is very similar to what has been described in connection with the first embodiment. Accordingly, a detailed description of each of the steps is omitted for brevity.
- raw data are received by an input 40. These raw data can be used to derive network data.
- a logical unit 39 e.g. a semantic processor or meaning extractor
- the second embodiment further comprises a processing unit 42 that embodies the present minimizing algorithm.
- the processing unit 42 may be realized in hardware and/or software. The unit 42 receives the network data 41 and applies the minimizing algorithm in order to generate the data structure 43. Details of this process are described above and are not repeated for sake of brevity.
- the data structure 43 has a format that cannot be used for generating an image on the graphics display 37.
- An additional logical unit 44 is employed that produces appropriate image data 45 from the data structure 43. These image date 45 can be sent via an output 46 to the graphics display 37, for example.
- the present invention can be used in different kinds of situations, environments, and systems.
- An algorithm in accordance with the present invention can also be employed to visualize details of a knowledge database, as described in the already mentioned PCT patent application with application number PCT/IB99/00231.
- This knowledge database is a fractal network that represents knowledge. It has a unique structure, as described in the co-pending PCT patent application. It is a kind of library describing the knowledge of the world, or a particular area of interest thereof, by using a well-defined structure that consists of components such as possible relevant types of semantical units (elements) and their possible mutual connections (links).
- the structured representation of aspects of the world with the knowledge database is achieved by a multiscale approach.
- Self-similar representations are used on different scales to describe the behavior of the elements and links in a dynamical hierarchical fashion.
- self-similar algorithms are used when making use of the knowledge contained in this database (network).
- the knowledge database is a complex fractal hierarchical network of semantical units (elements).
- Each connection object (link) may carry a fixed or variable weight (also called semantical distance), where a suitable function of the weight of a connection object (link) represents some kind of semantical distance between the two semantical units (elements) it connects, i.e., it represents the degree of (semantical) association between the two semantical units (elements) across this particular link. Weights may be used to compute the semantical distance of any two linked elements. Thus, this concept of semantical distance establishes a metric on the knowledge database. One can use these weights when visualizing a network, or a variable or fixed threshold below which connections are ignored when visualizing the network.
- Elements in the knowledge database may carry a "potential". If an element carries a potential it corresponds to the element's importance in relation to some other element or its importance within the network or a subnet. The potential can also be used when computing a data structure for visualization.
- Programs built around the present scheme allow to visualize and graphically edit networks.
- Another possible application is a three-dimensional (3D) visualization of site maps on the World Wide Web (WWW).
- the present invention can be used in connection with printed circuit board design systems as well.
- There are many more possible applications as almost all intelligent systems rely heavily on networks and their visualization.
- the present invention allows to:
- the present invention can be realized in hardware, software, or a combination of hardware and software.
- a visualization tool according to the present invention can be realized in a centralized fashion in one computer system, or in a distributed fashion where different elements are spread across several interconnected computer systems. Any kind of computer system - or other apparatus adapted for carrying out the methods described herein - is suited.
- a typical combination of hardware and software could be a general purpose computer system with a computer program that, when being loaded and executed, controls the computer system such that it carries out the methods described herein.
- the present invention can also be embedded in a computer program product, which comprises all the features enabling the implementation of the methods described herein, and which - when loaded in a computer system - is able to carry out these methods.
- Computer program means or computer program in the present context mean any expression, in any language, code or notation, of a set of instructions intended to cause a system having an information processing capability to perform a particular function either directly or after either or both of the following a) conversion to another language, code or notation; b) reproduction in a different material form.
Landscapes
- Engineering & Computer Science (AREA)
- Computer Networks & Wireless Communication (AREA)
- Signal Processing (AREA)
- Physics & Mathematics (AREA)
- General Physics & Mathematics (AREA)
- Theoretical Computer Science (AREA)
- Human Computer Interaction (AREA)
- Information Retrieval, Db Structures And Fs Structures Therefor (AREA)
- Image Generation (AREA)
Abstract
Description
- FIG. 1
- is a schematic representation of a simple network with two elements and one link.
- FIG. 2
- is a schematic representation of a cylindrical grid as used for the visualization according to the present invention.
- FIG. 3
- is a schematic representation of a network with elements placed on various positions, in accordance with the present invention
- FIG. 4
- is a schematic visualization of a network with many elements and links, in accordance with the present invention.
- FIG. 5
- is a schematic visualization of an optimized arrangement of the network of Figure 4, in accordance with the present invention.
- FIG. 6A
- is a schematic hardware structure of a visualization system, in accordance with the present invention.
- FIG. 6B
- is a schematic logical block diagram block diagram of the visualization system of Figure 6A.
- FIG. 7A
- is a schematic hardware structure of another visualization system, in accordance with the present invention.
- FIG. 7B
- is a schematic logical block diagram block diagram of the visualization system of Figure 7A.
- All elements are similar (derived from one template).
- All links are similar (derived from one template).
- Links may also be elements.
- Hierarchical links are possible, and at least one element must have a hierarchical link.
- the
central position 19, - the circle of first
horizontal neighbors 4, - the circle of first
upward neighbors 5, - the circle of first
downward neighbors 6, - the circle of second horizontal-
horizontal neighbors 23, - the circle of second upward-
horizontal neighbors 8, - the circle of second downward-
horizontal neighbors 9, - the circle of second upward-
upward neighbors 50, - the circle of second downward-
downward neighbors 51, and - the y-
axis 52.
- An element in the
central position 19 is called a central element. - An element on
circle - An element on
circle
- A link from the central element to a first neighbor is called a 0-1-link.
- A link from a first neighbor to a first neighbor is called a 1-1-link.
- A link from a first neighbor to a second neighbor is called a 1-2-link.
- A link from a second neighbor to a second neighbor is called a 2-2-link.
- the
central element 60 is placed at the central position, - a first
horizontal neighbor 61 to thecentral element 60 is placed on the circle of first horizontal neighbors, - a first
upward neighbor 62 to thecentral element 60 is placed on the circle of first upward neighbors, - a first
downward neighbor 63 to thecentral element 60 is placed on the circle of first downward neighbors, - a second horizontal-
horizontal neighbor 64 to thecentral element 60 is placed on the circle of second horizontal-horizontal neighbors, - a second upward-
horizontal neighbor 65 to thecentral element 60 is placed on the circle of second upward-horizontal neighbors, - a second downward-
horizontal neighbor 66 to thecentral element 60 is placed on the circle of second downward-horizontal neighbors, - a second upward-
upward neighbor 67 to thecentral element 60 is placed on the circle of second upward-upward neighbors, - a second downward-
downward neighbor 68 to thecentral element 60 is placed on the circle of second downward-downward neighbors,

(
- visualize network information in an easily comprehensible way;
- format network information;
- make changes to the elements (nodes, etc.) and/or links (connections);
- make changes to the network's layout;
- explore networks;
- construct networks;
- maintain networks;
- show the topological structure of a network;
- align elements (nodes, etc.) and/or links (connections);
- visually inspect networks (graphs);
- fold/unfold areas or sections of a network;
- animate a network, the construction of a network, etc.;
- provide alternative views for networks (graphs);
- provide the optimal arrangement of elements of a network;
- provide a drag and drop interface;
- visualize dynamical hierarchical networks;
- visualize complex fractal hierarchical networks, and so forth.
Claims (47)
- A method for converting network data (21, 41) into a data structure (23, 43) for use by a graphics display system, comprising the steps:receiving network data (21, 41) representing a network (1) with a plurality of elements (3) and links (2) between elements (3),converting the network data (21, 41) into a data structure (23, 43) representing a grid arrangement of the plurality of elements where each element of the plurality of elements is placed on an individual grid position of a lattice, bya. assigning a global value to an initial grid arrangement of the plurality of elements which depends on the arrangement of one element of the plurality of elements with respect to the grid positions of said one element's neighbors, andb. modifying the initial grid arrangement to generate another grid arrangement of the plurality of elements with a gradient method on the global value of the grid arrangement of the plurality of elements.
- The method of claim 1, whereby the steps a. and b. are repeated until the global value of the grid arrangement of the plurality of elements approaches a minimal or maximal global value of the network.
- The method of claim 1, whereby the steps a. and b. are repeated until a near minimal entanglement of the links, preferably a minimal entanglement of the links, is obtained.
- The method of claim 1, whereby the steps a. and b. are repeated until a near minimal length of the links, preferably a minimal length of the links, is obtained.
- The method of claim 1, whereby the gradient method is employed such that the modification of the initial grid arrangement yields as big as possible a change in the global value.
- The method of claim 1, whereby the gradient method allows to shift the emphasis between minimizing the number of crossings of the links and minimizing the length of the links, or any combination thereof.
- The method of claim 1, whereby each element has a local value and whereby the global value is the sum, preferably the weighted sum, of all local values.
- The method of claim 7, whereby the gradient method modifies the initial grid arrangement starting with the element with the highest local value for any possible arrangement of the elements on the grid.
- The method of claim 1, whereby the gradient method embodies a minimizing algorithm or a maximizing algorithm.
- The method of claim 1, whereby the gradient method is of polynomial complexity.
- The method of claim 1, whereby the global value is related to the degree of comprehensibility of the visualization of the network.
- The method of claim 1, whereby a simulated annealing method is employed that randomly shuffles the elements to jump out of local minima or maxima traps of the global value.
- The method of claim 1, whereby the lattice has a finite number of grid positions.
- The method of claim 1, whereby the elements are visualized as circles or spheres, and the links are visualized as lines or arrows.
- The method of claim 1, whereby an element or a link can be selectively suppressed.
- The method of claim 1, whereby the network is hierarchical or fractal hierarchical.
- The method of claim 1, whereby the network has a hierarchical structure and where the hierarchical structure is visualized by arranging the elements in vertically stacked layers corresponding to the levels of hierarchy.
- A visualization tool (10; 30) for converting network data (21; 41), which represent a plurality of elements (3) and links (2) between elements (3), into a data structure (23; 43), which represents a grid arrangement of the plurality of elements (3) where each element of the plurality of elements (3) is placed on an individual grid position of a lattice, such that the data structure (23; 43) is suited for use by a graphics display (37), comprising:whereby the processing unit (22; 42) generates an initial data structure (23; 43), which represents an initial grid arrangement of the plurality of elements, assigns a global value to this initial grid arrangement, employs the gradient method for converting the initial grid arrangement into another grid arrangement which has a decreased or an increased global value.a storage device (11; 31) for storing the network data (21; 41);a storage device (11, 13; 31) for storing the data structure (23; 43);a processing unit (22; 42) embodying a gradient method;
- A visualization tool (10; 30) for converting network data (21; 41), which represent a network with a plurality of elements (3) and links (2) between elements (3), into a data structure (23; 43), which represents a grid arrangement of the plurality of elements (3) where each element of the plurality of elements (3) is placed on an individual grid position of a lattice, such that the data structure (23; 43) is suited for use by a graphics display (37), comprising:whereby the processing unit (22; 42) converts the network data (21; 41) into an initial data structure (23; 43) with an initial degree of entanglement of links, which in turn is transformed into another data structure (23; 43) by using the gradient method such that the degree of entanglement of the links is reduced.a storage device (11; 31) for storing the network data (21; 41);a storage device (11, 13; 31) for storing the data structure (23; 43);a processing unit (22; 42) embodying a gradient method;
- The visualization tool of claim 18 or 19, further comprising a graphics display system (33, 37).
- The visualization tool of claim 20, wherein the graphics display system comprises a graphics processor (34) and a graphics display (37).
- The visualization tool of claim 19, wherein the network is a computer program-produced network, a communications networks, or a database.
- The visualization tool of claim 18, wherein the processing unit (22; 42) carries out the following step when converting the network data (21; 41) into a data structure (23, 43):modifying the initial grid arrangement of the plurality of elements to generate another grid arrangement of the plurality of elements with a gradient method on the global value of the grid arrangement of the plurality of elements.
- The visualization tool of claim 18 or 19, wherein one can shift the emphasis between minimizing the number of crossings of the links and minimizing the length of the links, or any combination thereof.
- The visualization tool of claim 18, wherein the gradient method modifies the initial grid arrangement starting with the element with the highest local value for any possible arrangement of the elements on the grid.
- The visualization tool of claim 18, wherein a simulated annealing method is embodied by the processing unit (22; 42) that allows to randomly shuffles the elements to jump out of local minima or maxima traps of the global value.
- The visualization tool of claim 18 or 19, wherein the lattice has a finite number of grid positions.
- The visualization tool of claim 18 or 19, wherein the elements are visualized as circles or spheres, and the links are visualized as lines or arrows.
- The visualization tool of claim 18 or 19, wherein an element or a link can be selectively suppressed.
- The visualization tool of claim 19, wherein the network is hierarchical or fractal hierarchical.
- The visualization tool of claim 19, wherein the network has a hierarchical structure and where the hierarchical structure is visualized by arranging the elements in vertically stacked layers corresponding to the levels of hierarchy.
- The visualization tool of claim 20, wherein the graphics display system generates image data, preferrably a pixel map diagram, from the data structure.
- The visualization tool of claim 18 or 19, further comprising means (20; 39, 40) for receiving network data (21; 41).
- A computer program product comprising a computer readable medium, having thereon:computer program code means, when said computer program is loaded, to make a visualization tool convert network data (21, 41) into a data structure (23, 43) for use by a graphics display system, by executing procedure to:receive network data (21, 41) representing a network (1) with a plurality of elements (3) and links (2) between elements (3),converte the network data (21, 41) into a data structure (23, 43) representing a grid arrangement of the plurality of elements where each element of the plurality of elements is placed on an individual grid position of a lattice, bya. assigning a global value to an initial grid arrangement of the plurality of elements which depends on the arrangement of one element of the plurality of elements with respect to the grid positions of said one element's neighbors, andb. modifying the initial grid arrangement to generate another grid arrangement of the plurality of elements with a gradient method on the global value of the grid arrangement of the plurality of elements.
- The computer program product claim 34, whereby the steps a. and b. are repeated until the global value of the grid arrangement of the plurality of elements approaches a minimal or maximal global value of the network.
- The computer program product claim 34, whereby the steps a. and b. are repeated until a near minimal entanglement of the links, preferably a minimal entanglement of the links, is obtained.
- The computer program product claim 34, whereby the steps a. and b. are repeated until a near minimal length of the links, preferably a minimal length of the links, is obtained.
- The computer program product claim 34, whereby the gradient method is employed such that the modification of the initial grid arrangement yields as big as possible a change in the global value.
- The computer program product claim 34, whereby the gradient method allows to shift the emphasis between minimizing the number of crossings of the links and minimizing the length of the links, or any combination thereof.
- The computer program product claim 34, whereby the gradient method embodies a minimizing algorithm or a maximizing algorithm.
- A computer program element comprising:computer program code means to make a visualization tool convert network data (21, 41) into a data structure (23, 43) for use by a graphics display system, by executing procedure to:receive network data (21, 41) representing a network (1) with a plurality of elements (3) and links (2) between elements (3),converte the network data (21, 41) into a data structure (23, 43) representing a grid arrangement of the plurality of elements where each element of the plurality of elements is placed on an individual grid position of a lattice, bya. assigning a global value to an initial grid arrangement of the plurality of elements which depends on the arrangement of one element of the plurality of elements with respect to the grid positions of said one element's neighbors, andb. modifying the initial grid arrangement to generate another grid arrangement of the plurality of elements with a gradient method on the global value of the grid arrangement of the plurality of elements.
- The computer program element claim 41, whereby the steps a. and b. are repeated until the global value of the grid arrangement of the plurality of elements approaches a minimal or maximal global value of the network.
- The computer program element claim 41, whereby the steps a. and b. are repeated until a near minimal entanglement of the links, preferably a minimal entanglement of the links, is obtained.
- The computer program element claim 41, whereby the steps a. and b. are repeated until a near minimal length of the links, preferably a minimal length of the links, is obtained.
- The computer program element claim 41, whereby the gradient method is employed such that the modification of the initial grid arrangement yields as big as possible a change in the global value.
- The computer program element claim 41, whereby the gradient method allows to shift the emphasis between minimizing the number of crossings of the links and minimizing the length of the links, or any combination thereof.
- The computer program element claim 41, whereby the gradient method embodies a minimizing algorithm or a maximizing algorithm.
Priority Applications (1)
| Application Number | Priority Date | Filing Date | Title |
|---|---|---|---|
| EP00118557A EP1085693B1 (en) | 1999-09-13 | 2000-08-26 | Network visualization tool |
Applications Claiming Priority (3)
| Application Number | Priority Date | Filing Date | Title |
|---|---|---|---|
| EP99810817 | 1999-09-13 | ||
| EP99810817 | 1999-09-13 | ||
| EP00118557A EP1085693B1 (en) | 1999-09-13 | 2000-08-26 | Network visualization tool |
Publications (3)
| Publication Number | Publication Date |
|---|---|
| EP1085693A2 true EP1085693A2 (en) | 2001-03-21 |
| EP1085693A3 EP1085693A3 (en) | 2003-12-10 |
| EP1085693B1 EP1085693B1 (en) | 2009-07-29 |
Family
ID=26071333
Family Applications (1)
| Application Number | Title | Priority Date | Filing Date |
|---|---|---|---|
| EP00118557A Expired - Lifetime EP1085693B1 (en) | 1999-09-13 | 2000-08-26 | Network visualization tool |
Country Status (1)
| Country | Link |
|---|---|
| EP (1) | EP1085693B1 (en) |
Cited By (5)
| Publication number | Priority date | Publication date | Assignee | Title |
|---|---|---|---|---|
| US7024419B1 (en) * | 1999-09-13 | 2006-04-04 | International Business Machines Corp. | Network visualization tool utilizing iterative rearrangement of nodes on a grid lattice using gradient method |
| US7394472B2 (en) | 2004-10-08 | 2008-07-01 | Battelle Memorial Institute | Combinatorial evaluation of systems including decomposition of a system representation into fundamental cycles |
| EP1968237A3 (en) * | 2002-10-29 | 2008-12-24 | Inrotis Technologies Limited | Method and apparatus for identifying components of a network having high importance for network integrity |
| CN112069365A (en) * | 2020-08-20 | 2020-12-11 | 之江实验室 | Example-based node link graph layout migration method and device |
| EP4371069A4 (en) * | 2022-09-30 | 2024-07-10 | Shanghai United Imaging Healthcare Co., Ltd. | METHODS, SYSTEMS AND RECORDING MEDIUM FOR IMAGE RECORDING |
Family Cites Families (2)
| Publication number | Priority date | Publication date | Assignee | Title |
|---|---|---|---|---|
| US4953106A (en) * | 1989-05-23 | 1990-08-28 | At&T Bell Laboratories | Technique for drawing directed graphs |
| US6774899B1 (en) * | 1997-09-18 | 2004-08-10 | Mitsubishi Electric Research Laboratories, Inc. | Drawing graphs using user selectable visual oragnization features and/or other user controlled constraints |
-
2000
- 2000-08-26 EP EP00118557A patent/EP1085693B1/en not_active Expired - Lifetime
Cited By (6)
| Publication number | Priority date | Publication date | Assignee | Title |
|---|---|---|---|---|
| US7024419B1 (en) * | 1999-09-13 | 2006-04-04 | International Business Machines Corp. | Network visualization tool utilizing iterative rearrangement of nodes on a grid lattice using gradient method |
| EP1968237A3 (en) * | 2002-10-29 | 2008-12-24 | Inrotis Technologies Limited | Method and apparatus for identifying components of a network having high importance for network integrity |
| US7394472B2 (en) | 2004-10-08 | 2008-07-01 | Battelle Memorial Institute | Combinatorial evaluation of systems including decomposition of a system representation into fundamental cycles |
| CN112069365A (en) * | 2020-08-20 | 2020-12-11 | 之江实验室 | Example-based node link graph layout migration method and device |
| CN112069365B (en) * | 2020-08-20 | 2024-03-05 | 之江实验室 | Migration method and device for node link graph layout based on examples |
| EP4371069A4 (en) * | 2022-09-30 | 2024-07-10 | Shanghai United Imaging Healthcare Co., Ltd. | METHODS, SYSTEMS AND RECORDING MEDIUM FOR IMAGE RECORDING |
Also Published As
| Publication number | Publication date |
|---|---|
| EP1085693B1 (en) | 2009-07-29 |
| EP1085693A3 (en) | 2003-12-10 |
Similar Documents
| Publication | Publication Date | Title |
|---|---|---|
| US7024419B1 (en) | Network visualization tool utilizing iterative rearrangement of nodes on a grid lattice using gradient method | |
| Guo et al. | Floorplanning using a tree representation | |
| EP4375844A1 (en) | Neural network on-chip mapping method and device based on tabu search algorithm | |
| CN102279874B (en) | For interactive graphics quick wing by | |
| Zhu et al. | A new reconstruction method for 3D buildings from 2D vector floor plan | |
| Gajer et al. | A fast multi-dimensional algorithm for drawing large graphs | |
| JP7779634B2 (en) | Automated representation and extraction of tabular data in portable document formats using graph neural networks | |
| Van Ham et al. | Interactive visualization of state transition systems | |
| Mark Ware et al. | Automated production of schematic maps for mobile applications | |
| CN115599897A (en) | Power distribution network equipment intelligent question-answering system construction method and system based on knowledge graph | |
| DeVille et al. | Phase-locked patterns of the Kuramoto model on 3-regular graphs | |
| Fionda et al. | Building knowledge maps of Web graphs | |
| Van Ham et al. | Visualization of state transition graphs | |
| Miller et al. | State of the Art of Graph Visualization in non‐Euclidean Spaces | |
| EP1085693B1 (en) | Network visualization tool | |
| Grzesiak-Kopeć et al. | Hypergraphs and extremal optimization in 3D integrated circuit design automation | |
| Parsonage et al. | Fast generation of spatially embedded random networks | |
| Bartholdi et al. | Multiresolution indexing of triangulated irregular networks | |
| CN117058305A (en) | Methods, devices, equipment and media for laying out force-directed diagrams | |
| US12406399B2 (en) | Point cloud prediction processing methods and apparatuses, computer, and storage medium | |
| Abello et al. | Atlas: local graph exploration in a global context | |
| Kontakis et al. | Spatial indexing of complex virtual reality scenes in the web | |
| Lam et al. | Hyperbolic wheel: A novel hyperbolic space graph viewer for hierarchical information content | |
| Zhou et al. | Bio-inspired structure identification in language embeddings | |
| Zhu et al. | Using 3D interfaces to facilitate the spatial knowledge retrieval: a geo-referenced knowledge repository system |
Legal Events
| Date | Code | Title | Description |
|---|---|---|---|
| PUAI | Public reference made under article 153(3) epc to a published international application that has entered the european phase |
Free format text: ORIGINAL CODE: 0009012 |
|
| AK | Designated contracting states |
Kind code of ref document: A2 Designated state(s): AT BE CH CY DE DK ES FI FR GB GR IE IT LI LU MC NL PT SE |
|
| AX | Request for extension of the european patent |
Free format text: AL;LT;LV;MK;RO;SI |
|
| PUAL | Search report despatched |
Free format text: ORIGINAL CODE: 0009013 |
|
| AK | Designated contracting states |
Kind code of ref document: A3 Designated state(s): AT BE CH CY DE DK ES FI FR GB GR IE IT LI LU MC NL PT SE |
|
| AX | Request for extension of the european patent |
Extension state: AL LT LV MK RO SI |
|
| RIC1 | Information provided on ipc code assigned before grant |
Ipc: 7H 04L 12/24 A Ipc: 7G 06T 11/20 B |
|
| 17P | Request for examination filed |
Effective date: 20040514 |
|
| 17Q | First examination report despatched |
Effective date: 20040720 |
|
| AKX | Designation fees paid |
Designated state(s): CH DE FR GB LI |
|
| GRAP | Despatch of communication of intention to grant a patent |
Free format text: ORIGINAL CODE: EPIDOSNIGR1 |
|
| GRAS | Grant fee paid |
Free format text: ORIGINAL CODE: EPIDOSNIGR3 |
|
| GRAA | (expected) grant |
Free format text: ORIGINAL CODE: 0009210 |
|
| AK | Designated contracting states |
Kind code of ref document: B1 Designated state(s): CH DE FR GB LI |
|
| REG | Reference to a national code |
Ref country code: GB Ref legal event code: FG4D |
|
| REG | Reference to a national code |
Ref country code: CH Ref legal event code: EP |
|
| REG | Reference to a national code |
Ref country code: CH Ref legal event code: NV Representative=s name: IBM RESEARCH GMBH ZURICH RESEARCH LABORATORY INTEL |
|
| REF | Corresponds to: |
Ref document number: 60042631 Country of ref document: DE Date of ref document: 20090910 Kind code of ref document: P |
|
| PLBE | No opposition filed within time limit |
Free format text: ORIGINAL CODE: 0009261 |
|
| STAA | Information on the status of an ep patent application or granted ep patent |
Free format text: STATUS: NO OPPOSITION FILED WITHIN TIME LIMIT |
|
| 26N | No opposition filed |
Effective date: 20100503 |
|
| PGFP | Annual fee paid to national office [announced via postgrant information from national office to epo] |
Ref country code: CH Payment date: 20111026 Year of fee payment: 12 |
|
| PGFP | Annual fee paid to national office [announced via postgrant information from national office to epo] |
Ref country code: FR Payment date: 20120830 Year of fee payment: 13 |
|
| REG | Reference to a national code |
Ref country code: CH Ref legal event code: PL |
|
| PG25 | Lapsed in a contracting state [announced via postgrant information from national office to epo] |
Ref country code: LI Free format text: LAPSE BECAUSE OF NON-PAYMENT OF DUE FEES Effective date: 20130831 Ref country code: CH Free format text: LAPSE BECAUSE OF NON-PAYMENT OF DUE FEES Effective date: 20130831 |
|
| REG | Reference to a national code |
Ref country code: FR Ref legal event code: ST Effective date: 20140430 |
|
| PG25 | Lapsed in a contracting state [announced via postgrant information from national office to epo] |
Ref country code: FR Free format text: LAPSE BECAUSE OF NON-PAYMENT OF DUE FEES Effective date: 20130902 |
|
| PGFP | Annual fee paid to national office [announced via postgrant information from national office to epo] |
Ref country code: GB Payment date: 20170829 Year of fee payment: 18 Ref country code: DE Payment date: 20170821 Year of fee payment: 18 |
|
| REG | Reference to a national code |
Ref country code: DE Ref legal event code: R119 Ref document number: 60042631 Country of ref document: DE |
|
| GBPC | Gb: european patent ceased through non-payment of renewal fee |
Effective date: 20180826 |
|
| PG25 | Lapsed in a contracting state [announced via postgrant information from national office to epo] |
Ref country code: DE Free format text: LAPSE BECAUSE OF NON-PAYMENT OF DUE FEES Effective date: 20190301 |
|
| PG25 | Lapsed in a contracting state [announced via postgrant information from national office to epo] |
Ref country code: GB Free format text: LAPSE BECAUSE OF NON-PAYMENT OF DUE FEES Effective date: 20180826 |