EP1073000A2 - Produce recognition system and method - Google Patents
Produce recognition system and method Download PDFInfo
- Publication number
- EP1073000A2 EP1073000A2 EP00306156A EP00306156A EP1073000A2 EP 1073000 A2 EP1073000 A2 EP 1073000A2 EP 00306156 A EP00306156 A EP 00306156A EP 00306156 A EP00306156 A EP 00306156A EP 1073000 A2 EP1073000 A2 EP 1073000A2
- Authority
- EP
- European Patent Office
- Prior art keywords
- produce
- data
- items
- item
- library
- Prior art date
- Legal status (The legal status is an assumption and is not a legal conclusion. Google has not performed a legal analysis and makes no representation as to the accuracy of the status listed.)
- Withdrawn
Links
Images


Classifications
-
- G—PHYSICS
- G06—COMPUTING OR CALCULATING; COUNTING
- G06V—IMAGE OR VIDEO RECOGNITION OR UNDERSTANDING
- G06V20/00—Scenes; Scene-specific elements
- G06V20/60—Type of objects
- G06V20/68—Food, e.g. fruit or vegetables
-
- G—PHYSICS
- G06—COMPUTING OR CALCULATING; COUNTING
- G06F—ELECTRIC DIGITAL DATA PROCESSING
- G06F18/00—Pattern recognition
- G06F18/20—Analysing
- G06F18/24—Classification techniques
- G06F18/241—Classification techniques relating to the classification model, e.g. parametric or non-parametric approaches
- G06F18/2413—Classification techniques relating to the classification model, e.g. parametric or non-parametric approaches based on distances to training or reference patterns
- G06F18/24133—Distances to prototypes
- G06F18/24137—Distances to cluster centroïds
-
- G—PHYSICS
- G06—COMPUTING OR CALCULATING; COUNTING
- G06F—ELECTRIC DIGITAL DATA PROCESSING
- G06F2218/00—Aspects of pattern recognition specially adapted for signal processing
- G06F2218/12—Classification; Matching
Definitions
- the present invention relates to product checkout devices and more specifically to a produce recognition system and method.
- Bar code readers are well known for their usefulness in retail checkout and inventory control. Bar code readers are capable of identifying and recording most items during a typical transaction since most items are labeled with bar codes.
- Bar code readers may include a scale for weighing produce items to assist in determining the price of such items. But identification of produce items is still a task for the checkout operator, who must identify a produce item and then manually enter an item identification code. Operator identification methods are slow and inefficient because they typically involve a visual comparison of a produce item with pictures of produce items, or a lookup of text in table. Operator identification methods are also prone to error, on the order of fifteen percent.
- the present invention resides in a produce recognition system including a produce data collector, a library, and a computer.
- the produce data collector collects first data from the produce item.
- the library contains second data associated with classes of produce items.
- the computer reads the second data from a library, determines a distance measure of likeness value between the first data and each of the second data, determines third data and a corresponding class of produce items from the second data which produces a smallest distance measure of likeness value, and identifies the produce item to be within the corresponding class of produce items.
- the invention resides in a method of recognizing a produce item including the steps of collecting first data from the produce item, reading a number of second data associated with a plurality of produce items including the one produce item from a library, determining a distance measure of likeness value between the first data and each of the second data, determining third data and a corresponding produce item from the second data which produces a smallest distance measure of likeness value, and identifying the produce item to be the corresponding produce item.
- the identification step may optionally include the steps of ordering the distance measure of likeness values by size, displaying a list of the ordered distance measure of likeness values and corresponding names of produce items to an operator, and recording an operator choice for a produce item from the list.
- the distance measure of likeness test for identifying produce items may be applied to other identification tasks in which sampled data is compared to reference data.
- the system and method identifies produce items by comparing their spectral data with the spectral data of items within classes of produce items.
- a distance measure of likeness (DML) value is defined, which corresponds to the likelihood that an unknown instance is in a given class.
- the distance measure of likeness (DML) values are sorted in ascending order and the item with smallest distance is chosen as the most likely identification.
- the invention resides in a method of building a library of item data for use in recognizing items comprising the steps of:
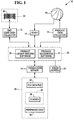
- transaction processing system 10 includes bar code data collector 12, produce data collector 14, and scale 16.
- Bar code data collector 12 reads bar code 22 on merchandise item 32 to obtain an item identification number, also know as a price look-up (PLU) number, associated with item 32.
- Bar code data collector 12 may be any bar code data collector, including an optical bar code scanner which uses laser beams to read bar codes. Bar code data collector 12 may be located within a checkout counter or mounted on top of a checkout counter.
- Produce data collector 14 collects data for produce item 18 or any other non-barcoded merchandise item. Such data may include color and color distribution data, size data, shape data, surface texture data, and aromatic data. Each sample of data represents an instance to be processed by produce recognition software 21.
- Classification library 30 is a data library derived from previously collected and processed produce data. It contains information of different produce items, or classes, each of which is associated with a PLU number. In general, a classification library contains information of various classes 36, with each class 36 representing an identifiable produce item.
- Reference data 38 is device-dependent data for data reduction steps.
- data 38 includes calibration information and pixel-to-wavelength mapping and interpolation information used in the data reduction process.
- operation of produce data collector 14 may be self-activated when produce item blocks the ambient light from entering window 60 (Fig. 2), or initiated by placement of produce item 18 on scale 16 or by operator commands recorded by touch screen 23 (or other input device).
- Scale 16 determines a weight for produce item 18.
- Scale 16 works in connection with bar code data collector 12, but may be designed to operate and be mounted separately.
- Scale 16 sends weight information for produce item 18 to transaction terminal 20 so that transaction terminal 20 can determine a price for produce item 18 based upon the weight information.
- Bar code data collector 12 and produce data collector 14 operate separately from each other, but may be integrated together. Bar code data collector 12 works in conjunction with transaction terminal 20 and transaction server 24.
- transaction terminal 20 obtains the item identification number from bar code data collector 12 and retrieves a corresponding price from PLU data file 28 through transaction server 24.
- transaction terminal 20 executes produce recognition software 21 which obtains produce characteristics from produce data collector 14, identifies produce item 18 by comparing produce data in classification library 30 with collected produce data, retrieves an item identification number from classification library 30 and a corresponding price from PLU data file 28.
- identification of produce item 18 may be handled by transaction server 24.
- Transaction server 24 receives collected produce characteristics and compares them with produce data in classification library 30. Following identification, transaction server 24 obtains a price for produce item 18 and forwards it to transaction terminal 20.
- Transaction terminal 20 (or other available computer connected to transaction terminal 20 through the in-store network) also executes produce library building software 34, which builds library 30.
- Storage medium 26 preferably includes one or more hard disk drives.
- PLU data file 28 and classification library 30 are stored within storage medium 26, but either may also be located instead at transaction terminal 20, or bar code data collector 12.
- Reference data 38 is also stored within storage medium 26, but may also be stored within produce data collector 14.
- produce recognition software 21 may additionally display candidate produce items for operator verification.
- Produce recognition software 21 preferably arranges the candidate produce items in terms of probability of match and displays them as text and/or color images on an operator display of transaction terminal 20. The operator may accept the most likely candidate returned by or override it with a different choice.
- FIG. 2 an example produce data collector 14 which relies on spectroscopic analysis is illustrated. Other types of produce data collectors are also envisioned.
- Example produce data collector 14 primarily includes light source 40, spectrometer 51, control circuitry 56, transparent window 60, and housing 62.
- Light source 40 produces light 70.
- Light source 40 preferably produces a white light spectral distribution, and preferably has a range from four hundred 400nm to 700nm, which corresponds to the visible wavelength region of light.
- Light source 40 preferably includes one or more light emitting diodes (LEDS).
- LEDS light emitting diodes
- a broad-spectrum white light producing LED such as the one manufactured by Nichia Chemical Industries, Ltd., is preferably employed because of its long life, low power consumption, fast turn-on time, low operating temperature, good directivity.
- Alternate embodiments include additional LEDs having different colors in narrower wavelength ranges and which are preferably used in combination with the broad-spectrum white light LED to even out variations in the spectral distribution and supplement the spectrum of the broad-spectrum white light LED.
- light sources 40 are also envisioned by the present invention, although they may be less advantageous than the broad spectrum white LED.
- a tungsten-halogen light may be used because of its broad spectrum, but produces more heat.
- a plurality of different-colored LEDS having different non-overlapping wavelength ranges may be employed, but may provide less than desirable collector performance if gaps exist in the overall spectral distribution.
- Spectrometer 51 includes light separating element 52, photodetector array 54.
- Light separating element 52 splits light 76 in the preferred embodiment into light 80 of a continuous band of wavelengths.
- Light separating element 52 is preferably a linear variable filter (LVF), such as the one manufactured by Optical Coating Laboratory, Inc., or may be any other functionally equivalent component, such as a prism or a grating.
- LPF linear variable filter
- Photodetector array 54 produces waveform signals 82 containing spectral data.
- the pixels of the array spatially sample the continuous band of wavelengths produced by light separating element 52, and produce a set of discrete signal levels.
- Photodetector array 54 is preferably a complimentary metal oxide semiconductor (CMOS) array, but could be a Charge Coupled Device (CCD) array.
- CMOS complimentary metal oxide semiconductor
- CCD Charge Coupled Device
- Control circuitry 56 controls operation of produce data collector 14 and produces digitized produce data waveform signals 84.
- control circuitry 56 includes an analog-to-digital (A/D) converter.
- a twelve bit A/D converter with a sampling rate of 22-44kHz produces acceptable results.
- Transparent window 60 includes an anti-reflective surface coating to prevent light 72 reflected from window 60 from contaminating reflected light 74.
- Housing 62 contains light source 40, spectrometer 51, photodetector array 54, control circuitry 56, and transparent window 60.
- Control circuitry 56 turns on light source 40.
- Light separating element 52 separates reflected light 74 into different wavelengths to produce light 80 of a continuous band of wavelengths.
- Photodetector array 54 produces waveform signals 82 containing produce data.
- Control circuitry 56 produces digitized produce data signals 84 which it sends to transaction terminal 20. Control circuitry 56 turns off light source 40 and goes into a wait state.
- Transaction terminal 20 uses produce data in digitized produce data signals 84 to identify produce item 18.
- produce data consists of digitized waveforms which transaction terminal 20 compares to a library of digitized waveforms stored within classification library 30. After identification, transaction terminal 20 obtains a unit price from PLU data file 28 and a weight from scale 16 in order to calculate a total cost of produce item 18. Transaction terminal 20 enters the total cost into the transaction.
- Classification library 30 is derived from previously collected and processed produce data.
- a classification library contains information of various classes 36, with each class 36 representing an identifiable produce item. For example, bananas, golden delicious apples, and white potatoes are three different classes.
- Each class 36 is uniquely identified by a class number, which may be associated with one or more PLU numbers. If a class number is associated with more than one PLU number, the additional PLU numbers represent a produce item which is similar except for different non-classifiable features. These features include cultivation methods (regular verses organic), ripening methods (regular verses vine-ripened or tree-ripened), seeded verses seedless, etc. Since non-classifiable features are normally not discernable by visually examining produce items, their identification will have to be accomplished using additional means, such as stickers, color-coded rubber bands, etc.
- produce size becomes another non-distinguishable feature. Since most stores charge different prices for produce items which differ in these non-distinguishable features, such a class 36 contains produce items 18 having different price lookup (PLU) numbers.
- PLU price lookup
- a class 36 with multiple PLU numbers is expanded into multiple choices when presented to the operator in the user interface, and the operator identifies a produce item 18 by its non-distinguishable features.
- a second method involves additional operator input. After the operator selects the correct class 36, produce recognition software 21 prompts the operator to enter non-distinguishable features for produce item 18, e.g., through a pop-up window on a graphic user interface.
- produce recognition software 21 compares DML values between an unknown instance (i.e., waveform sample) and all classes 36 within library 30 to yield a list of candidates for produce item 18, beginning with the candidate having the smallest DML value.
- unknown instance i.e., waveform sample
- DML distance measure of likeness
- each instance is a point in the N-dimensional space, where N is the number of parameters that are used to describe the instance.
- the distance between two instances, d ( P 1 , P 2 ) measures how far apart the two instances are in the N-dimensional space.
- instance points are measured from all the items of a class. There are enough instances from all items for all instance points to be spread in a practically definable volume in the N-dimensional space or for the shape and size of this volume to completely characterize the appearances of all the items of the class.
- the shape of this volume may be regular, like a ball in three dimensions, and it may be quite irregular, like a dumbbell in three dimensions.
- a class is not only best described in N-dimensional space, but also is best described statistically, i.e., each instance is a random event, and a class is a probability density distribution in a certain volume in N-dimensional space.
- Fig. 3 where the probability density for finding a random event on the 2-dimensional plane is plotted as a mesh surface and also contoured at the bottom of the figure.
- the falling-off of probability density for a given class can be verified by looking at the histogram of the distances between instance P t and all the instance points that are randomly sampled for the class.
- FIG. 4 A first ideal example in 2-dimensional space is shown in Fig. 4.
- each class can be represented by a symmetric probability distribution, i.e., all contour lines in Fig. 3 are circles.
- the distribution can be characterized by a typical distance scale d s , which is a radius of one of the contour lines in Fig. 3. It can be regarded as a distance from the typical instance beyond which the probability density is significantly lower than inside it.
- An unknown instance P happens to be in the overlapping area of two classes 36, C 1 and C 2 .
- the unknown instance P could belong to either class.
- Using a simple distance measure does not help identify the likely class, since instance P is about equal distances d 1 and d 2 away from typical instances P t1 and P t2 .
- instance P is more likely to belong to class C 2 than class C 1 , since d 2 d s 2 ⁇ d 1 d s 1 .
- instance P is closer to the typical instance P t2 of class C 2 than to the typical instance P t1 of class C 1 .
- FIG. 5 A second example in 2-dimensional space is shown in Fig. 5.
- This example illustrates an asymmetric distribution, since the distribution may not always be symmetric. For example, if the distribution is due to measurement error, the error might be larger near the red end of the spectrum than the blue end. In fact, the intrinsic color variation of most classes 36 is non-uniform across the spectral range. For asymmetric distributions, a distance scale for the x- and y-dimensions must be defined.
- a generalized distance measure for symmetric and asymmetric distributions in 2-dimensional space is herein defined.
- This distance measure is a Distance Measure of Likeness (DML) for an unknown instance P(x, y) relative to a class C j : where P tj (x tj ,y tj ) is a typical instance of class C j , and d xj and d yj are typical distance scales for class C j in x- and y-dimensions, respectively.
- DML Distance Measure of Likeness
- DML definition is extended to N-dimensional space: where P(x 1 ,x 2 ,...,x N ) is an unknown instance, P tj (x t1j ,x t2j ,...,x tNj ) is a typical instance for the j-th class, d ij are the distance scales, and where D j is the distance measure between instance P and the class defined by typical instance P tj and the corresponding distance scales.
- the class with the smallest DML value D j corresponds to the most likely identification.
- the instance point is defined by the reduced spectral data. While the raw, pixel based, data may be used for building a classification library, it is much preferred to reduce the data first because the raw data are usually strongly dependent on the specific device.
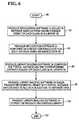
- Fig. 6 a method of building a classification library, such as library 30, is illustrated in detail, beginning with START 90.
- step 92 produce recognition software 21 collects instance samples from known produce items 18 from each class 36 in library 30. Classes 36 are pre-defined.
- step 94 produce recognition software 21 performs a data reduction procedure for each instance using reference data 38 (Fig. 8).
- step 96 produce library building software 34 computes typical instances and corresponding distance scales for each class 36.
- step 98 produce library building software 34 builds library 34 with typical instance and distance scale data, in addition to the instance data.
- produce library building software 34 stores the library in storage medium 26 so that it may be loaded by produce recognition software 21.
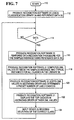
- step 112 produce recognition software 21 loads classification library 30 and reference data 38.
- step 114 produce recognition software 21 waits for data from produce data collector 14.
- Produce data collector 14 produces a sampled instance from an unknown produce item 18 following automatic or manual triggering. Operation proceeds to step 116 following produce data collection.
- produce data collector 14 illuminates produce item 18, splits light collected from produce item 18 into a plurality of different light portions having different wavelengths, converts energy in the plurality of light portions into a plurality of electrical signals, and digitizes the plurality of electrical signals to produce a digital spectrum.
- the sample spectrum represents a sampled instance.
- step 116 produce recognition software 21 performs data reduction on the sampled instance (Fig. 8).
- step 118 produce recognition software 21 computes DML values between the samples instance and typical instances for all classes in library 30.
- step 120 produce recognition software 21 sorts the DML values in ascending order and determines a predetermined number of likely choices.
- step 122 produce recognition software 21 displays the number of likely choices in ascending order of their DML values.
- step 124 produce recognition software 21 records an operator choice for produce item 18 through touch screen 23.
- Transaction terminal 20 uses the identification information to obtain a unit price for produce item 18 from transaction server 24.
- Transaction terminal 20 determines a total price by multiplying the unit price by weight information from scale 16. Operation returns to step 114 to prepare for another produce item.
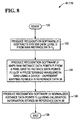
- Fig. 8 a data reduction method used to build produce library 30 and process produce data during a transaction is illustrated beginning with START 130.
- step 132 produce recognition software 21 subtracts the system dark level D from the raw instance data F 0 .
- Dark level D is the illumination level in produce data collector 14 with window 60 covered.
- step 134 produce recognition software 21 maps raw instance data points F i from a pixel grid to instance data points F( ⁇ ) j of a predetermined wavelength grid (e.g., 400nm to 700nm over 5nm intervals) using a device-dependent mapping formula in reference data 38: where P is the number of pixels in the pixel grid and N is the number of preset wavelengths.
- the device-dependent mapping formula is stored in reference data 38.
- step 136 produce recognition software 21 normalizes instance data points F( ⁇ ) j using calibration information stored in reference data 38.
- step 138 the process ends.
- an analysis of DML values provides an appropriate measure for identifying produce items.
- the technique may be applied equally well to identify other items.
- spectral data it may be applied to any data type or combination of data types with the same effect. That is, the instance point vector is just an abstract set of numbers, it may consist of one type or a number of different types of data: spectral data, physical dimensions, surface texture measures, weight, etc., and these data may be reduced in different ways or remapped to different spaces.
Landscapes
- Engineering & Computer Science (AREA)
- Theoretical Computer Science (AREA)
- Data Mining & Analysis (AREA)
- General Physics & Mathematics (AREA)
- Physics & Mathematics (AREA)
- Bioinformatics & Cheminformatics (AREA)
- Life Sciences & Earth Sciences (AREA)
- Artificial Intelligence (AREA)
- Multimedia (AREA)
- Bioinformatics & Computational Biology (AREA)
- Computer Vision & Pattern Recognition (AREA)
- Evolutionary Biology (AREA)
- Evolutionary Computation (AREA)
- General Engineering & Computer Science (AREA)
- Image Analysis (AREA)
- Cash Registers Or Receiving Machines (AREA)
Abstract
Description


Claims (8)
- A method of identifying a produce item comprising the steps of:obtaining first data relating to the produce item to be identified;reading second data associated with a plurality of individual produce items or classes of produce items from a library of produce data;determining a distance measure of likeness value between the first data relating to the produce item to be identified and the second data stored in the library of data;determining from the second data a corresponding item or class of items which produces a smallest distance measure of likeness value; andidentifying the item to be the corresponding item or to be within the corresponding class of items.
- A method according to claim 1, wherein the first data is obtained from the produce item to be identified.
- A method according to claim 2, wherein the step of identifying comprises the substeps of:ordering the distance measure of likeness values by size;displaying a list of the ordered distance measure of likeness values and corresponding names of produce items to an operator; andrecording an operator choice for a produce item from the list.
- A method of recognizing a produce item comprising the steps of:reading a library of reference produce data, including typical produce data for a plurality of different produce items;initiating operation of a produce data collector;collecting first data from the produce item to be recognized;performing data reduction on the first data to produce second data;determining distance measure of likeness values between the second data and typical produce data in the library of reference produce data;sorting the distance measure of likeness values by size;building a list including a predetermined number of smallest distance measure of likeness values and corresponding names of produce items;displaying the list; andrecording an operator choice for one of the names from the list.
- A produce recognition system comprising:a produce data collector which collects first data from a produce item;a library containing second data associated with classes of produce items; anda computer which reads the second data from a library, determines a distance measure of likeness value between the first data and each of the second data, determines third data and a corresponding class of produce items from the second data which produces a smallest distance measure of likeness value, and identifies the produce item to be within the corresponding class of produce items.
- The produce recognition system as recited in claim 6, wherein on the second data comprises:produce data for produce items in the classes;typical produce data for the classes; andtypical distance scale data for typical produce data.
- A produce recognition system according to claim 5, wherein on determining the third data and the corresponding class of produce items from the second data which produces a smallest distance measure of likeness value, the computer sorts the distance measure of likeness values by size, builds a list including a predetermined number of smallest distance measure of likeness values and corresponding classes of produce items, displays the list, and records an operator choice for one of the classes from the list.
- A method of building a library of item data for use in recognizing items comprising the steps of:defining classes for describing the items;collecting instance samples from known items in each class;determining typical instances for each class;determining distance scales for the typical instances;storing the instance samples, the typical instances, arid the distance scales in a library.
Applications Claiming Priority (2)
| Application Number | Priority Date | Filing Date | Title |
|---|---|---|---|
| US362488 | 1999-07-28 | ||
| US09/362,488 US6529855B1 (en) | 1999-07-28 | 1999-07-28 | Produce recognition system and method |
Publications (2)
| Publication Number | Publication Date |
|---|---|
| EP1073000A2 true EP1073000A2 (en) | 2001-01-31 |
| EP1073000A3 EP1073000A3 (en) | 2005-01-05 |
Family
ID=23426316
Family Applications (1)
| Application Number | Title | Priority Date | Filing Date |
|---|---|---|---|
| EP00306156A Withdrawn EP1073000A3 (en) | 1999-07-28 | 2000-07-19 | Produce recognition system and method |
Country Status (3)
| Country | Link |
|---|---|
| US (1) | US6529855B1 (en) |
| EP (1) | EP1073000A3 (en) |
| JP (1) | JP2001092975A (en) |
Families Citing this family (14)
| Publication number | Priority date | Publication date | Assignee | Title |
|---|---|---|---|---|
| JP4470018B2 (en) * | 2004-06-28 | 2010-06-02 | コニカミノルタセンシング株式会社 | Optical measurement system and optical property management method of sample |
| JP2009180653A (en) * | 2008-01-31 | 2009-08-13 | Musashino Corp | Article discrimination system |
| SE535853C2 (en) | 2010-07-08 | 2013-01-15 | Itab Scanflow Ab | checkout counter |
| JP5750665B2 (en) * | 2011-05-20 | 2015-07-22 | 株式会社フィッシュテイル | Product information search system, product information search method, and product information search program |
| US11288472B2 (en) | 2011-08-30 | 2022-03-29 | Digimarc Corporation | Cart-based shopping arrangements employing probabilistic item identification |
| US9595029B1 (en) * | 2012-10-04 | 2017-03-14 | Ecr Software Corporation | System and method for self-checkout, scan portal, and pay station environments |
| JP5747014B2 (en) | 2012-11-05 | 2015-07-08 | 東芝テック株式会社 | Product recognition apparatus and product recognition program |
| US10176456B2 (en) | 2013-06-26 | 2019-01-08 | Amazon Technologies, Inc. | Transitioning items from a materials handling facility |
| US10268983B2 (en) * | 2013-06-26 | 2019-04-23 | Amazon Technologies, Inc. | Detecting item interaction and movement |
| JP6851133B2 (en) * | 2014-01-03 | 2021-03-31 | ハーマン インターナショナル インダストリーズ インコーポレイテッド | User-directed personal information assistant |
| JP5802803B2 (en) * | 2014-07-07 | 2015-11-04 | 東芝テック株式会社 | Information processing apparatus and program |
| US10650368B2 (en) * | 2016-01-15 | 2020-05-12 | Ncr Corporation | Pick list optimization method |
| US10489589B2 (en) * | 2016-11-21 | 2019-11-26 | Cylance Inc. | Anomaly based malware detection |
| JP6773618B2 (en) * | 2017-09-04 | 2020-10-21 | 株式会社東芝 | Learning equipment, information processing equipment, learning methods and programs |
Family Cites Families (9)
| Publication number | Priority date | Publication date | Assignee | Title |
|---|---|---|---|---|
| US5166755A (en) | 1990-05-23 | 1992-11-24 | Nahum Gat | Spectrometer apparatus |
| JPH06510116A (en) * | 1991-04-17 | 1994-11-10 | ベミス・マニファクチュアリング・カンパニー | Method and apparatus for data point analysis |
| US5546475A (en) * | 1994-04-29 | 1996-08-13 | International Business Machines Corporation | Produce recognition system |
| US5649070A (en) * | 1995-02-17 | 1997-07-15 | International Business Machines Corporation | Learning system with prototype replacement |
| EP0727760A3 (en) * | 1995-02-17 | 1997-01-29 | Ibm | Produce size recognition system |
| US6069696A (en) * | 1995-06-08 | 2000-05-30 | Psc Scanning, Inc. | Object recognition system and method |
| CA2179338C (en) * | 1995-08-07 | 2000-04-25 | Gordon Albert Thomas | Apparatus and method for spectroscopic product recognition and identification |
| US6345109B1 (en) * | 1996-12-05 | 2002-02-05 | Matsushita Electric Industrial Co., Ltd. | Face recognition-matching system effective to images obtained in different imaging conditions |
| US6075594A (en) * | 1997-07-16 | 2000-06-13 | Ncr Corporation | System and method for spectroscopic product recognition and identification |
-
1999
- 1999-07-28 US US09/362,488 patent/US6529855B1/en not_active Expired - Lifetime
-
2000
- 2000-07-19 EP EP00306156A patent/EP1073000A3/en not_active Withdrawn
- 2000-07-28 JP JP2000228144A patent/JP2001092975A/en active Pending
Also Published As
| Publication number | Publication date |
|---|---|
| US6529855B1 (en) | 2003-03-04 |
| EP1073000A3 (en) | 2005-01-05 |
| JP2001092975A (en) | 2001-04-06 |
Similar Documents
| Publication | Publication Date | Title |
|---|---|---|
| US6606579B1 (en) | Method of combining spectral data with non-spectral data in a produce recognition system | |
| US6431446B1 (en) | Produce recognition system and method | |
| US6529855B1 (en) | Produce recognition system and method | |
| CA2179338C (en) | Apparatus and method for spectroscopic product recognition and identification | |
| Bolle et al. | Veggievision: A produce recognition system | |
| JP3369772B2 (en) | Object recognition system and method | |
| CN107767590A (en) | Automatic identification commercialization bar code electronic scale and Automatic identification method | |
| US6075594A (en) | System and method for spectroscopic product recognition and identification | |
| US6219438B1 (en) | Produce indentifier using barcode scanner and wavelet image processing and having compensation for dirt accumulated on viewing window | |
| US6310964B1 (en) | Produce size recognition system | |
| US6069696A (en) | Object recognition system and method | |
| US8320633B2 (en) | System and method for identifying produce | |
| CN114127520A (en) | Spectrometer device | |
| US6409085B1 (en) | Method of recognizing produce items using checkout frequency | |
| EP1065481A2 (en) | Produce data collector and produce recognition system | |
| AU2026203040A1 (en) | Automotive color matching system and method | |
| US6658138B1 (en) | Produce texture data collecting apparatus and method | |
| US6577983B1 (en) | Produce recognition method | |
| US6412694B1 (en) | Produce recognition system and method including weighted rankings | |
| CN116026770B (en) | White jade-green jade color classification and grading determination method, evaluation method and device | |
| CA3140200A1 (en) | System and method for object recognition under natural and/or artificial light | |
| US6601767B1 (en) | Ambient light sensing apparatus and method for a produce data collector | |
| CN119863875A (en) | Self-service cashing method, system and storage medium based on multi-mode interaction | |
| US6510994B1 (en) | Triggering method for a produce recognition system | |
| EP1041378A1 (en) | Produce recognition system including a produce data collector |
Legal Events
| Date | Code | Title | Description |
|---|---|---|---|
| PUAI | Public reference made under article 153(3) epc to a published international application that has entered the european phase |
Free format text: ORIGINAL CODE: 0009012 |
|
| AK | Designated contracting states |
Kind code of ref document: A2 Designated state(s): AT BE CH CY DE DK ES FI FR GB GR IE IT LI LU MC NL PT SE |
|
| AX | Request for extension of the european patent |
Free format text: AL;LT;LV;MK;RO;SI |
|
| PUAL | Search report despatched |
Free format text: ORIGINAL CODE: 0009013 |
|
| AK | Designated contracting states |
Kind code of ref document: A3 Designated state(s): AT BE CH CY DE DK ES FI FR GB GR IE IT LI LU MC NL PT SE |
|
| AX | Request for extension of the european patent |
Extension state: AL LT LV MK RO SI |
|
| RIC1 | Information provided on ipc code assigned before grant |
Ipc: 7G 06K 9/62 B Ipc: 7G 06K 9/00 A |
|
| 17P | Request for examination filed |
Effective date: 20050705 |
|
| AKX | Designation fees paid |
Designated state(s): DE FR GB |
|
| 17Q | First examination report despatched |
Effective date: 20071002 |
|
| STAA | Information on the status of an ep patent application or granted ep patent |
Free format text: STATUS: THE APPLICATION HAS BEEN WITHDRAWN |
|
| 18W | Application withdrawn |
Effective date: 20071031 |