Technical Field
-
This invention relates to methods and apparatus for generating service detail
records, and to monitoring systems for collecting data for these records from a network,
such as a packet data network, which is used for example to carry multimedia telephony
services as described in the International Telecommunication Union's recommendation
H.323 or the Internet Engineering Task Force's multimedia data and control architecture
including the Session Initiation Protocol (SIP). These and similar standards define a set
of protocols for establishing sessions or calls which may include one or more users and
one or more servers, communicating via one or more multimedia channels.
Background
-
The provision of multimedia communications services over a packet data network
(PDN) which may not provide quality of service guarantees has recently generated a great
deal of interest due to the success of networks based on the internet protocols (TCP/IP).
Network operators are currently trialing multimedia communications services over a
variety of packet data networks such as Internet Protocol (IP), Frame Relay (FR) and
Asynchronous Transfer Mode (ATM). A major problem is to generate service detail
records (generalised call data records), in real-time or batch-mode, which measure the
service usage of individual users and the service quality that was actually experienced by
the user.
Disclosure of Invention
-
According to one aspect of this invention there is provided a method of generating
generalised service detail records for communications (such as telephony) carried over a
packet network, comprising the steps of:
- acquiring packet network service data from packets carrying the communications;
- acquiring signalling data from a signalling protocol to identify at least one of
addressing, configuration, status and timing information for endpoints, gatekeepers
and connections involved in a call; and
- combining said packet service data and said signalling data to generate service detail
records.
-
According to another aspect of this invention there is provided a method of
discovering the network configuration of the endpoints, gatekeepers and their
relationships, for a communications service (such as telephony) carried by a PDN, by
using a passive monitoring system to capture the signalling messages involved in the
configuration and negotiation of relationships, addressing and resource allocation,
between endpoints and gatekeepers.
-
According to a further aspect of this invention there is provided a method of
generating generalised service detail records for communications carried over a packet
network, comprising the steps of:
- acquiring packet network service data for the packets carrying the communications
service;
- acquiring signalling data regarding at least one of call control, registration,
admissions, bandwidth management, call status, address translation and intelligent
network services;
- acquiring quality of service data for the service transmission level; and
- combining said service data, said signalling data and said quality of service data to
generate generalised service detail records.
-
According to another aspect of this invention there is provided a method of
monitoring a packet data sub-network (e.g. ethernet segment) or link (e.g. a T3 link
carrying IP over a Point-to-Point Protocol - PPP), comprising the steps of: monitoring at a
first location signalling messages to detect the existence of a call; and monitoring at
multiple other locations to identify some or all packets associated with the call (in H.323,
the Call ID can be used to identify all packets associated with a given call). The captured
packets may include both signalling data and data from multimedia streams associated
with the call. It may be required for wire-tap applications, for example, to use the
signalling data to identify calls of interest, and then capture the entire multimedia stream.
It may be necessary to buffer captured packets at each location to ensure that all packets
associated with the call could be captured.
-
In addition, the packets associated with a conference call can be correlated
together to form a service record for a conference call. This can be achieved by capturing
all packets with the same conference ID in H.323, for example.
-
In some cases it may be desirable to monitor additional signalling messages, e.g.
Signalling System No.7 (SS7) protocol messages or Integrated Services Digital Network
(ISDN) messages, on signalling links in a switched circuit network (such as the public
switched telephone network - PSTN) coupled to said packet data network, or Media
Gateway Control protocol messages (for example MGCP or SGCP) which are used to
control the gateway connection between the SCN and the PDN, to derive additional
monitoring data, and correlate those additional monitoring data with at least some of first
monitoring data. These can be correlated to the original call by using characteristics such
as calling or called party numbers to identify the call.
-
Thus the invention can involve monitoring the control channels used for initiation,
modification and termination of multimedia sessions, and may include the monitoring of
the multimedia channels themselves, to provide a service detail record for a session.
-
The invention enables a network operator to generate service detail records on a
pure PDN, or on a hybrid network of interconnected PDNs and switched circuit networks
(SCNs). There is also described a method for automatically discovering the network
configuration information, including addressing and identifying the relationships between
gatekeepers and endpoints.
Brief Description of Drawings
-
Methods and apparatus in accordance with this invention for generating telephone
service detail records will now be described, by way of example, with reference to the
accompanying drawings, in which:
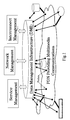
- Figure 1
- shows a distributed monitoring system for a PDN carrying
multimedia voice services;
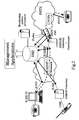
- Figure 2
- shows examples of extensions of this architecture to correlate data
from the PDN with signalling data from the SCN;
- Figure 3
- shows the sequence of message types which can be captured to
construct a service detail record;
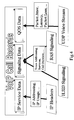
- Figure 4
- shows an example of the structure of a service record that could be
constructed from the data collected by the monitoring system;
- Figure 5
- is a flow diagram of a process for monitoring signalling messages
related to gatekeeper auto-discovery;
- Figure 6
- is a flow diagram of a process for extracting data from gatekeeper
auto-discovery messages;
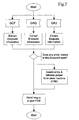
- Figure 7
- shows the relationship between the processes of Figures 5 and 6;
- Figure 8
- illustrates a failure mode which can affect the gatekeeper auto-discovery
procedure;
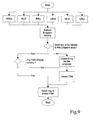
- Figure 9
- is a flow diagram of a process for monitoring signalling messages
related to registration of endpoints with gatekeepers;
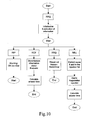
- Figure 10
- is a flow diagram of a process for extracting data from endpoint
registration messages;
- Figure 11
- is a flow diagram of a process for extracting data from endpoint
unregistration messages;
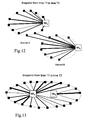
- Figure 12
- illustrates potentially anomalous registration of endpoints with a
gatekeeper in a different sub-net;
- Figure 13
- illustrates potentially anomalous load imbalance between two
gatekeepers in a sub-net;
- Figure 14
- is a flow diagram of a process for monitoring call signalling
channels;
- Figure 15
- is a flow diagram of a process for monitoring call signalling
messages;
- Figure 16
- is a flow diagram of a process for monitoring control channels; and
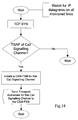
- Figure 17
- is a flow diagram of a process for monitoring call signalling
channels having dynamic TSAP identifiers.
Best Mode for Carrying Out the Invention, & Industrial Applicability
-
The distributed monitoring system shown in the drawings has the capability to
collect data from a combined PDN and SCN carrying multimedia services, correlate these
data in real-time, and provide a real-time view of services on the network. These data can
be used for applications such as troubleshooting, surveillance, security, network planning,
provision of accounting information to customers, fraud detection, billing and acquisition
of marketing information.
-
Referring to Figure 1, the probes shown are part of the distributed monitoring
system, and are passive link monitoring devices (using techniques similar to those in
existing protocol analysers for example). The distributed monitoring system is
constructed from the probes and standard computer and communications components,
with special-purpose software which provides the applications described above. A
principal function of this software is to correlate data from different probes to provide a
record or real-time trace of calls, transactions and other services as they occur on the
network. The Hewlett-Packard acceSS7 system is an example of a distributed passive
monitoring system which could be used to implement parts of the system described
above.
-
A Data Management Infrastructure (DMI) collects the data from the probes and
processes the data to produce service detail records. The DMI may consist of software
running on one or more computers, and the processing of the data and its storage may be
distributed across these computers. The service detail record generation process may be
split between the probes and the DMI. The probes may generate partial service detail
records by correlating all the information available on that probe about a particular
session, and forwarding those partial records to the DMI. The DMI is then responsible
for correlation of partial service detail records from different probes to form the final
service detail records. Alternatively the probes can forward uncorrelated data to the DMI,
and the DMI is then responsible for generating the complete service detail records. In
both cases the DMI is also responsible for the storage of the service detail records and for
providing interfaces for application programs to analyse the service detail records. This
aspect of the DMI may be implemented using data warehousing technology.
-
An example of a monitoring system architecture is given in Figure 2. This shows
probes monitoring the PDN, SS7 network and the ISDN. The SS7 probes could be for
example from the Hewlett-Packard acceSS7 system. The ISDN primary rate access
probes could for example be constructed using the same techniques as in existing protocol
analysers (such as the Hewlett-Packard 37900D Signalling Test Set). The PDN probes
could be constructed from Hewlett-Packard 4986/7 or J3457/8 LanProbes for example.
-
The distributed monitoring system is arranged to correlate real-time data from any
combination of these probes. This includes, for example, signalling data from the SS7
links, signalling from the ISDN links (e.g. the D-channel for narrowband ISDN), the
signalling data for the multimedia service from the PDN, and the multimedia stream data
(e.g. data indicating packet loss, latency or jitter). It may also include the capture of the
entire multimedia stream for applications like wire tapping or troubleshooting.
-
For convenience the invention is described primarily with reference to the H.323
recommendation, using IP as the PDN, and optionally connected to one or more SCNs
using narrowband ISDN and/or SS7 signalling with trunk connections. However, it
should be understood that this terminology is to be taken as including within its scope
analogous functionality, whether or not they are customarily identified by the terms used
in these standard recommendations.
AUTO-DISCOVERY PROCESS
-
The PDN is continuously monitored for packets that provide configuration
information on H.323 endpoints and gatekeepers. These packets may be captured to
create and maintain a database (the network discovery database) which gives
configuration information, addressing information and relationships between the
endpoints and gatekeepers. The network discovery database may also take data from
additional sources to supplement or verify the captured data. Any discrepancies between
the discovered data and the data from other sources should be used to generate an alarm
to the network operator indicating a possible network configuration problem. The details
of the data captured are described in the following paragraphs.
-
A type of transaction which is tracked by the monitoring system is the gatekeeper
discovery process. This is used by an endpoint to automatically find a gatekeeper which
will provide service to it. The monitoring system uses the data captured from the
sequence of messages between the endpoint and the gatekeeper, to identify endpoints and
gatekeepers and to build a database of the relationships between endpoints and
gatekeepers. The database stores information derived from the captured data which
identifies the endpoint and gatekeeper. This includes the network addresses and port
numbers. The monitoring system monitors continuously for endpoint discovery attempts,
to maintain an accurate database of the network configuration. This monitoring process
is described in more detail below with reference to Figures 5 to 8.
-
The endpoint may go through a registration process with its gatekeeper. This
process may be repeated periodically if the registration has a finite lifetime. The
monitoring system monitors the network continuously for packets involved in the
registration process. The monitoring system captures the relevant packets and uses the
data relating to the endpoint and gatekeeper to update and add information to the
database. This typically includes any transport addresses (transport address = (Network
address, Transport layer Service Access Point (TSAP) or port number)), any alias
addresses and any other addressing or configuration information associated with the
endpoint or gatekeeper.
-
Endpoints may also request from a gatekeeper location information for an
endpoint for which it has the alias. The monitoring system will continuously monitor for
the exchange of packets associated with this location process and capture data from the
relevant packets. This data can be used to update or add information to the network
discovery database that identifies the relationship between aliases, transport addresses and
any other addressing or configuration information. This may include information which
identifies how to connect to a destination on the SCN (e.g. E.164 addresses). More
details of monitoring of the registration process are given below with reference to Figures
9 to 13.
-
Access tokens may be used to enable an endpoint to hide its transport address
from the endpoint to which it is establishing communication. The monitoring system will
continuously monitor the network to capture packets that are used in the process of
distributing access tokens to endpoints. The captured data is used to add to or update
information in the network database indicating the association between an access token
and an endpoint.
GENERATION OF SERVICE RECORDS
-
This section lists the types of fields in service records, and describes how the
distributed monitoring system could provide the required data. A service record is
generated for each instance of the usage of a specific service. This is a generalisation of a
call record, which is generated by current switches. A service is normally defined from
the perspective of the user. The service may actually involve a number of calls or
transactions, for example. In the case where only the PDN is being monitored, these
service records include data from the signalling between any combination of gateways,
gatekeepers, terminals and multi-point controllers; and data from the multimedia streams
controlled by this signalling. In the case where the SCNs connected to the PDN are being
monitored, the service record will also include data from the signalling data on the SCN
collected from the probes connected to the SCN. The network discovery database may be
used in constructing the service records to fill any address or configuration information
which is not available directly from the packets involved in the call.
-
Figure 3 shows an example of the sequence of packets which may be captured at
different levels in the overall stack of protocols (such as Q.931, H.245 and an unreliable
datagram protocol - UDP) to provide a service detail record. Figure 4 illustrates how the
information from these different parts of the overall transaction can be used to contribute
to different respective parts of a service detail record.
1. Calling Party Information.
-
This includes any information which can be derived about the calling party from
the signalling data flowing on the PDN, and is therefore available to the link monitoring
probes. Typical information includes: calling party number; any ISDN sub-addressing
information; calling party name; network addresses; TSAP or port numbers; alias
addresses; and any numbers or addresses related to billing. This information can be
derived from the sequence of messages used to setup a call. In the H.323
recommendation, this can be achieved by extracting the relevant fields from the Q.931
messages used in setting up the call (set-up, call proceeding, alerting, connect for
example). In the cases where one or more gatekeepers are involved the admission
signalling (H.225 ARQ and ACF messages for example) between gatekeeper and
endpoint is captured to identify the logical channel for call signalling. The logical
channel is typically identified using the transport address.
-
Additional information may be derived from call setup messages on the ISDN D
channels of an interconnected SCN, at either the originating or terminating end or both;
and/or from call setup messages on any of the SS7 links of the SCN. Additional
information may also be derived from any intelligent network service messages that flow
over the SS7 links as part of the specific service usage.
2. Called Party Information.
-
As for calling party information, but replace calling party by called party.
3. Information on each party in a conference.
-
The equivalent data to the calling party information for each party in a conference,
with additional information on the conference objective (join conference, create
conference or invite for example) and a means to identify the conference (Conference ID
for example).
4. Network Routing and Logical Channel Information.
-
This may include any information on the network resources which were used to
provide this specific service usage. The following are examples of data which might be
provided:
- logical channels associated with the call and their identifiers,
- the requested media, codecs (coder/decoders), service quality and bandwidth for each
channel,
- the negotiated media, codecs, service quality and bandwidth for each channel,
- any other performance or configuration data on the channels which are requested or
established during the call or conference.
Each of these uses is time-stamped, and the sequence and nature of the use indicated.
These data can be obtained in a similar way as was described for item 1 above from the
capture of packets carrying signalling information. More specifically the logical channels
can be identified by using the fields within an OpenLogicalChannel structure within
certain messages defined in H.323 and associated recommendations. Subsequent
messages which control the logical channels are also monitored and any changes in
channel configuration can be time stamped and added to the service record.
-
A important additional set of information is the measured quality of service and
bandwidth usage on each of the logical channels set-up as part of the call. This will
typically include packet loss rates, latency and jitter measurements which are made over
selected intervals by capturing packets from the logical channels and extracting the
relevant fields.
5. Supplementary Services Information.
-
This may include any information on supplementary services used for this specific
service usage. The following are some examples of the data which may be provided:
- call forwarding indication and address information;
- interactive voice response information on the use of intelligent peripherals;
- 800 number services;
- any custom services that may be invoked during the call or conference.
This information includes time-stamps, duration and the nature of the use. These data can
be obtained in a similar way as was described for item 1 above.
6. Service Status and Termination Information.
-
This may include time-stamped information on the initiation of the service, time-stamped
information on any status changes occurring during service and time-stamped
information on the termination of the service. The termination information should
include the reasons for termination.
-
These data can be obtained in a similar way as was described for item 1 above. In
particular, the H.245 endSessionCommand message and the Q.931 call termination
messages, the call clearing messages on the SS7 links and the ISDN D channels can
provide details on the reasons for call termination.
7. Additional Service Quality Information.
-
The service quality information provided is dependent on the service indicated in
the service type field. The following gives some examples of what can be provided for
specific services.
-
Voice quality is mainly indicated by the bit error rate, jitter and delay. These
parameters can be measured using a passive monitoring system and monitoring at two
points in the network. Signalling information can be used to identify the logical channels
on the PDN, the ISDN B channels or the time slots on SCN trunks, that are carrying the
voice signals. The bit streams from each of the channels or trunk time slots identified can
be compared to derive the delay, jitter and bit error rate caused by the intermediate
networks.
8. Service Usage Information.
-
The type of usage data provided by the distributed monitoring system depends on
the specific service. Some examples follow.
-
Voice, video and fax services require call duration and used bandwidth.
-
The data oriented services require data such as total bits, frames and packets in
each direction. This may be provided for regular time intervals for the duration of the
service. It may also be broken down into a traffic matrix, where the data protocol has
additional addressing information (such as IP addresses). The data are obtained in a
similar way as is described for item 1 above.
9. Security Information.
-
A particular instance of service usage may be an attempt to obtain unauthorised
access to resources. The service record includes information which may indicate this
type of behaviour. This may include information about the duration of call, the way the
call was terminated and details of the service used.
-
An example would be where there are repeated failed attempts to gain access to
different resources.
REAL-TIME UPDATES ON SERVICE USE
-
The data that populates the service records described in the previous section can
be collected in real-time from the monitoring probes. These data can be provided in real-time
on remotely connected computers, as they become available. A user of the
distributed monitoring system can apply filtering criteria on any of the information
described in the previous section, to select those instances of service use for which real-time
updates are required.
WIRE-TAP CAPABILITY
-
Any of the data extracted from the signalling messages can be used to match
criteria set by the user of the monitoring system and trigger some or all of the logical
channels to be captured in their entirety. This technique can be used to provide a wire-tap
capability, which would allow real-time copies of the media streams to be routed through
the monitoring system to a third party, or stored for analysis. The filtering could also be
on characteristics in the media stream (for example, a specific spoken word in an audio
stream) which, if matched, would trigger the capture of all the service record information
from the signalling messages, as described earlier.
APPLICATIONS
-
The following applications can be implemented using the data from the service
records described above or the real-time service updates. Data from other sources may be
used to enhance the effectiveness of these applications.
A. Quality of Service and Service Level Agreements.
-
The service records described above can be used to provide service quality
information on selected customer's service. This can be used to track conformance to
service level agreements, and be provided to the customer as an additional service. It can
be provided as periodic reports, or in real-time using the real-time updates described
above.
B. Surveillance and Troubleshooting for Network Operations.
-
The service records and real-time updates can be used to identify service or
network faults. The information can also be used to troubleshoot the faults.
C. Fraud Detection.
-
The service records and real-time updates can be used to identify potential
fraudulent use of the network or service. Indications may include excessive use of high
value services, unusual call termination behaviour and repeated failures to gain access to
a service. The distributed monitoring system may be used to track the service usage of
potential high-risk users in real-time.
D. Security and Hacking Detection
-
Potential security threats can be identified by repeated failures to gain access to a
service. They also may be indicated by successful access to sensitive services, such as
maintenance ports on customer premises equipment (CPE). This type of data is available
from the service records and the real-time updates.
E. Billing Data
-
The service records can be used as a basis for billing which is dependent on any of
the fields in the service record. This allows, for example, billing to be based on the actual
service quality delivered. It also enables billing to reflect the nature and generation of the
usage of resources on the network, such as intelligent peripherals and databases. The
billing data could be made available in real-time.
F. Customer Accounting Data
-
The detailed service usage information in the service records can be provided to
customers for use in their internal accounting. This includes the traffic matrix
information for packet and frame based protocols, which the system derives from the B
and D ISDN channels.
G. Customer and Telecom Operator Network Planning
-
The service records can provide detailed information on the use of network
resources which can be provided to network planning departments within the operator
and the customer.
H. Wire-tap
-
The wire-tap capability described above can be used to provide wire tap services
to authorized third parties, and potentially as a trouble shooting tool.
MONITORING OF H.323 GATEKEEPER DISCOVERY TRANSACTIONS
-
As noted above, the gatekeeper discovery process is the process an endpoint uses
to determine which H.323 gatekeeper to register with. The process can be performed
manually or automatically. Manual discovery relies on information provided
independently to the endpoint, and analysis of the endpoint registration procedure in this
case can be used to identify inconsistencies in the available information.
-
The discovery process starts when an endpoint multicasts a Gatekeeper Request
message (GRQ) to a predetermined address (Discovery Multicast Address). On receipt of
such a message a gatekeeper can either accept (Gatekeeper Confirmation message - GCF)
or reject (Gatekeeper Reject message - GRJ) the request.
-
If several gatekeepers responds positively with GCF messages to the GRQ
message, the endpoint is free to choose among them arbitrarily. In this case, analysis of
the choice of gatekeeper can usefully reveal if a suitable choice was made, or it can be
used to verify assignment policies set by system managers. Analysis of the list of
alternative gatekeepers is also worthwhile since it can provide information about network
redundancy.
-
Rejection messages and no-answers to GRQ messages are valuable since they
enable verification of assignment policies as well as investigation of problems related to
multicasting.
-
Monitoring of the gatekeeper auto-discovery procedure is in this embodiment split
into two processes:
- Dispatcher process (Figure 5); and
- SigProcessing process (Figure 6).
-
Referring to Figure 5, the Dispatcher process collects all the GRQ, GCF and GRJ
signalling messages detected by the link monitoring probes and determines the endpoint
to which each refers. Then, as illustrated in Figure 7, the messages are dispatched to an
appropriate SigProcessing finite state machine (FSM) process which coordinates
assembly of the data necessary to assess the gatekeeper auto-discovery procedure in
relation to a specific endpoint. There need be only a single instance of the Dispatcher
process, but several SigProcessing processes can be active at the same time.
-
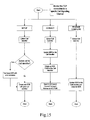
Referring to the state definition language (SDL) chart in Figure 6, the
SigProcessing process consists of an FSM which keeps track of the evolution of the
gatekeeper auto-discovery process for a specific endpoint. For the sake of clarity and
simplicity, the chart has been designed with the assumption that the monitoring system is
installed before endpoints start the gatekeeper discovery process. In practice some
endpoints might already be in the middle of the gatekeeper discovery process when the
monitoring system is first installed. In this case a GCF or GRJ message is the first to be
received in respect of such an endpoint, and the behaviour of the FSM shown in Figure 6
may be determined at the discretion of the system operator: incomplete information may
be collected or, altematively, the signalling information involved may be discarded.
-
In relation to an endpoint, the measurements that can be collected and used to
assess the overall gatekeeper auto-discovery process include:
- list of available gatekeepers (derived from GCF messages time-stamped and ordered);
- list of gatekeepers that rejected the GRQ request (derived from GRJ messages time-stamped
and ordered);
- list of altemative gatekeepers;
- alarms (no answers to GRQ messages; GRQ retransmissions too quick or too
numerous);
- warnings (RIP messages, i.e. gatekeepers too slow to answer).
The 1st GRQ and the GCF or GRJ can be time-stamped and statistics about response
times can be derived.
-
Similar statistics can be also obtained for discovery process performance from the
point of view of gatekeepers.
-
The case of endpoints that do not receive any answer to their GRQs can be worthy
of study. Two causes can be identified for this behaviour: GRQs may be sent to a
multicast address different from the predetermined Discovery Multicast Address,
revealing mis-configuration at the endpoint; or, as shown in Figure 8, there may be
configuration problems within a router causing the router to fail to forward multicast
requests from one sub-net to another. Clearly there is also the possibility of network
disruption that occurred at the time an endpoint initiated the gatekeeper discovery
procedure. For this reason it is important to keep a record of timing information since it
allows later correlation with other network events.
-
The signalling messages involved in the gatekeeper discovery procedure and, in
particular, the fields carrying key data for monitoring this procedure, are summarized
below. This summary focuses on the essential fields, though more data can be extracted
if desired from the signalling messages in order to provide more complete information
about the overall gatekeeper discovery process.
Gatekeeper Request (GRQ)
-
- reqSeqNum. This allows correlation with subsequent signalling (GCF and GRJ
messages) originated in response to this request.
- rasAddress. Transport address of the endpoint (Registration, Admission and Status -
RAS - channel).
- endpointType. This identifies the type of endpoint (useful for consistency checks).
- gatekeeperIdentifier. This should be empty. Otherwise, it contains the identifier of the
gatekeeper the endpoint is interested in registering with.
Gatekeeper Confirmation (GCF)
-
- reqSeqNum. Must be the same as in the corresponding GRQ message.
- gatekeeperIdentifier. This identifies the gatekeeper that is sending the GCF.
- rasAddress. Transport address used by the gatekeeper for registration and status
messages.
- alternateGatekeeper. Prioritised sequence of alternative gatekeepers and related RAS
addresses.
Gatekeeper Reject (GRJ)
-
- reqSeqNum. Must be the same as in the corresponding GRQ message.
- gatekeeperIdentifier. This identifies the gatekeeper that is sending the GRJ.
- rejectReason. Cause code related to this rejection.
- alternateGatekeeper. Prioritised sequence of alternative gatekeepers and related RAS
addresses.
- altGKisPermanent. This indicates if future RAS messages should be redirected to the
alternative gatekeepers or not.
MONITORING OF ENDPOINT REGISTRATION
-
The endpoint registration procedure is complementary to the gatekeeper discovery
procedure, and enables an endpoint to join a "zone" managed by a chosen gatekeeper and
inform the gatekeeper of its Transport Address and Alias addresses. Monitoring of this
procedure enables the zone managed by one gatekeeper to be independently determined.
It also allows correlation of the information gathered during monitoring of the gatekeeper
discovery procedure in order to assess the choice of specific gatekeeper by an endpoint.
-
Registration is mandatory and must be done before any call is attempted.
Furthermore, it may occur periodically according to the gatekeeper's policy. It might
happen that the frequency of the registration process is very low and that therefore
signalling related to the registration process is rarely captured. As an alternative
monitoring of the admission procedure (e.g. according to recommendation H.225) can be
used to create similar information to that gathered through monitoring of the registration
process.
-
The registration process involves only three signalling messages; usually it
follows the gatekeeper discovery process. An endpoint sends a Registration Request
message (RRQ) to a gatekeeper, using the gatekeeper's RAS address, which is known
from the previous gatekeeper discovery process. On receipt of such a message the
gatekeeper can either accept or reject the request and replies with a Registration
Confirmation (RCF) or Registration Reject (RRJ) message, respectively. Reasons for
rejection of the registration can include ambiguous registrations and security issues.
-
The registration process can be periodically repeated since each registration may
have a finite life. Moreover, updates in an endpoint's Transport Addresses and/or Alias
addresses are notified through new registrations.
-
Closely related to the registration process is the unregistration process, by which
and endpoint and a gatekeeper cancel the relationship which exists between them. Either
an endpoint or a gatekeeper can initiate it. It also consists of three messages. The
Unregister Request (URQ) message triggers the procedure. If initiated by a gatekeeper the
endpoint has to acknowledge it by replying with an Unregister Confirmation (UCF)
message. If initiated by an endpoint the gatekeeper might reply with an Unregister Reject
message (URJ). This might be due to the fact that the endpoint was not in fact previously
registered with this gatekeeper. The unregistration procedure may or may not be invoked
before a re-registration.
-
A gatekeeper must keep a one-to-one mapping between Transport and Alias
addresses. Changes of both Transport and Alias addresses at once can occur and they
should be preceded by use of the unregistration procedure.
-
Monitoring of the registration procedure is valuable for several reasons. It can
provide information needed to define zones and provide a mapping between Transport
Addresses and Aliases. Furthermore, security policies can be monitored and verified and,
eventually, fraud or fraud attempts discovered. Gatekeeper load balance can also be
usefully analysed. Finally, mapping of the endpoints that belong to a zone in conjunction
with depiction of the physical representation of the network topology (e.g. derived using
auto-discovery facilities in the Hewlett-Packard OpenView network management tool)
can be extremely useful to identify network problems such as connectivity bottlenecks or
unsuitable gatekeeper choices.
-
As mentioned earlier, the admission procedure can be used similarly to the
registration procedure to generate data about the zone discovery. In this case, algorithms
similar to those described herein can be used by replacing RRQ with ARQ, RCF with
ACF and RRJ with ARJ, respectively.
-
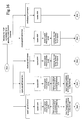
Processing of the registration and unregistration signalling is split into two. A first
Dispatcher process (shown in Figure 9) recognises if any of the registration or
unregistration messages that are captured refers to any endpoint already registered or in
the process of doing so. As illustrated by reference again to Figure 7, the Dispatcher
process also dispatches the signalling message to one of two SigProcessing processes
which extract the data necessary for zone discovery. SDL charts for these two processes
are shown in Figure 10 (registration) and Figure 11 (unregistration), respectively.
-
The measurements that can be collected in this way and used to generate data
about zones include:
- endpoint ←→ gatekeeper relationship (dynamic relationship);
- Transport Address ←→ Alias Address correspondence (dynamic relationship);
- gatekeeper load balance;
- alarms (no answers to request messages);
- warnings (RIP messages, i.e. gatekeepers too slow to answer);
- mapping of a zone over the physical network topology;
- assessment of the choice by endpoints of the gatekeeper to register with;
- analysis of rejections of registration and unregistration attempts.
The endpoint-gatekeeper relationship is a temporal relationship which has a related start
and end time. Similarly, the identification of endpoints through Alias and Transport
Addresses is dynamic and it must be associated with timestamps. Consistency checks
should preferably be carried out to verify that a unique mapping exists between an Alias
Address and the related Transport Address.
-
It is possible to highlight cases of endpoints that do not receive any answer to
RRQ or URQ messages. This might be due, for example, to the use of an incorrect
gatekeeper RAS address. The information gathered about the registration procedure can
be used to assess the choice of gatekeeper with which endpoints register and, ultimately,
to determine abnormal configurations.
-
Moreover, it is useful to map zones relative to physical network topologies. For
example, Figure 12 shows two sub-nets, each with a gatekeeper and several endpoints.
More specifically, two endpoints in the sub-net A are registered with a gatekeeper GKB
that is associated with another sub-net, sub-net B. This may be a desirable behaviour
justified by gatekeeper load balancing policies. However, it might also be anomalous
behaviour.
-
With regard to gatekeeper load balance, Figure 13 shows schematically the traffic
between the endpoints and the gatekeepers on the same sub-net. Clearly load imbalance
exists between the two gatekeepers. As in the previous case, this may be a desirable
behaviour. But it might also reveal the existence of a situation that does not match the
desired policy put in place by the system administrator.
-
Rejection messages, such as RRJ or URJ, can be useful to highlight either
configuration or security related problems, e.g. fraud attempts.
-
The signalling messages involved in the registration and unregistration procedure
and, in particular, the fields that carry the key data for the monitoring of these procedures,
are summarized below:
Registration Request (RRQ)
-
- requestSeqNum. Monotonically increasing number unique to the sender.
- discoveryComplete. Set to TRUE if the registration follows the gatekeeper discovery
process. It could happen that when a registration ages, the gatekeeper discovery has to
be invoked before attempting a new registration. This is one possible reason for
rejecting an RRQ or ARQ.
- callSignalAddress. Call signalling address for the endpoint.
- rasAddress. Transport address of the endpoint (RAS channel).
- terminalType. This identifies the type of endpoint (useful for consistency checks).
- terminalAlias. This should be empty. Otherwise, it contains a list of Aliases to
identify the endpoint.
- GatekeeperIdentifier. The gatekeeper with which the terminal wishes to register.
- alternateEndpoints. A sequence of endpoint alternatives for CallSignallingAddress,
rasAddress, terminalType, or terminalAlias.
Registration Confirmation (RCF)
-
- requestSeqNum. Same value as for the RRQ.
- callSignalAddress. Transport Addresses for H.255.0 signalling.
- terminalAlias. A list of Alias Addresses assigned by the gatekeeper by which other
terminals identify the endpoint.
- GatekeeperIdentifier. The gatekeeper that has accepted the endpoint registration.
- timeToLive. Duration of the validity of the registration.
- preGrantedARQ. Special pre-granted permission to make phone calls.
Registration Reject (RRJ)
-
- requestSeqNum. Same value as for the RRQ.
- rejectReason. The reason for the rejection of the registration.
- GatekeeperIdentifier. The gatekeeper that has rejected the endpoint registration.
- altemateGatekeeper. Sequence of prioritised alternative gatekeepers with which to
retry requests.
- altGKisPermanent. True or False. Indicates if all subsequent messages are to be
redirected to the alternative gatekeepers.
Unregistration Request (URQ)
-
- requestSeqNum. Monotonically increasing number unique to the sender.
- callSignalAddress. Call signalling address for the endpoint.
- reason. Reason for the unregistration initiated by the gatekeeper.
Unregistration Confirmation (UCF)
-
- requestSeqNum. Same value as for the URQ.
Unregistration Reject (URJ)
-
- requestSeqNum. Same value as for the URQ.
- rejectReason. The reason for the rejection of the unregistration.
- alternateGatekeeper. Sequence of prioritised alternative gatekeepers with which to
retry requests.
- altGKisPermanent. True or False. Indicates if all subsequent messages are to be
redirected to the alternative gatekeepers.
EXAMPLE 1 - Two Endpoints Communicating Directly without a Gatekeeper
-
In this first example it is assumed that:
- the underlying network is an IP network, TCP is used to provide reliable connections
and UDP is used to provide unreliable connections;
- the two endpoints communicate directly without the use of a gatekeeper - this
simplifies the process because the Call Signalling Channel uses a "well-known"
TSAP identifier (specified in recommendation H.225); the case where the Call
Signalling Channel is identified through an interaction with a gatekeeper is described
in Example 2 below;
- there are only two endpoints, which initiate one or more audio or video connections
using Real Time Protocol (RTP);
- the call is not modified during the session, for example by adding new participants or
requesting changes in bandwidth;
- the Call Signalling Channel remains open for the duration of the session, and a
RELEASE COMPLETE message is used to terminate the session.
-
The finite state machine processes required to monitor this type of session are as
follows:
1. Call Signalling Channel FSM (see Figure 14)
-
This monitors all links continuously looking for a reliable-connection setup (for example,
the SYN of a TCP connection) using the well-known TSAP identifier for the Call
Signalling Channel. In response to a Call Signalling Channel being established, this
process initiates a new Call Signalling Message FSM (CSM-FSM - see item 2 below) to
monitor the Channel and passes to it the transport addresses of the two endpoints.
2. Call Signalling Message FSM (see Figure 15)
-
This is initiated to monitor a specific Call Signalling Channel, and is terminated when the
reliable connection is terminated for that Channel (for example, by the FYN of the TCP
connection). It continuously monitors the Channel for signalling messages. A SETUP
message indicates the start of a new call, and causes the process to create a new service
detail record (SDR) for the call. The call identifier is used to uniquely identify the service
detail record for the duration of the call, and to identify subsequent call signalling
messages. The service detail record is populated with a time stamp, and any useful fields
from the SETUP message.
-
The CONNECT message sent from the called endpoint normally carries the
transport addresses to be used for the H.245 Control Channel. In response to this
message an H.245 Control Channel FSM (HCC-FSM - see item 3 below) is started, to
monitor the H.245 signalling for the session. The service detail record is populated with
an additional time stamp if required, and any of the useful fields from the CONNECT
message.
-
A RELEASE COMPLETE message indicates the termination of the session. The
service detail record is updated with any relevant data and time stamps, and then closed.
The H.245 Control Channel FSM monitoring the H.245 signalling is terminated.
However, monitoring for subsequent signalling messages is continued in order to capture
further calls between the two endpoints.
-
The main paths in this FSM are shown in Figure 15; however in the interests of
clarity error conditions have been omitted. The capture of other signalling messages,
particularly those involved in modifying calls, could also be captured and used to update
the service detail record with additional information and time stamps. It may also be
required to initiate further FSMs to monitor other aspects of the call.
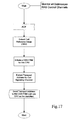
3. H.245 Control Channel FSM (see Figure 16)
-
This is initiated from the Call Signalling Message FSM and monitors all messages on the
H.245 Control Channel for the duration of the call. The FSM is terminated by the
detection of an endSessionCommand message on the H.245 Control Channel. Logical
channels are opened and closed using the openLogicalChannel and closeLogicalChannel
messages. The FSM detects the opening of a Channel, extracts the relevant data and
initiates two new FSMs to monitor the forward and reverse Real Time Control Protocol
(RTCP) connections (RS-FSMs - see item 4 below). A logical Channel is uniquely
identified by the Logical Channel Number (LCN). This is used to identify the RS-FSMs
to be terminated when the closeLogicalChannel messages are received.
-
The main process paths are indicated in Figure 16; however there are many more
messages on the Control Channel which could be captured to provide additional
information in the service detail record.
4. RTCP Session FSM
-
The RTCP connection provides detailed information on the performance of the RTP
connection that it controls. This can be captured as required to provide quality of service
information in the service detail record. The RTP stream itself may be monitored at
multiple points in its path to make quality of service measurements which can be added to
the service detail record.
EXAMPLE 2 -Endpoints Communicating via a Gatekeeper
-
When a gatekeeper is involved the Call Signalling Channel may no longer be
carried on the well-known Transport Address; instead a dynamic TSAP identifier which
the endpoint obtains from the gatekeeper may be used. The FSM for this situation is
shown in Figure 17. This process uses the information about gatekeepers and endpoints
acquired during the gatekeeper discovery process. The RAS Channel between all
gatekeepers and endpoints is continuously monitored for control messages. An
Admission Request (ARQ) followed by an Admission Confirmation (ACF) means that
the endpoint has requested to setup a call and has been allowed to do so by the
gatekeeper. The Transport Address which will be used for the Call Signalling Channel
can be obtained from the Admission Confirmation message. A Call Signalling Message
FSM is initiated to monitor the reliable connection for that Transport Address. The
remainder of the processing proceeds in a similar manner to Example 1.
-
The example in Figure 17 shows the generic case of simply identifying the Call
Signalling Channel. It is straightforward to extend this to include the creation of the
service detail record in response to an Admission Request message from the endpoint to
the gatekeeper. This enables the creation of service detail records which include
information and time stamps taken from the call related messages on the RAS Channel.
It also enables the generation of service detail records in the case where an Admission
Reject message is received and no Call Signalling Channel is ever established.
-
The presence of gatekeepers may also affect the call clearing process. Typically a
disengage request (DRQ) message is transferred between the endpoint and the gatekeeper
as part of the call clearing process.
-
The Call Reference Value (CRV), in cases where it is implemented by vendors,
can be used throughout the call as a unique identifier for all the messages.
-
The processes described above can be split in many different ways between the
probes and the other processors in the Distributed Management Infrastructure. There are
established methods for choosing how to distribute the processing; the Hewlett-Packard
acceSS7 architecture provides one example of how this may be achieved.