EP0856787B1 - Adjustment rule generating method, adjustment rule generating apparatus, adjustment control method, and adjustment control apparatus - Google Patents
Adjustment rule generating method, adjustment rule generating apparatus, adjustment control method, and adjustment control apparatus Download PDFInfo
- Publication number
- EP0856787B1 EP0856787B1 EP98101216A EP98101216A EP0856787B1 EP 0856787 B1 EP0856787 B1 EP 0856787B1 EP 98101216 A EP98101216 A EP 98101216A EP 98101216 A EP98101216 A EP 98101216A EP 0856787 B1 EP0856787 B1 EP 0856787B1
- Authority
- EP
- European Patent Office
- Prior art keywords
- data
- adjustment
- rule
- predetermined
- variable
- Prior art date
- Legal status (The legal status is an assumption and is not a legal conclusion. Google has not performed a legal analysis and makes no representation as to the accuracy of the status listed.)
- Expired - Lifetime
Links
Images







Classifications
-
- G—PHYSICS
- G05—CONTROLLING; REGULATING
- G05B—CONTROL OR REGULATING SYSTEMS IN GENERAL; FUNCTIONAL ELEMENTS OF SUCH SYSTEMS; MONITORING OR TESTING ARRANGEMENTS FOR SUCH SYSTEMS OR ELEMENTS
- G05B13/00—Adaptive control systems, i.e. systems automatically adjusting themselves to have a performance which is optimum according to some preassigned criterion
- G05B13/02—Adaptive control systems, i.e. systems automatically adjusting themselves to have a performance which is optimum according to some preassigned criterion electric
- G05B13/0265—Adaptive control systems, i.e. systems automatically adjusting themselves to have a performance which is optimum according to some preassigned criterion electric the criterion being a learning criterion
-
- G—PHYSICS
- G06—COMPUTING OR CALCULATING; COUNTING
- G06N—COMPUTING ARRANGEMENTS BASED ON SPECIFIC COMPUTATIONAL MODELS
- G06N5/00—Computing arrangements using knowledge-based models
- G06N5/02—Knowledge representation; Symbolic representation
- G06N5/022—Knowledge engineering; Knowledge acquisition
- G06N5/025—Extracting rules from data
Definitions
- the present invention relates to an adjustment rule generating method and apparatus for generating an adjustment rule for appropriately and easily adjusting an input to a multiple-input/output system having nonlinear characteristics to obtain a desired output from the system, and an adjustment control method and apparatus for adjusting the input to the system using the generated adjustment rule.
- Both the parameter and the output are generally multidimensional rather than one-dimensional (variable) and have complex causality.
- the relationship between the parameter and the output is not linear. Resultant data is small in quantity or maldistributed, so the characteristics between the parameter and the output cannot be sufficiently described using such data. It can be supposed that these factors make the problem difficult to solve.
- the fuzzy inference can be effective for a system having nonlinear characteristics. However, the fuzzy inference is regarded eventually "successful" only when the membership function or adjustment rule can be appropriately defined.
- the fuzzy theory is applied to a nonlinear system.
- analogical reasoning can hardly be made because the response from an object is not linear.
- trial and error in system identification also tends to be cumbersome.
- the input amount for adjustment manipulated variable for control
- the initial rule is still effective for a variation in system characteristics.
- this also applies to qualitative causality reasoning.
- analysis is automatically performed by a computer.
- data in checking the causality depends on human determination, like the fuzzy inference. More specifically, even when data is to be semiautomatically processed and modeled, the human data determination reference must be defined in advance.
- the qualitative causality reasoning is essentially identical to the fuzzy inference (e.g., Jpn. Pat. Appln. KOKAI Publication No. 7-191706).
- Reasoning does not suffice for adjustment. Unlike system observation based on two references, e.g., faulty diagnosis for checking whether the interior of a system is faulty or not (subsequent processing is left to human operations), some action must be taken for the system after situation determination in the control system.
- EP 0 233 071 A1 discloses a method according to the preamble of claim 1 and an apparatus according to the preamble of claim 5, in particular a rule based process control system which adaptively controls a process by inducing control rules from the process as the process changes.
- the original rules are induced from historical data or samples of the controllable variables of the process from the past such as during a staple-up or debug phase of process development.
- Input variables of the process are sampled by a sensing unit. The sample is then tested against the current rules and if the sample is predicted by the current rules, the process continues. If the results are acceptable, but not optimal, the rules which allow improvement towards the goal are selected and others are discarded from a list of rules. Therefore, the method and apparatus disclosed are based on causality as described above.
- US 4 730 259 discloses an expert system controlled by a matrix generated by training examples and/or rules, which matrix may be modified dynamically by additional examples as the system operates.
- the present invention has been made in consideration of the above situation, and has as its object to provide a system having the following characteristic features:
- the present invention has as its object to provide an adjustment rule generating method and apparatus for generating an adjustment rule to adjust an object having multiple variables (multiple-input/output system) whose correlation has complex nonlinear characteristics.
- the adjustment operation can be appropriately standardized and automated.
- an input (manipulated variable) for each element is given to an object to be adjusted or controlled, and an output as the operation result of the object in response to the given input is obtained in units of elements.
- the change pattern of, e.g., two outputs given by the input (manipulated variable) is checked.
- Two inputs are selected from the table representing the dependency relationship, and the degree of influence between the input and output is detected on the basis of the change pattern. With this process, the element for which the input must be changed to perform most stable control or adjustment as desired is checked.
- FIG. 1 is a view schematically showing the relationship between an input and an output.
- the adjustment rule generating apparatus of the present invention generates an operation procedure (adjustment rule) for adjustment on an assumption that actual object data, i.e., inputs xi and outputs yi (i is an integer) are obtained, and these actual data are used to prepare a table (dependency relationship table) representing the qualitative characteristics obtained by classifying inputs (manipulated variables) in units of change patterns of outputs (controlled variables) having influences, as shown in FIG. 1.
- an operation procedure i.e., inputs xi and outputs yi (i is an integer) are obtained, and these actual data are used to prepare a table (dependency relationship table) representing the qualitative characteristics obtained by classifying inputs (manipulated variables) in units of change patterns of outputs (controlled variables) having influences, as shown in FIG. 1.
- the adjustment control apparatus of the present invention it is determined whether the current object situation exhibits an exceptional behavior (vibration/ saturation), on the basis of an instruction (selection of an adjusted controlled variable and a manipulated variable) obtained from an automatically generated adjustment rule and a past operation in response to an occasionally output deviation. If it is determined that no exceptional behavior is observed, the instruction of the generated adjustment rule is executed; otherwise, the correction amount of the manipulated variable which is input to the object to be adjusted is given assuming that a predetermined input operation is performed.
- exceptional behavior vibration/ saturation
- An adjustment rule generating apparatus which determines the manipulated variable of the adjustment object or sets the value of a variable parameter (the variable parameter will not particularly be discriminated from the manipulated variable hereinafter) of an adjustment object such that a controlled variable within an allowable range can be obtained, is characterized by comprising adjustable controlled variable selection means fo receiving a change in controlled variable corresponding to each manipulated variable of the adjustment object and qualitative feature data of a change difference between controlled variables and defining some manipulated variables which can be independently adjusted from the feature data in units of controlled variables, and adjustment rule format generating means for converting adjustable controlled variable data output from the adjustable controlled variable selection means in units of manipulated variables into a predetermined format and outputting the format as an adjustment procedure.
- the adjustment rule generating apparatus is characterized in that feature data representing the change in controlled variable caused by each manipulated variable of the adjustment object is expressed as first binary data describing whether each manipulated variable affects each controlled variable, and the qualitative feature data in the change in controlled variable between controlled variables is expressed as second binary data describing change pattern given from each manipulated variable to each controlled variable, and these first and second binary data is used as the input data(manipulated variable characteristics and input/output dependency relationship table; to be referred to as a dependency table hereinafter).
- the third embodiment relates to an adjustment control apparatus for performing a proportional operation.
- This apparatus is characterized by comprising deviation data generating means for calculating a deviation of a controlled variable of an adjustment object and outputting the deviation, adjustment rule storage means for receiving the controlled variable deviation obtained from the deviation data generating means and storing an adjustment rule obtained in the first or second embodiment, application rule selection means for receiving the controlled variable deviation calculated by the deviation data generating means and the adjustment rule stored in the adjustment rule storage means, selecting a manipulated variable to be adjusted, and defining the selected manipulated variable as an application rule, and manipulated variable determination means for determining a correction amount of the manipulated variable selected by the application rule selection means with reference to the controlled variable deviation as a predetermined proportional amount of the deviation of the controlled variable corresponding to the manipulated variable defined by the application rule.
- the fourth embodiment relates to an adjustment control apparatus for performing a proportional operation and nonlinear avoidance.
- the adjustment control apparatus of the third embodiment is characterized by further comprising adjustment history data storage means for recording/ updating adjustment history data (adjustment count, manipulated variable, controlled variable deviation, and the like), and in that the manipulated variable determination means refers to the controlled variable deviation and the adjustment history data stored in the adjustment history data storage means in accordance with the application rule selected by the application rule selection means to determine the correction amount of the manipulated variable of the application rule or a manipulated variable other than the manipulated variable as a proportional amount of the controlled variable deviation or a relative difference from another controlled variable deviation, or independently of the proportional amount, newly stores the determined manipulated variable or controlled variable deviation data referred to in determining the manipulated variable in the adjustment history data storage means, and updates the adjustment history data.
- the fifth embodiment relates to an adjustment control apparatus for performing a test operation and nonlinear avoidance.
- the adjustment control apparatus of the fourth embodiment is characterized in that
- an adjustment possibility evaluation apparatus is characterized by comprising an input unit capable of receiving feature data of qualitative input/output relationship of the adjustment object or a dependency table and the adjustment rule obtained from the adjustment rule generating apparatus of the first or second embodiment, rule candidate initial setting means for generating some adjustment rules in which manipulated variables and controlled variables are in one-to-one correspondence, controlled variable selection means for selecting a controlled variable to check whether adjustment is enabled for each candidate rule set by the rule candidate initial setting means, corresponding manipulated variable search means for searching for a manipulated variable which corresponds to the controlled variable selected by the controlled variable selection means and can adjust the controlled variable, rule candidate generating means for storing the candidate rule as a rule candidate when all the controlled variables can be adjusted on the basis of the candidate rule set by the rule candidate initial setting means, and rule group generating means for outputting a rule group while omitting the same rule candidate stored in the rule candidate generating means
- the seventh embodiment relates to an adjustment rule candidate generating apparatus for preparing a dependency table and an adjustment rule.
- an adjustment rule candidate generating apparatus is characterized by comprising dependency table candidate generating means for generating some dependency table candidates defined in the third embodiment from actual input/output data of the adjustment object, adjustment rule generating apparatus of the third embodiment, which receives each dependency table candidate to acquire an adjustment rule corresponding to the dependency table candidate, and dependency table/rule candidate storage means for storing the adjustment rule obtained from the adjustment rule generating apparatus in correspondence with the dependency table candidate.
- a system shown in FIG. 10 comprises an adjustment rule generating apparatus 10, an adjustment control apparatus 20, and an adjustment object 30.
- the block diagram of FIG. 10 shows a system arrangement in which the adjustment control apparatus 20 outputs an instruction for adjusting the variable parameter of the adjustment object 30 on the basis of an adjustment rule generated by the adjustment rule generating apparatus 10 such that a desired output is obtained from the adjustment object 30.
- the block diagram shown in FIG. 10 is associated with the first to fifth embodiments.
- the adjustment rule generating apparatus 10 or the adjustment control apparatus 20 will be described below in units of embodiments.
- FIG. 2 is a block diagram showing the schematic arrangement of an adjustment rule generating apparatus 10 according to the first embodiment and the second embodiment (to be described later). As shown in FIG. 2, the adjustment rule generating apparatus 10 comprises an adjustable controlled variable selection unit 11 and an adjustment rule format generating unit 12.
- the adjustment rule format generating unit 12 outputs an adjustment rule having a predetermined format on the basis of the combination of the manipulated variable and controlled variable selected by the adjustable controlled variable selection unit 11.
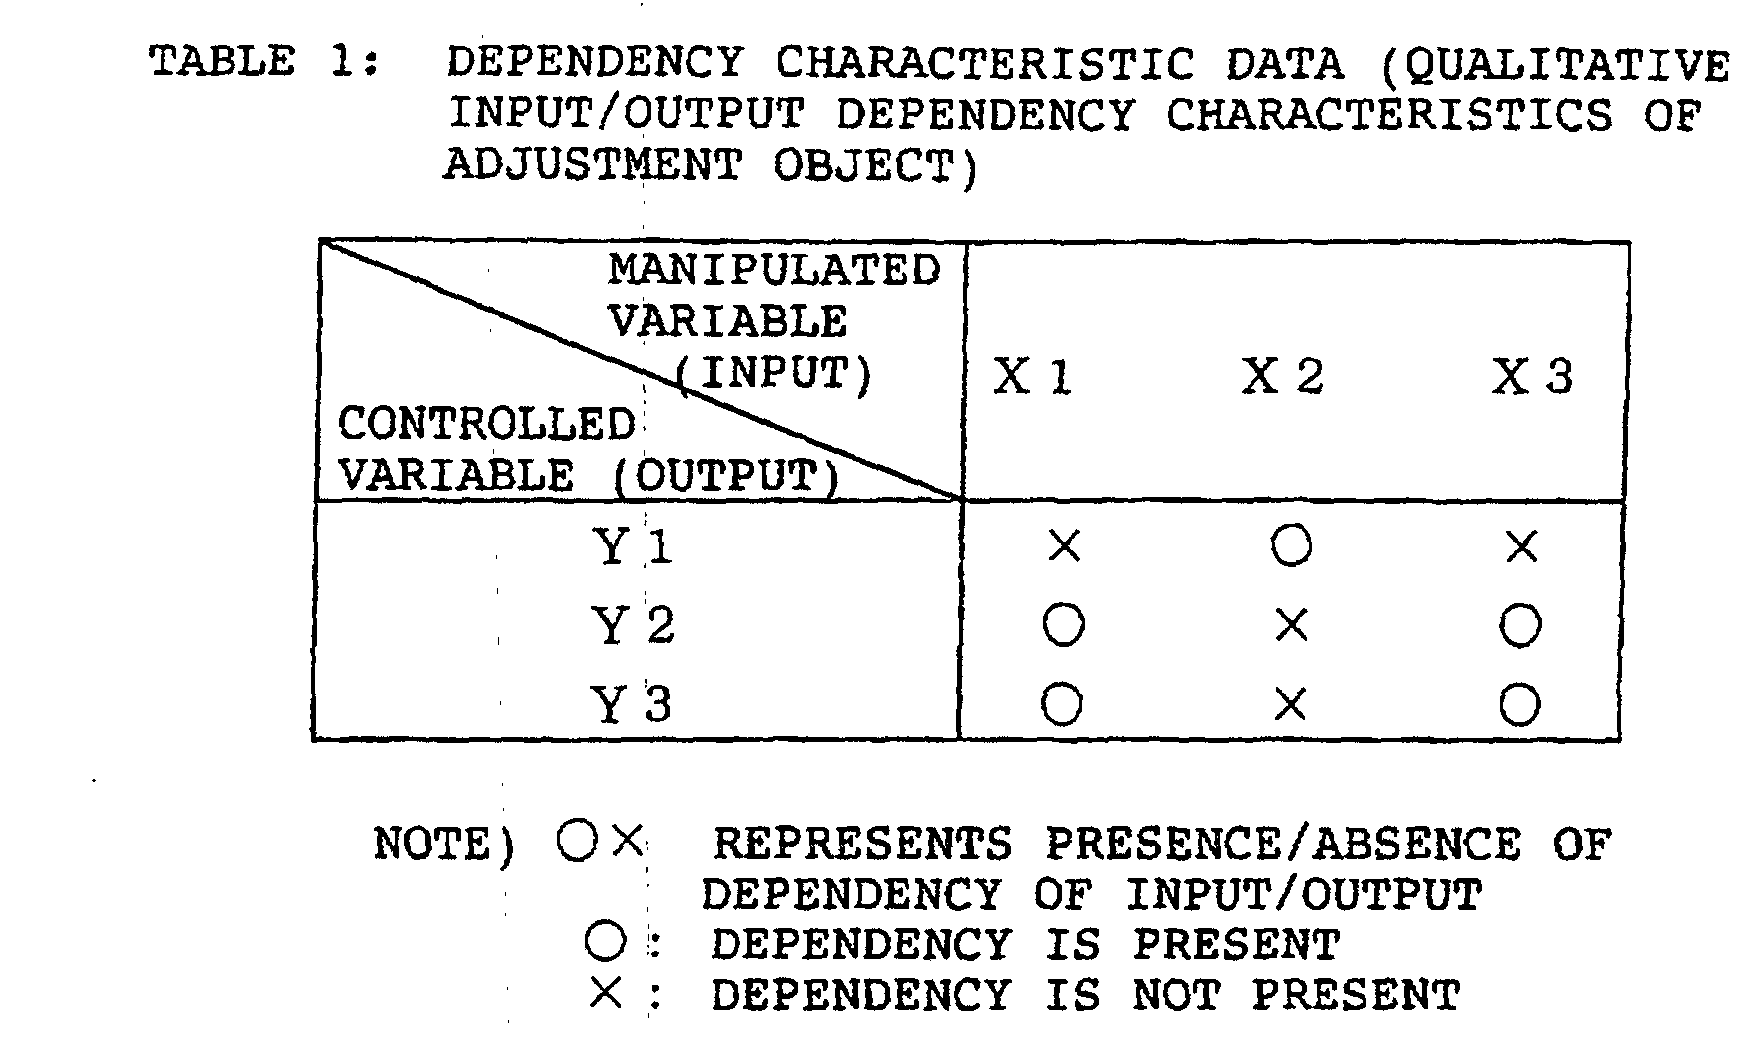
- Tables 1 and 2 show examples of input data to the adjustable controlled variable selection unit 11 according to the first embodiment.
- an adjustment object having three-dimensional inputs/outputs is exemplified.
- Table 1 shows dependency characteristic data
- Table 2 shows controlled variable correlation characteristic data.
- the dependency characteristic data (Table 1) is the qualitative input/output dependency characteristics of the adjustment object and indicates whether the manipulated variable and the controlled variable (input and output) of the adjustment object have a dependency relationship.
- a specific manipulated variable and a controlled variable adjusted by the specific manipulated variable can be determined from the table of the dependency characteristic data.
- Table 1 the following relationship is estimated. Controlled variable Y1 is adjusted by manipulated variable X2 Controlled variable Y2 or Y3 is adjusted by manipulated variable X1 or X3
- the controlled variable correlation characteristic data qualitatively represents the change in controlled variable in response to each manipulated variable (relative change in characteristics between a controlled variable and another controlled variable).
- Table 2 the characteristics between two arbitrary controlled variables are classified into three types (the number and characteristics in classification can be arbitrarily defined).
- the adjustable controlled variable selection unit 11 outputs data which represents the relationship between the controlled variable of the adjustment object and the manipulated variable for adjusting the controlled variable as adjustment characteristic data.
- Table 3 shows an example of adjustment characteristic data.
- the adjustable controlled variable selection unit 11 outputs the relationship "manipulated variable X1 ⁇ change A in controlled variables Y2 and Y3" as adjustment characteristic data "X1 Y2, Y3 A", the relationship "manipulated variable X2 ⁇ change C in controlled variable Y1 (independent)” as adjustment characteristic data "X2 Y1 C”, and the relationship "manipulated variable X3 ⁇ change B in controlled variables Y2 and Y3" as adjustment characteristic data "X3 Y2, Y3 B".
- the adjustment rule format generating unit 12 converts the adjustment characteristic data output from the adjustable controlled variable selection unit 11 into a specific format of adjustment rules with reference to the characteristic data of the adjustment object shown in Tables 1 and 2.
- the adjustment characteristic data having contents shown in Table 3 is interpreted in units of rows, and the relationship between the controlled variable to be adjusted and the manipulated variable is defined as an adjustment rule corresponding to the condition in accordance with the controlled variable correlation characteristics (A, B, and C) defined in Table 2.
- Table 1 is not referred to in the above description, priority may be given to each rule using Table 1 in accordance with the number of dependency relationships (number of Os).
- the rule of the above format (3) does not give the specific correction amount of each manipulated variable.
- the correction amount can be set using a conventionally well-known scheme as follows.
- the second embodiment is characterized in that the adjustment feature data in the first embodiment is classified into two types, and the arrangements and input/output data of an adjustable controlled variable selection unit 11 and an adjustment rule format generating unit 12 are made to correspond to this classification.
- Table 4 shows data to be input to the adjustable controlled variable selection unit 11.
- INPUT DATA "DEPENDENCY TABLE" 3 1 0 1 0 1 1 0 1 1 1 1 1 1
- Table 4 is in case of an adjustment object with three inputs and three outputs.
- the controlled variable correlation characteristic data and the adjustment feature data in the first embodiment are put together, and the respective data are represented as binary data ("3" 'in Table. 4 is additional data representing the number of dimensions but not directly indicating the characteristic feature of the dependency relationship between an input and an output).
- Such a table will be particularly referred to as a "dependency table” hereinafter.
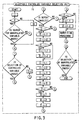
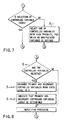
- the adjustable controlled variable selection unit 11 Upon receiving the data in the dependency table shown in Table 4, the adjustable controlled variable selection unit 11 determines combinations of manipulated variables and controlled variables by processing following checklists 1 and 2 and a procedure shown in FIG. 2 on the basis of the dependency table. With this procedure, the adjustable controlled variable selection unit 11 outputs the priority of each manipulated variable and a controlled variable which must be unconditionally adjusted by the manipulated variable as "rule data".
- Manipulated variables will be classified in accordance with the change pattern of corresponding controlled variables: "a manipulated variable for changing controlled variables in the same direction (i.e., change pattern "0")” will be called “an offset manipulated variable”; and “a manipulated variable for changing controlled variables in different directions (i.e., change pattern "1”)”, “a gradient manipulated variable” hereinafter.
- the dependency relationship between a manipulated variable and a controlled variable will be simply expressed as “correspondence”.
- Checklist 2 has the above-described arrangement.
- the adjustment rule format generating unit 12 arranges rule data (represented as in (4)) output from the adjustable controlled variable selection unit 11 in units of manipulated variables and changes the rule data into a format which can be readily used for adjustment.
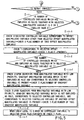
- An adjustment rule format generation procedure will be described with reference to [Checklist 3] and FIG. 9. The format of the adjustment rule is shown in [Format 1].
- the adjustment rule format generating unit 12 outputs the adjustment rules in the format as shown in Table 9.
- Table 10 describes the format of adjustment rule.
- Each row means an instruction (to be referred to as a rule hereinafter) for one manipulated variable.
- the respective columns in each row have the following meanings.
- the first element represents "number of manipulated variable to be corrected”; the second element, “offset or gradient”; the third element, “pattern of controlled variable to be adjusted”; and the fourth element, “numbers of controlled variables to be adjusted”.
- "-1" at the end of each row means the end of the row (identifier indicating the end of the row).
- "correct” and “adjust” mean that the manipulated variable is corrected to adjust the controlled variable (to a desired value).
- Table 9 The first row of Table 9 is shown as Table 11, and this can be interpreted as follows. FORMAT OF ADJUSTMENT RULE 2 0 2 1 2 - 1
- the number of the manipulated variable to be corrected is "2"
- the tendency of change is "offset”
- the pattern of the controlled variable to be adjusted is “2”
- the numbers of controlled variables to be adjusted is "1" and "2".
- Table 9 it is sequentially determined from the first row whether the adjustment rule indicated on each row is suitable for the situation (whether the deviation of the controlled variable to be referred to falls within the allowable range), and then, adjustment is performed.
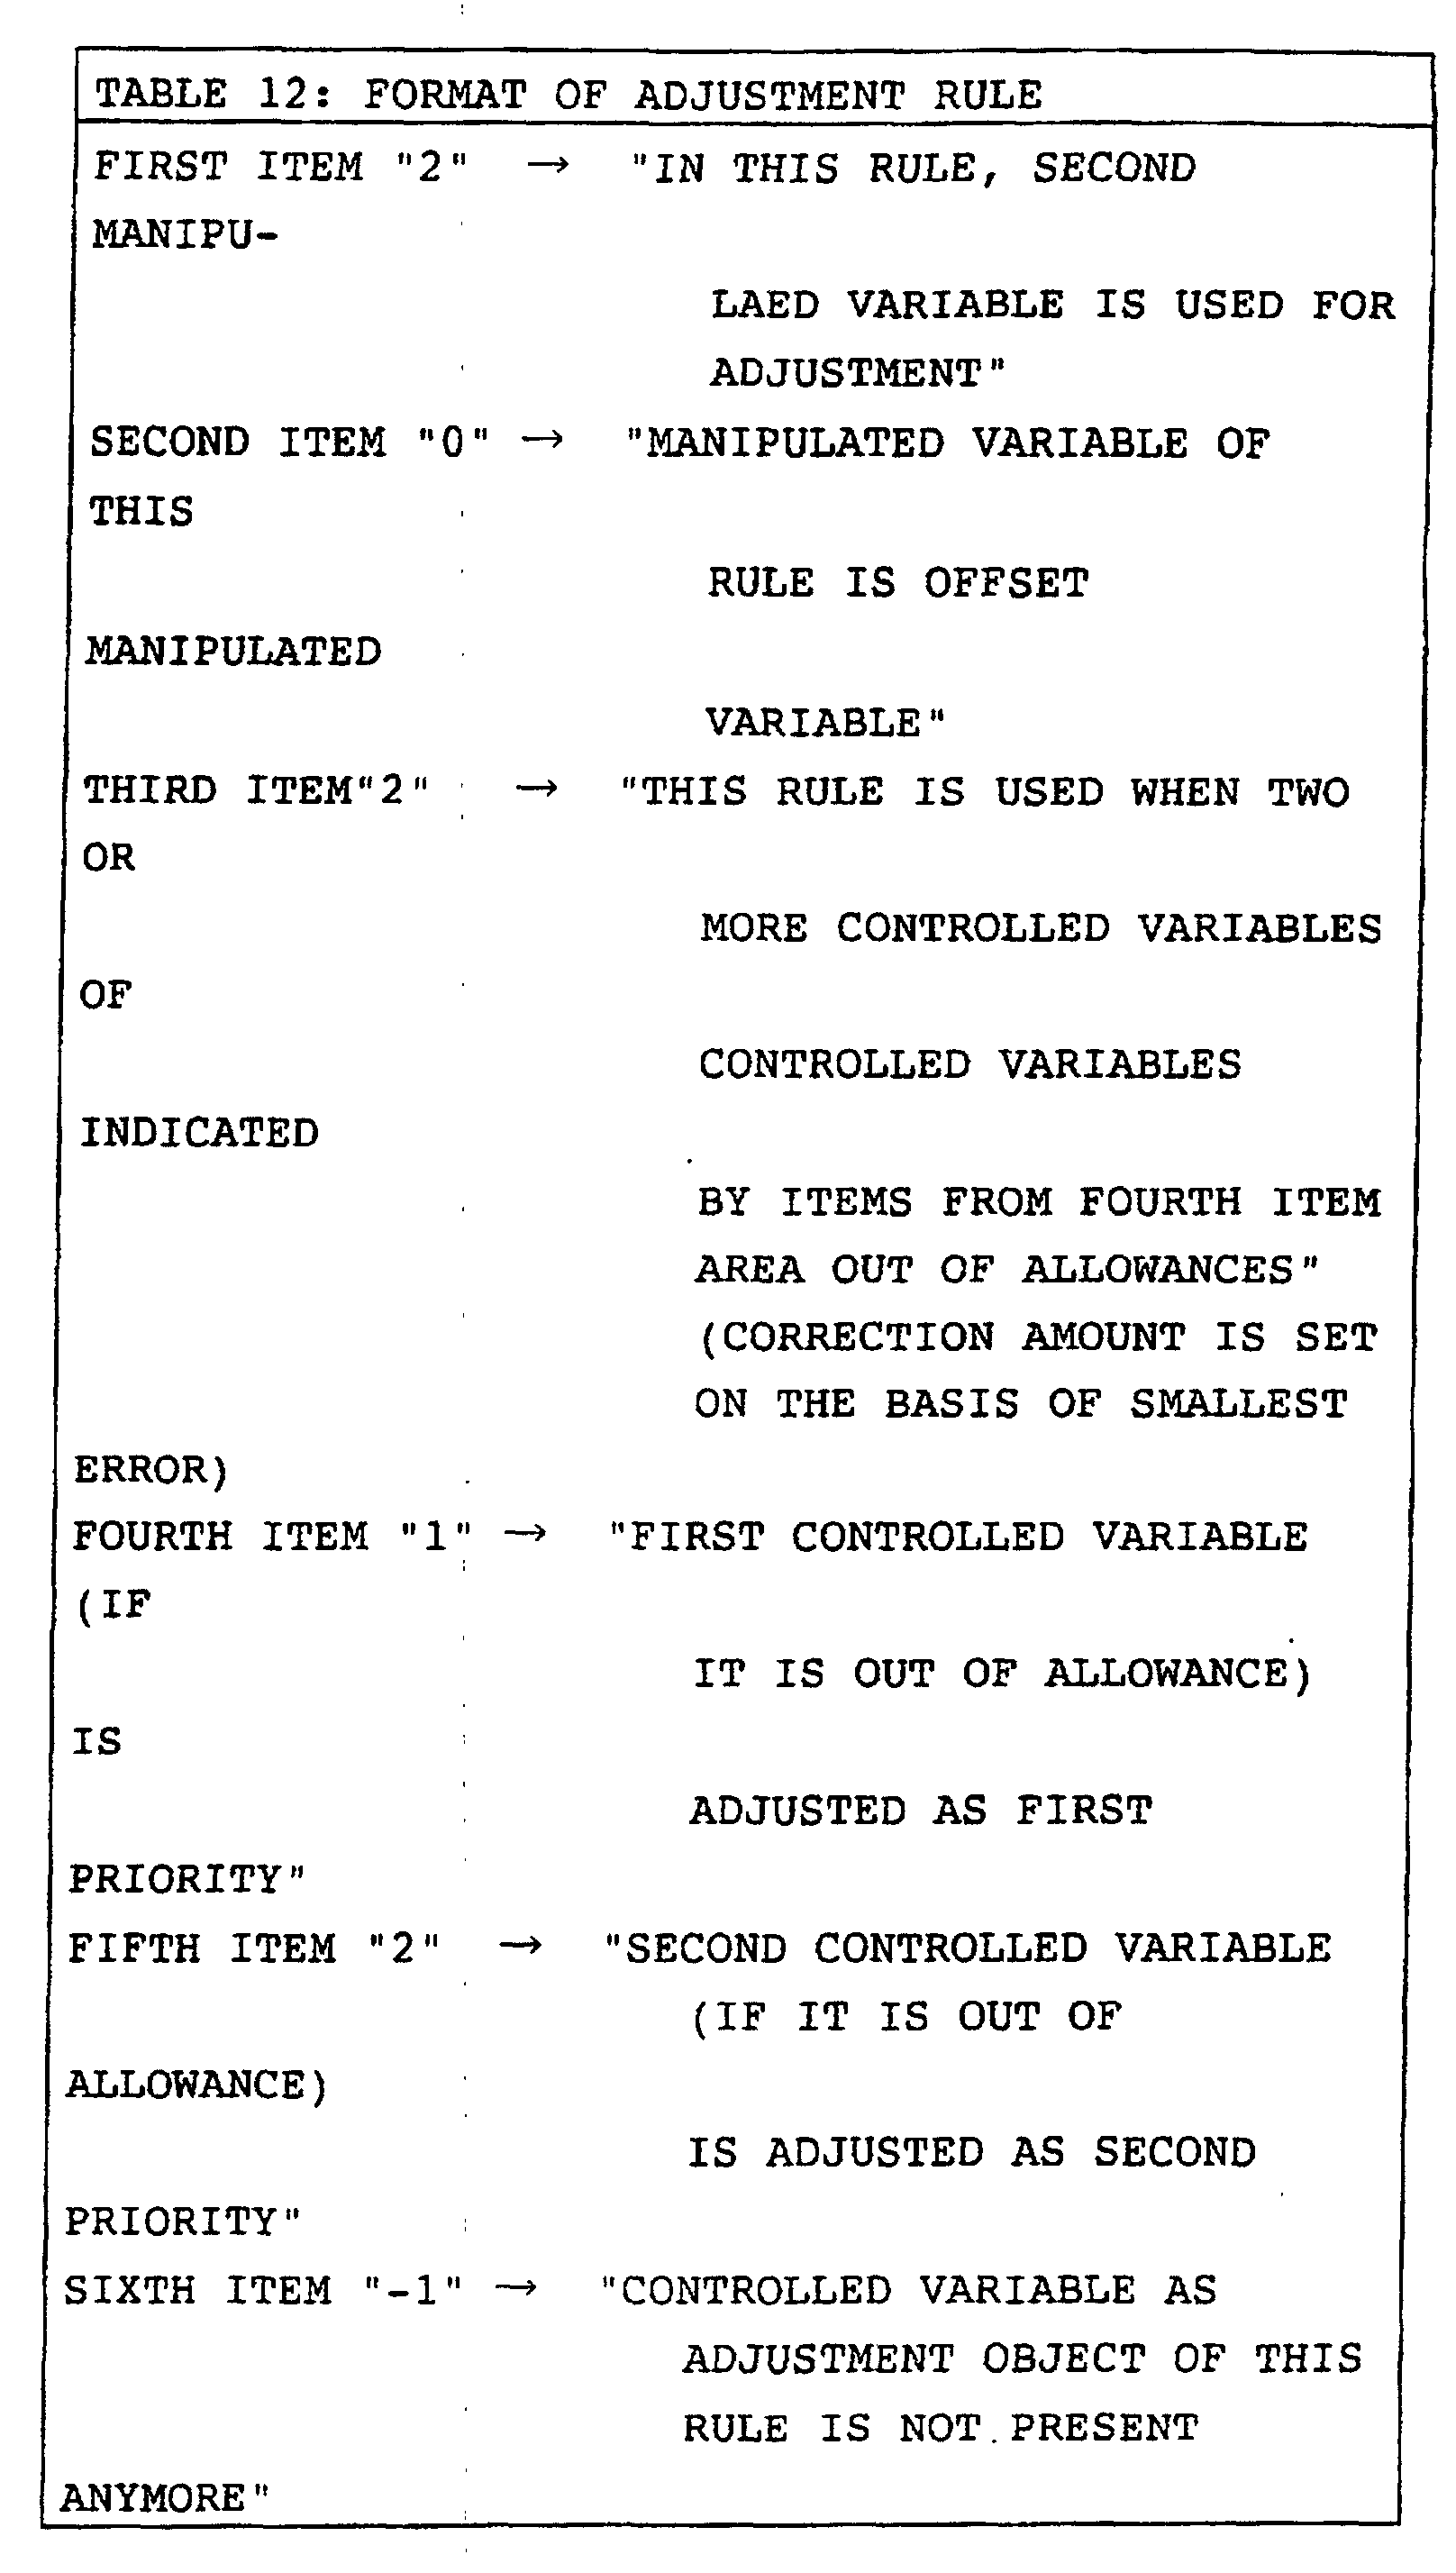
- the first row of Table 9 can be interpreted as described in Table 12.
- the first item i.e., the first element is "2", and this means that "in this rule the second manipulated variable is used for adjustment”
- the second item i.e., the second element is "0”, and this means that "the manipulated variable of this rule is an offset manipulated variable”.
- the third item is “2”, and this means that "this rule is used when two or more controlled variables indicated from the fourth item are out of the allowable ranges”. The correction amount is set on the basis of the smallest error.
- the fourth item is "1”, and this means that the first controlled variable (if it is out of the allowable range) is adjusted as the first priority.
- the fifth item is “2”, and this means that "the second controlled variable (if it is out of the allowable range) is adjusted as the second priority”.
- the sixth item is "-1”, and this means that "controlled variables as adjustment objects of this rule are not present anymore”.
- Rule 1 defines that "when both the first and second controlled variables are out of the allowable ranges, adjustment is performed using the second manipulated variable on the basis of the smaller error”.
- Rule 2) defines that "when one of the first and second controlled variables is out of the allowable range, adjustment is performed using the third manipulated variable”.
- Rule 3) defines that "when the third controlled variable is out of the allowable range, adjustment is performed using the first manipulated variable”.
- FIG. 10 is a block diagram showing the basic arrangement of an adjustment control apparatus 20 according to the third or fourth embodiment.
- the adjustment control apparatus 20 inputs a correction amount to an adjustment object 30 to change a variable parameter in the adjustment object 30 on the basis of the deviation between the output from the adjustment object 30 and the desired value in accordance with an adjustment rule obtained from the adjustment rule generating apparatus 10 according to the first or second embodiment.
- FIG. 11 shows the arrangement of the adjustment control apparatus 20 according to the third embodiment.
- the adjustment control apparatus 20 comprises an adjustment rule storage unit 21, a deviation data generating unit 22, an application rule determination unit 23, and a manipulated variable determination unit 24 (refer chart 1 shown in FIG. 12).
- the adjustment rule storage unit 21 stores adjustment rules obtained from the adjustment rule generating apparatus 10.
- the deviation data generating unit 22 calculates deviation (deviation amount) data from the desired output value.
- the application rule determination unit 23 determines a rule to be applied from the adjustment rules on the basis of the deviation data sent from the deviation data generating unit 22 on the basis of the output from the adjustment object 30.
- the manipulated variable determination unit 24 determines the value of the manipulated variable described in the rule determined by the application rule determination unit 23 and to be applied by multiplying it by a predetermined proportional coefficient in accordance with the deviation data obtained from the deviation data generating unit 22.
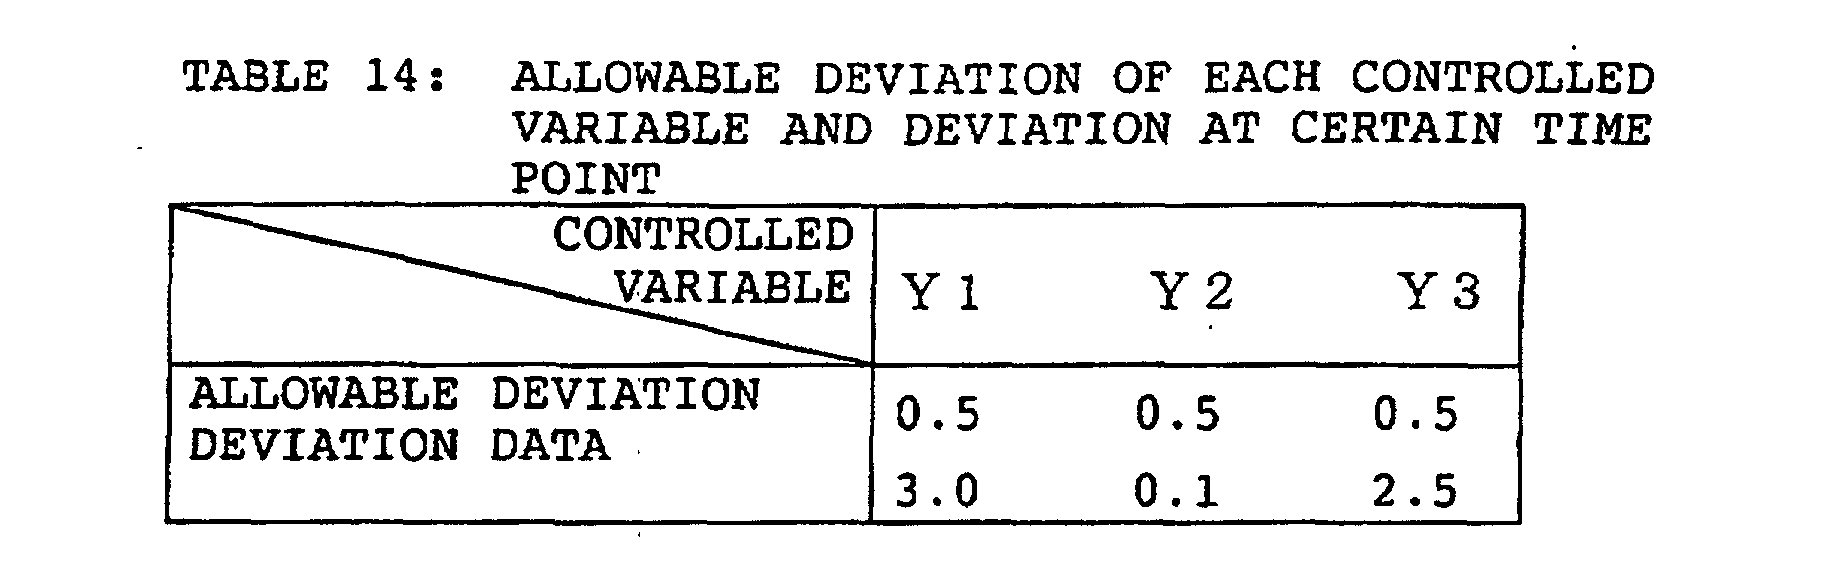
- the allowable deviations of the controlled variables Yi are 0.5, 0.5, and 0.5.
- the deviations of the controlled variables Yi at a certain time point are 3.0, 0.1, and 2.5.
- a controlled variable Y2 falls within the allowable deviation, and the deviations of controlled variables Y1 and Y3 are out of the allowable deviation.
- the third item is "2”
- the controlled variables of the object are "1" and "2”.
- the first rule is not applied to the case of Table 14 because it is a rule applied when both the controlled variables Y1 and Y2 are out of the allowable deviations.
- the third item is "1", and the controlled variables of the object are "1" and "2".
- the second rule is applied when one of the deviations of the controlled variables Y1 and Y2 is out of the allowable deviation, and this applies to the above case.
- the second rule indicates "1" in the first item, i.e., that the controlled variable Y1 must be adjusted using the third manipulated variable X3.
- the second rule is applied as the adjustment rule, so rule "3 1 1 1 2 -1" based on this application rule is transferred to the manipulated variable determination unit 24.
- the manipulated variable determination unit 24 calculates a correction amount u3 of the manipulated variable X3 by multiplying a deviation el of the controlled variable Y1 by a predetermined proportional coefficient k3 associated with the manipulated variable. If, in the adjustment rule, the manipulated variable is a gradient manipulated variable paired with an offset manipulated variable (when the third item of the adjustment rule is "1"), the direct deviation el of the controlled variable Y1 is not multiplied by the proportional coefficient.
- the adjustment object 30 has a new deviation.
- the manipulated variable is repeatedly corrected in the above manner.
- the application rule determination unit 23 determines that no rule need be applied, so the adjustment control apparatus 20 does not correct the manipulated variable of the adjustment object 30.
- the adjustment control apparatus 20 selects the manipulated variable to be corrected in accordance with the adjustment rules shown in Table 9 on the basis of the deviation data of the adjustment object 30, calculates the correction amount by multiplying the deviation by the proportional coefficient, and inputs the correction amount to the adjustment object 30. By repeating this operation, the deviations can be converged within the allowable range, thereby obtaining the desired output from the adjustment object 30.
- FIG. 13 shows the arrangement of an adjustment control apparatus 20 according to the fourth embodiment.
- the adjustment control apparatus 20 of this embodiment is characterized in that an adjustment history data storage unit 25 is added to the adjustment control apparatus 20 of the third embodiment.
- the adjustment history data storage unit 25 stores input and output values of an adjustment object 30 and deviation data obtained from a deviation data generating unit 22.
- a manipulated variable determination unit 24 determines the input to the adjustment object 30 with reference to not only the input and output values of the adjustment object 30 but also data in the adjustment history data storage unit 25 (refer chart 1 shown in FIG. 12).
- the adjustment history data storage unit 25 stores adjustment history data as shown in Table 15 (deviation at adjustment count "0" is an initial deviation).
- rule 2 in adjustment rule table 9 is selected in correspondence with the initial deviation, and a manipulated variable X3 is corrected by -2.9.
- rule 1 is selected, and a manipulated variable X2 is repeatedly corrected (since the manipulated variable X2 is an offset manipulated variable, the correction amount is calculated by directly multiplying the smaller one of the allowable deviations of controlled variables Y1 and Y2, which are out of the allowable ranges, by a proportional coefficient) (in this case, a proportional coefficient k2 for defining the correction amount of the manipulated variable X2 is set to be -1.0).
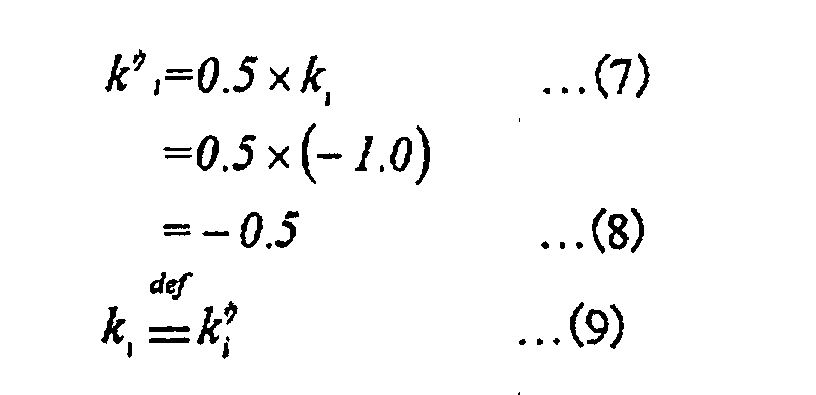
- the manipulated variable determination unit 24 refers to the adjustment history data. If the deviation vibrates between positive and negative values upon correcting the same manipulated variable, the proportional coefficient of the manipulated variable is multiplied by a weight to determine the manipulated variable. As in the above example, when the same manipulated-variable is repeatedly corrected three or more times, and the deviation vibrates between positive and negative values, for the second manipulated variable, the proportional coefficient is multiplied by a weight of 0.5. In this case, the proportional coefficient is corrected as follows:
- a proportional coefficient k1 for defining the correction amount of a manipulated variable X1 is set to be -1.0.
- the manipulated variable determination unit 24 of this embodiment has a function of not only determining the correction amount proportional to the manipulated variable but also exceptionally determining the correction amount of the manipulated variable in accordance with conditions in correspondence with the output characteristics of the adjustment object 30 in the adjustment process.
- Table 17 shows exceptional processing condition processing.
- the proportional coefficient is multiplied by a weight (0 to 1).
- the proportional coefficient is multiplied by a weight (1 or more).
- the deviation increases without changing the sign upon correcting the manipulated variable
- the sign of the proportional coefficient is inverted.
- the deviation does not change upon correcting the manipulated variable
- other (one or more) predetermined manipulated variables are corrected by a predetermined amount.
- FIG. 14 is a block diagram showing the arrangement of an adjustment control apparatus 20 according to the fifth embodiment.
- This embodiment is characterized in that history data is positively used in the manipulated variable determination unit 24 of the fourth embodiment.
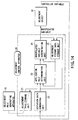
- the apparatus has almost the same arrangement as that of the fourth embodiment (the difference from the arrangement shown in FIG. 12 is that an application rule determination unit 23 refers to history data) except the data and manipulated variable determination scheme.
- the correction amount of the manipulated variable is not simply determined in proportion to the deviation, unlike the fourth embodiment, but calculated using past history data (chart 2 shown in FIG. 15).
- a manipulated variable X3 is to be corrected on the basis of "rule 2".
- One adjustment is sacrificed to perform "test adjustment” for a trial to correct the manipulated variable by a predetermined amount.
- the deviation of the adjustment object after correction of the manipulated variable is calculated, and history data as shown in Table 18 is stored in a history data storage unit 25.
- a test correction amount u3test is set to be 1.0.
- the adjustment control apparatus 20 of this embodiment is characterized in that data at adjustment count "1" is used in the situation shown in Table 18 to obtain the correction amount of the manipulated variable X3 at adjustment count "2", and adjustment is performed using the correction amount as a determination reference.
- the application rule determination unit 23 refers to the history data stored in the history data storage unit 25. If the current situation is immediately after test adjustment, the next processing is actual adjustment. Therefore, the rule selected for the previous test adjustment is determined as an application rule independently of the deviation after test adjustment.
- the manipulated variable determination unit 24 determines the correction amount of the manipulated variable using data before and after test adjustment in the following manner.
- the manipulated variable X3 corresponds to controlled variables Y1 and Y2.
- the controlled variable Y1 is to be corrected by the manipulated variable X3.
- the manipulated variable X3 is a gradient manipulated variable paired with an offset manipulated variable, as is apparent from "rule 2", so the manipulated variable X3 changes the corresponding controlled variables Y1 and Y2 relative to each other.
- the relative change amount between the deviation of the controlled variable Y1 and that of the controlled variable Y2 before and after test adjustment is calculated.
- the correction amount of the manipulated variable X3 is calculated on the basis of equation (10) such that the relative deviation component (difference between the deviation of the controlled variable Y1 and that of the controlled variable Y2) between the current controlled variable Y1 and the controlled variable Y2 is canceled.
- ⁇ is a coefficient as the reliability of the calculated amount. This coefficient will be called a reliability coefficient in distinction from the proportional coefficient in the third or fourth embodiment.
- the application rule determination unit 23 selects "rule 1" for the next adjustment (i.e., test adjustment). According to "rule 1", the manipulated variable X2 is selected.
- manipulated variable X2 is an offset manipulated variable
- the change amount in the smaller one of the deviations of controlled variables to be adjusted is directly used. More specifically, where ⁇ is the reliability coefficient for the manipulated variable X2 and is set to be 1.0.
- the manipulated variable X1 is a gradient manipulated variable which is not paired with an offset manipulated variable. Therefore, like the offset manipulated variable, the change amount of the smallest one of the deviations of corresponding controlled variables before and after test adjustment is used to calculate the correction amount of the manipulated variable.
- exceptional processing by the manipulated variable determination unit 24 can be performed, as in the fifth embodiment.
- adjustment is separately performed in test adjustment and actual adjustment, so an example in which exceptional processing in the fifth embodiment is separated into test adjustment and actual adjustment, and the proportional coefficient is replaced with the reliability coefficient will be described.
- the reliability coefficient When “the deviation vibrates between positive and negative values upon repeatedly correcting the same manipulated variable in actual adjustment", “the reliability coefficient is multiplied by a weight (0 to 1)". When “a deviation with the same sign is repeatedly obtained upon repeatedly correcting the same manipulated variable in actual adjustment”, “the reliability coefficient is multiplied by a weight (1 or more)”. When “the deviation increases without changing the sign upon actual adjustment”, “the sign of the reliability coefficient is inverted”. When “the deviation does not change in test adjustment”, “other (one or more) predetermined manipulated variables are corrected by a predetermined amount in actual adjustment (dead band)”. When “the deviation does not change in actual adjustment”, “other (one or more) predetermined manipulated variables are corrected by a predetermined amount in actual adjustment (dead band)”.
- the manipulated variable determination unit 24 may continuously perform test adjustment or actual adjustment, as needed. This operation is effective when the manipulated variable is limited within an infinite range, or adjustment is performed on an assumption of repetitive operation under a situation where the operation is likely to fail.
- FIG. 16 shows the arrangement of an adjustment possibility evaluation apparatus 40 of the sixth embodiment.
- the adjustment possibility evaluation apparatus 40 evaluates whether the adjustment object can be adjusted by an adjustment rule on the basis of the "adjustment rules" described in the second embodiment.
- controlled variables and manipulated variables for adjusting the controlled variables do not always correspond in one-to-one correspondence depending on the manner for preparing the dependency table. In such a case, the rule generating apparatus of the second embodiment lists up all controlled variables that the apparatus can cope with.
- the adjustment possibility evaluation apparatus 40 of the sixth embodiment changes adjustment rules such that all controlled variables can be adjusted independently of the deviation situation.
- a dependency table shown in Table 25 shows the characteristics of the adjustment object, which are different from those in Table 4 (the number of inputs/outputs is 3). DEPENDENCY TABLE 3 1 1 1 0 1 1 1 1 0 1 1 0
- the adjustment rule in this format indicates that "even when the deviations of both the second and third controlled variables are out of the allowable ranges, and the second controlled variable is adjusted by the second manipulated variable to converge the deviation of the second controlled variable within the allowable range, adjustment is further performed using the second manipulated variable unless the deviation of the third controlled variable simultaneously falls within the allowable range" (this is because a condition for the deviations of a plurality of controlled variables to be adjusted by the manipulated variable is not designated as the third item of each rule is "0").
- the adjustment possibility evaluation apparatus 40 of this embodiment changes the format such that the controlled variables and manipulated variables correspond in one-to-one correspondence in adjustment, i.e., the second controlled variable is adjusted by the second manipulated variable, and the third controlled variable is adjusted by the first manipulated variable.
- the adjustment possibility evaluation apparatus 40 comprises a rule candidate initial setting unit 41, a controlled variable selection unit 42, a corresponding manipulated variable search unit 43, a rule candidate generating unit 44, and a rule group generating unit 45.
- the rule candidate initial setting unit 41 performs initial setting of rule candidates.
- the rule candidate initial setting unit 41 determines the pattern of the selection order of controlled variables and initializes the correspondence data between the controlled variables and manipulated variables.
- the selection order of controlled variables is set as rule candidate data as shown in Table 27.
- One sequence of controlled variables corresponds to one rule candidate.
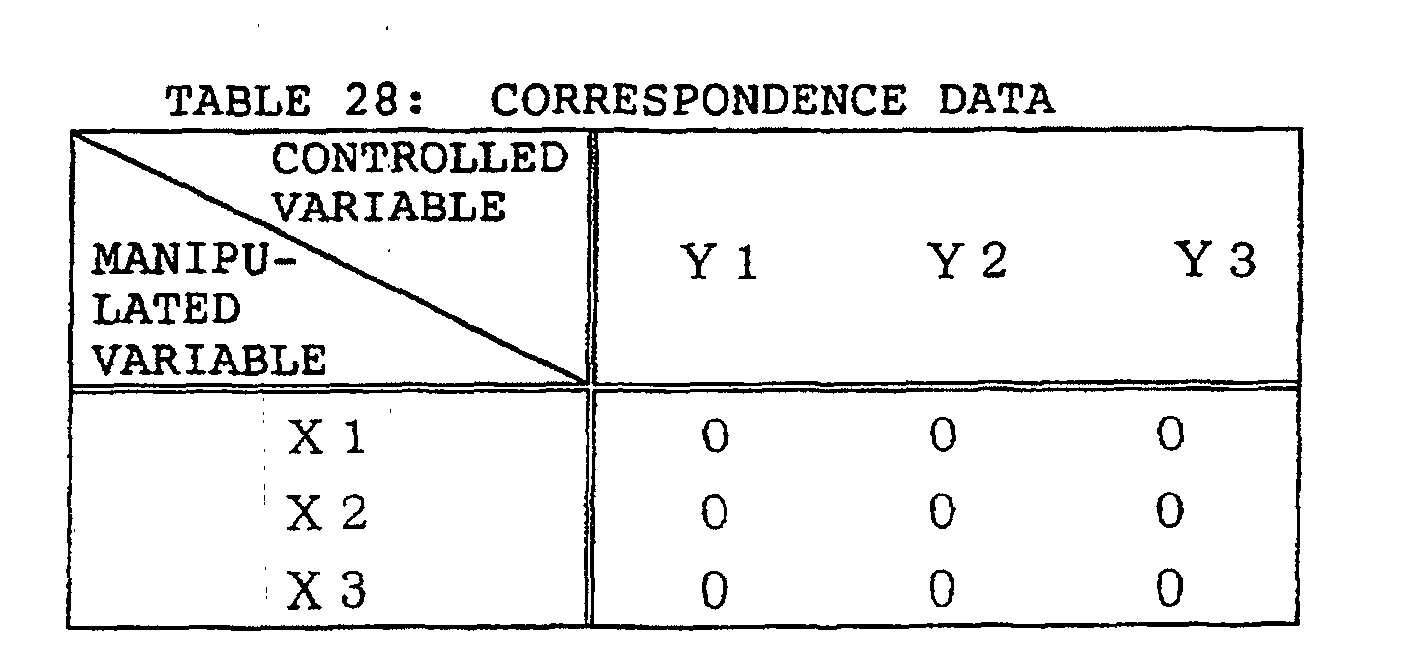
- the controlled variable selection unit 42 selects one controlled variable which does not correspond to any manipulated variable (controlled variable for which all correspondence data for manipulated variables are "0") in correspondence data from rule candidates with high priority (with small candidate numbers) which have not been checked ("0"). In this case, a first controlled variable Y1 as candidate 1 is selected.
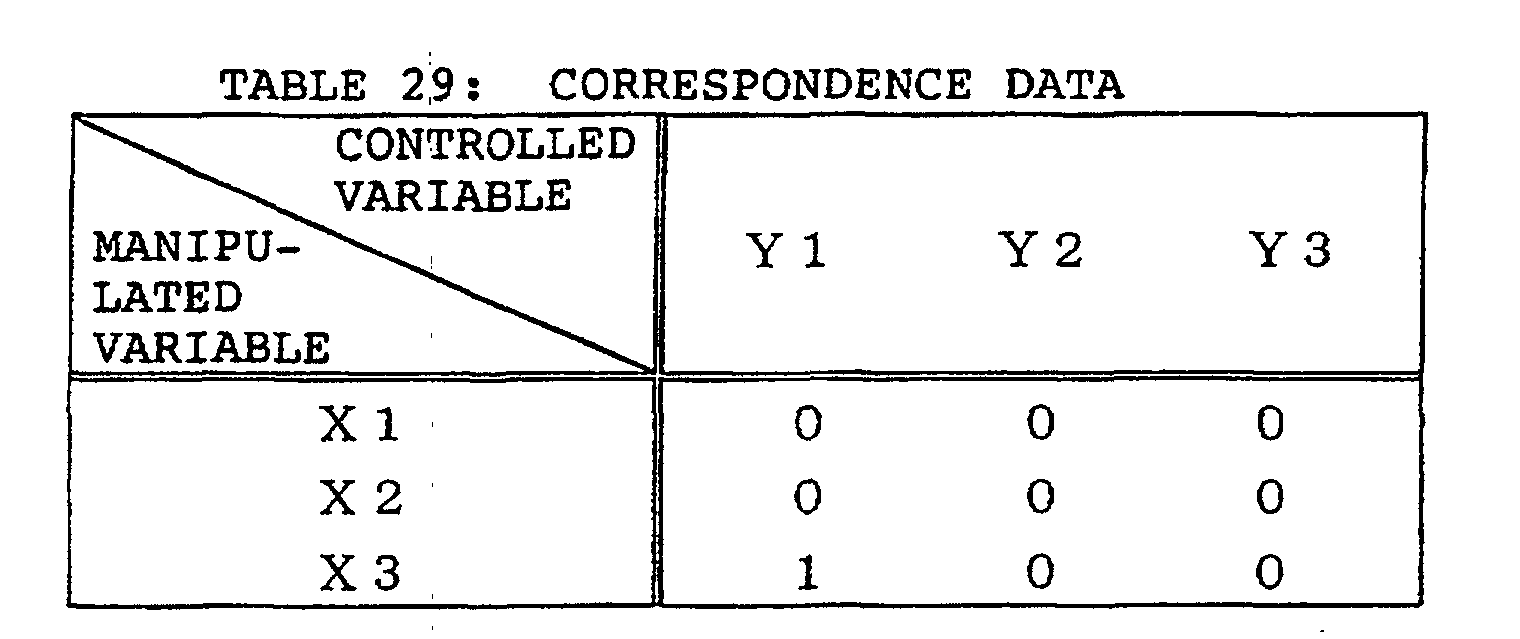
- the corresponding manipulated variable search unit 43 selects a manipulated variable corresponding to the selected first controlled variable on the basis of the input adjustment rule shown in Table 26 and updates the correspondence data in Table 28. More specifically, Table 26 is searched from the upper rule for a manipulated variable corresponding to the first controlled variable Y1. The correspondence data is updated on the basis of the search result. In this case, only a third manipulated variable X3 corresponds to the controlled variable Y1, so the correspondence data is updated like in Table 29.
- the controlled variable at the second order is a second controlled variable Y2.
- a corresponding manipulated variable is checked on the basis of the adjustment rules, as described above.
- the second manipulated variable is selected according to rule 1.
- a third controlled variable Y3 also corresponds to the second controlled variable on the basis of rule 1.
- rule 2 also corresponds to the third controlled variable, and eventually, the first manipulated variable is made to correspond to the third controlled variable.
- the rule candidate generating unit 44 searches for the correspondence data from the manipulated variables in accordance with the order of adjustment rules shown in Table 26, converts the table into a format as shown in Table 26, and stores it. In this case, Table 31 is obtained. That is, adjustment rules shown in Table 31 are obtained in correspondence with "rule candidate 1" and stored.
- the rule candidate initial setting unit 41 changes "0" of rule candidate 1 which has already been checked to "1" in the rule candidate data shown in Table 27.
- the rule candidate generating unit 44 also initializes the correspondence table to the state shown in Table 28 for "rule candidate 2".
- the rule group generating unit 45 omits same rules from the stored candidate rules and outputs the remaining as a rule group (Table 34).
- RULE GROUP (OUTPUT) CANDIDATE NUMBER CANDIDATE RULE 1 2 1 0 2 - 1 1 1 1 0 3 - 1 1 3 1 0 1 - 1 2 2 1 0 3 - 1 2 1 1 0 2 - 1 2 3 1 0 1 - 1 - 1 - 1
- FIG. 17 shows the arrangement of an automatic adjustment rule candidate generating apparatus 50 according to the seventh embodiment.
- the automatic adjustment rule candidate generating apparatus 50 comprises a dependency table candidate generating unit 51, a dependency table/rule candidate storage unit 52, and an adjustment rule generating apparatus 10.
- the automatic adjustment rule candidate generating apparatus 50 automatically prepares one or more "dependency tables" directly from the input/output data, thereby generating adjustment rules as candidates using the adjustment rule generating apparatus 10 described in the second embodiment.
- the dependency table candidate generating unit 51 calculates, from the actual data shown in Table 35, data of a change amount ⁇ ei of the deviation of a controlled variable from the change amount of each manipulated variable ⁇ Yi, as shown in Table 36 (i is a positive integer).
- the actual data of the adjustment object is not always independent data in units of manipulated variables first, as in Table 35.
- the quantity of data is often large.
- conversion to Table 36 can be realized by performing linear approximation using the method of least squares in association with the relationship between the change amount of the manipulated variable and that of the deviation of the controlled variable.
- Table 38 as a dependency table reflecting the actual adjustment object data in Table 35 can be obtained, like the dependency table shown in Table 4 described in the second embodiment. DEPENDENCY TABLE 1 3 1 0 1 0 1 1 0 1 1 1 1 1
- the dependency table candidate generating unit 51 prepares combinations of parameters in advance, generates dependency tables in correspondence with these combinations, and stores them in the dependency table/rule candidate storage unit 52.
- the dependency table of "number 1" has been generated above.
- the dependency table candidate generating unit 51 further generates the dependency table of "number 2" in accordance with Table 39.
- QUANTIZED INPUT/OUTPUT CHARACTERISTIC CHANGE ACTUAL DATA CHANGE AMOUNT OF MANIPULATED VARIABLE CHANGE AMOUNT OF DEVIATION QUANTIZATION UNIT) ⁇ X1 ⁇ X2 ⁇ X3 ⁇ e1 ⁇ e2 ⁇ e3 1.0 0.0 0.0 2 0 20 0.0 1.0 0.0 15 16 14 0.0 0.0 1.0 5 10 -10
- FIGS. 19A and 19B show correction of adjustable parameter gains k1 to k3 of a certain object when the characteristics of the object are adjusted to desired characteristics.
- FIG. 19A shows a state wherein the gains k1 to k3 become constant near "3" of the abscissa (axis corresponding to the correction count), and adjustment is complete.
- the gain k1 is gradually corrected over "2”
- the characteristics of the object are not improved, and adjustment of the gain k1 is repeated a number of times. It can be estimated that the object has a dead band for the gain k1.
- FIG. 19B shows a state wherein the gains k1 to k3 finally become constant, and adjustment is complete.
- FIG. 19B also shows a state wherein the gain k2 is repeatedly corrected with wasteful oscillations.
- the dead band in adjustment and the vibration phenomenon due to the nonlinearity of the object as shown in FIGS. 19A and 19B can be avoided, as shown in FIG. 19C.
- the desired adjusted state can be quickly ensured upon applying the present invention.
- the present invention can also be stored in a recording medium as software which can be read and executed by a computer, and distributed.
- the adjustment procedure is directly established from data of qualitative input/output relationship of the adjustment object or actual adjustment object data.
Landscapes
- Engineering & Computer Science (AREA)
- Artificial Intelligence (AREA)
- General Physics & Mathematics (AREA)
- General Engineering & Computer Science (AREA)
- Evolutionary Computation (AREA)
- Theoretical Computer Science (AREA)
- Software Systems (AREA)
- Physics & Mathematics (AREA)
- Automation & Control Theory (AREA)
- Computer Vision & Pattern Recognition (AREA)
- Health & Medical Sciences (AREA)
- Computational Linguistics (AREA)
- Data Mining & Analysis (AREA)
- Computing Systems (AREA)
- Mathematical Physics (AREA)
- Medical Informatics (AREA)
- Feedback Control In General (AREA)
Description
- Complex correlation between the parameter and the output
- Nonlinearity of the parameter and output
- Maldistribution of data
More specifically, even when data is to be semiautomatically processed and modeled, the human data determination reference must be defined in advance.
In this respect, the qualitative causality reasoning is essentially identical to the fuzzy inference (e.g., Jpn. Pat. Appln. KOKAI Publication No. 7-191706).
- Adjustment is performed while sampling data
- A large quantity of data is not required in advance
- Nonlinear characteristics can be coped with.
adjustable controlled variable selection means fo receiving a change in controlled variable corresponding to each manipulated variable of the adjustment object and qualitative feature data of a change difference between controlled variables and defining some manipulated variables which can be independently adjusted from the feature data in units of controlled variables, and adjustment rule format generating means for converting adjustable controlled variable data output from the adjustable controlled variable selection means in units of manipulated variables into a predetermined format and outputting the format as an adjustment procedure.
deviation data generating means for calculating a deviation of a controlled variable of an adjustment object and outputting the deviation, adjustment rule storage means for receiving the controlled variable deviation obtained from the deviation data generating means and storing an adjustment rule obtained in the first or second embodiment, application rule selection means for receiving the controlled variable deviation calculated by the deviation data generating means and the adjustment rule stored in the adjustment rule storage means, selecting a manipulated variable to be adjusted, and defining the selected manipulated variable as an application rule, and manipulated variable determination means for determining a correction amount of the manipulated variable selected by the application rule selection means with reference to the controlled variable deviation as a predetermined proportional amount of the deviation of the controlled variable corresponding to the manipulated variable defined by the application rule.
the manipulated variable determination means refers to the controlled variable deviation and the adjustment history data stored in the adjustment history data storage means in accordance with the application rule selected by the application rule selection means to determine the correction amount of the manipulated variable of the application rule or a manipulated variable other than the manipulated variable as a proportional amount of the controlled variable deviation or a relative difference from another controlled variable deviation, or independently of the proportional amount, newly stores the determined manipulated variable or controlled variable deviation data referred to in determining the manipulated variable in the adjustment history data storage means, and updates the adjustment history data.

| ADJUSTMENT CHARACTERISTIC DATA | ||
| X1 | Y2, Y3 | A |
| X2 | Y1 | C |
| X3 | Y2, Y3 | B |
(ε1, ε2, andε3 are allowable deviations)

| INPUT DATA "DEPENDENCY TABLE" | ||
| 3 | ||
| 1 | 0 | 1 |
| 0 | 1 | 1 |
| 0 | 1 | 1 |
| 1 | 1 | 1 |
| DESCRIPTION OF "DEPENDENCY TABLE" | |||
| DEPENDENCY TABLE | DESCRIPTION | ||
| 3 | NUMBER OF MANIPULATED VARIABLES | ||
| 1 | 0 | 1 | CHANGE PATTERN OF CONTROLLED VARIABLES DUE TO EACH MANIPULATED VARIABLE (ADJUSTMENT CHARACTER-ISTIC DATA: CHANGE IN THE SAME DIRECTION "0" OR CHANGE IN |
| 0 | 1 | 1 | DIFFERENT DIRECTIONS "1") WHETHER EACH MANIPULATED VARIABLE AFFECTS THE FIRST CONTROLLED VARIABLE (1) OR NOT (0) (CONTROLLED VARIABLE |
| 0 | 1 | 1 | CORRECTION CHARACTERISTIC DATA) WHETHER EACH MANIPULATED VARIABLE AFFECTS THE SECOND CONTROLLED VARIABLE (1) OR NOT (0) (CONTROLLED VARIABLE |
| 1 | 1 | 1 | CORRELATION CHARACTERISTIC DATA) WHETHER EACH MANIPULATED VARIABLE AFFECTS THE THIRD CONTROLLED VARIABLE (1) OR NOT (0) (CONTROLLED VARIABLE CORRELATION CHARACTERISTIC DATA) |
- Check 0 flag: number (which is selected first) of the offset manipulated variable (other than the selected offset manipulated variable)
- Check 1 flag: 1 <present>
- Check 2 flag: the number of the gradient manipulated variable (which is selected first).
- Check 3 flag: number of the gradient manipulated variable (which is selected first).
- Rule flag: contents of check 1 flag
- Rule flag: contents of check 1 flag
- Rule flag: contents of check 2 flag
- Rule flag: contents of check 3 flag
- Rule flag: contents of check 2 flag
- Check level = 2
- Rule determination, check level = no change
- Flag initialization
| THREE-DIMENSIONAL EXAMPLE IN TABLE 4 | ||||
| MANIPULATED VARIABLE | ROW SUM | |||
| X1 | X2 | X3 | ||
| CONTROLLED VARIABLE Y1 | 0 | 1 | 1 | 2 |
| CONTROLLED VARIABLE Y2 | 0 | 1 | 1 | 2 |
| CONTROLLED VARIABLE Y3 | 1 | 1 | 1 | 3 |
| COLUMN SUM | 1 | 3 | 3 |
| ORDER OF MANIPULATED VARIABLE IN EXAMPLE OF TABLE 4 | |||
| MANIPULATED VARIABLE | X1 | X2 | X3 |
| ORDER | 3 | 1 | 2 |
| ORDER OF CONTROLLED VARIABLES IN EXAMPLE OF TABLE 4 | |||
| CONTROLLED VARIABLE | Y1 | Y2 | Y3 |
| ORDER | 1 | 1 | 2 |
"0" for both offset manipulated variable and gradient manipulated variable
| EXAMPLE OF ADJUSTMENT RULES | |||||
| 2 | 0 | 2 | 1 | 2 | - 1 |
| 3 | 1 | 1 | 1 | 2 | - 1 |
| 1 | 1 | 0 | 3 | - 1 |
| FORMAT OF ADJUSTMENT RULE | |||||
| NUMBER OF MANIPULATED VARIABLE TO BE CORRECTED | OFFSET (0) OR GRADIENT (1) | PATTERN OF CONTROLLED VARIABLE TO BE ADJUSTED | NUMBER OF CONTROLLED VARIABLE TO BE ADJUSTED | ··· | ROW END IDENTIFIER |
The respective columns in each row have the following meanings. As shown in Table 10, the first element represents "number of manipulated variable to be corrected"; the second element, "offset or gradient"; the third element, "pattern of controlled variable to be adjusted"; and the fourth element, "numbers of controlled variables to be adjusted". "-1" at the end of each row means the end of the row (identifier indicating the end of the row). According to this rule, "correct" and "adjust" mean that the manipulated variable is corrected to adjust the controlled variable (to a desired value).
| FORMAT OF ADJUSTMENT RULE | |||||
| 2 | 0 | 2 | 1 | 2 | - 1 |
The fourth item is "1", and this means that the first controlled variable (if it is out of the allowable range) is adjusted as the first priority. The fifth item is "2", and this means that "the second controlled variable (if it is out of the allowable range) is adjusted as the second priority". The sixth item is "-1", and this means that "controlled variables as adjustment objects of this rule are not present anymore".
| INTERPRETATION OF ADJUSTMENT RULE | |
| RULE 1) | WHEN BOTH FIRST AND SECOND CONTROLLED VARIABLES ARE OUT OF ALLOWANCES, ADJUSTMENT IS PERFORMED USING SECOND MANIPULATED VARIABLE ON THE BASIS OF SMALLER ERROR |
| RULE 2) | WHEN ONE OF FIRST AND SECOND CONTROLLED VARIABLES IS OUT OF ALLOWANCE, ADJUSTMENT IS PERFORMED USING THIRD MANIPULATED VARIABLE |
| RULE 3) | WHEN THIRD CONTROLLED VARIABLE IS OUT OF ALLOWANCE, ADJUSTMENT IS PERFORMED |
| USING FIRST MANIPULATED VARIABLE |
| ADJUSTMENT HISTORY | ||||||
| ADJUSTMENT COUNT | CORRECTION AMOUNT | DEVIATION AFTER ADJUSTMENT | ||||
| u 1 | u 2 | u 3 | e 1 | e 2 | e 3 | |
| 0 | 0.0 | 0.0 | 0.0 | 3.0 | 0.1 | 2.5 |
| 1 | 0.0 | 0.0 | -2.9 | 1.5 | 1.0 | 2.0 |
| 2 | 0.0 | -1.0 | 0.0 | -0.9 | -1.4 | -0.4 |
| 3 | 0.0 | 0.9 | 0.0 | 1.2 | 0.8 | 1.8 |
| 4 | 0.0 | -0.8 | 0.0 | -0.7 | -1.1 | -0.1 |
| . | . | . | ||||
| . | . | . | ||||
| . | . | . |
| ADJUSTMENT HISTORY | ||||||
| ADJUSTMENT COUNT | CORRECTION AMOUNT | DEVIATION AFTER ADJUSTMENT | ||||
| u 1 | u 2 | u 3 | e 1 | e 2 | e 3 | |
| . | . | . | ||||
| . | . | . | ||||
| . | . | . | ||||
| 4 | 0.0 | -0.8 | 0.0 | -0.7 | -1.1 | -0.1 |
| 5 | 0.0 | 0.35 | 0.0 | 0.1 | -0.3 | 0.7 |
| 6 | -0.7 | 0.0 | 0.0 | 0.4 | 0.4 | 0.1 |
| EXCEPTIONAL PROCESSING | |
| CONDITION | PROCESSING |
| DEVIATION VIBRATES BETWEEN POSITIVE AND NEGATIVE VALUES UPON REPEATEDLY CORRECTING THE SAME MANIPULATED VARIABLE | PROPORTIONAL COEFFICIENT IS MULTIPLIED BY WEIGHT (0 TO 1) (ABOVE EXAMPLE) |
| DEVIATION HAVING THE SAME SIGN IS REPEATEDLY OBTAINED UPON REPEATEDLY CORRECTING THE SAME MANIPULATED VARIABLE | PROPORTIONAL COEFFICIENT IS MULTIPLIED BY WEIGHT (1 OR MORE) |
| DEVIATION INCREASES WITHOUT CHANGING SIGN UPON CORRECTING MANIPULATED VARIABLE | SIGN OF PROPORTIONAL COEFFICIENT IS INVERTED |
| DEVIATION DOES NOT CHANGE UPON CORRECTING MANIPULATED VARIABLE | ANOTHER PREDETERMINED (ONE OR MORE) MANIPULATED VARIABLE IS CORRECTED BY PREDETERMINED AMOUNT |
| ADJUSTMENT HISTORY | |||||||
| ADJUSTMENT COUNT | ACTUAL ADJUSTMENT (0) OR TEST ADJUSTMENT (1) | CORRECTION AMOUNT | DEVIATION AFTER ADJUSTMENT | ||||
| u1 | u2 | u3 | e1 | e2 | e3 | ||
| 0 | 0 | 0.0 | 0.0 | 0.0 | 3.0 | 0.1 | 2.5 |
| 1 | 1 | 0.0 | 0.0 | 1.0 | 3.5 | -0.3 | 2.7 |

| ADJUSTMENT HISTORY | |||||||
| ADJUSTMENT COUNT | ACTUAL ADJUSTMENT (0) OR TEST ADJUSTMENT (1) | CORRECTION AMOUNT | DEVIATION AFTER ADJUSTMENT | ||||
| u1 | u2 | u3 | e1 | e2 | e3 | ||
| 0 | 0 | 0.0 | 0.0 | 0.0 | 3.0 | 0.1 | 2.5 |
| 1 | 1 | 0.0 | 0.0 | 1.0 | 3.5 | -0.3 | 2.7 |
| 2 | 0 | 0.0 | 0.0 | -4.2 | 1.4 | 0.9 | 2.0 |
| ADJUSTMENT HISTORY | |||||||
| ADJUSTMENT COUNT | ACTUAL ADJUSTMENT (0) OR TEST ADJUSTMENT (1) | CORRECTION AMOUNT | DEVIATION AFTER ADJUSTMENT | ||||
| u1 | u2 | u3 | e1 | e2 | e3 | ||
| 0 | 0 | 0.0 | 0.0 | 0.0 | 3.0 | 0.1 | 2.5 |
| 1 | 1 | 0.0 | 0.0 | 1.0 | 3.5 | -0.3 | 2.7 |
| 2 | 0 | 0.0 | 0.0 | -4.2 | 1.4 | 0.9 | 2.0 |
| 3 | 1 | 0.0 | 1.0 | 0.0 | 3.6 | 3.1 | 4.2 |

| ADJUSTMENT HISTORY | |||||||
| ADJUSTMENT COUNT | ACTUAL ADJUSTMENT (0) OR TEST ADJUSTMENT (1) | CORRECTION AMOUNT | DEVIATION AFTER ADJUSTMENT | ||||
| u1 | u2 | u3 | e1 | e2 | e3 | ||
| 0 | 0 | 0.0 | 0.0 | 0.0 | 3.0 | 0.1 | 2.5 |
| 1 | 1 | 0.0 | 0.0 | 1.0 | 3.5 | -0.3 | 2.7 |
| 2 | 0 | 0.0 | 0.0 | -4.2 | 1.4 | 0.9 | 2.0 |
| 3 | 1 | 0.0 | 1.0 | 0.0 | 3.6 | 3.1 | 4.2 |
| 4 | 0 | 0.0 | -1.4 | 0.0 | 0.4 | -0.1 | 1.0 |
| ADJUSTMENT HISTORY | |||||||
| ADJUSTMENT COUNT | ACTUAL ADJUSTMENT (0) OR TEST ADJUSTMENT (1) | CORRECTION AMOUNT | DEVIATION AFTER ADJUSTMENT | ||||
| u1 | u2 | u3 | e1 | e2 | e3 | ||
| 0 | 0 | 0.0 | 0.0 | 0.0 | 3.0 | 0.1 | 2.5 |
| 1 | 1 | 0.0 | 0.0 | 1.0 | 3.5 | -0.3 | 2.7 |
| 2 | 0 | 0.0 | 0.0 | -4.2 | 1.4 | 0.9 | 2.0 |
| 3 | 1 | 0.0 | 1.0 | 0.0 | 3.6 | 3.1 | 4.2 |
| 4 | 0 | 0.0 | -1.4 | 0.0 | 0.4 | -0.1 | 1.0 |
| 5 | 1 | 1.0 | 0.0 | 0.0 | 0.4 | -0.1 | 1.9 |

| ADJUSTMENT HISTORY | |||||||
| ADJUSTMENT COUNT | ACTUAL ADJUSTMENT (0) OR TEST ADJUSTMENT (1) | CORRECTION AMOUNT | DEVIATION AFTER ADJUSTMENT | ||||
| u1 | u2 | u3 | e1 | e2 | e3 | ||
| 0 | 0 | 0.0 | 0.0 | 0.0 | 3.0 | 0.1 | 2.5 |
| 1 | 1 | 0.0 | 0.0 | 1.0 | 3.5 | -0.3 | 2.7 |
| 2 | 0 | 0.0 | 0.0 | -4.2 | 1.4 | 0.9 | 2.0 |
| 3 | 1 | 0.0 | 1.0 | 0.0 | 3.6 | 3.1 | 4.2 |
| 4 | 0 | 0.0 | -1.4 | 0.0 | 0.4 | -0.1 | 1.0 |
| 5 | 1 | 1.0 | 0.0 | 0.0 | 0.4 | -0.1 | 1.9 |
| 6 | 0 | -2.1 | 0.0 | 0.0 | 0.4 | -0.1 | -0.1 |
| EXCEPTIONAL PROCESSING | |
| CONDITION | PROCESSING |
| DEVIATION VIBRATES BETWEEN POSITIVE AND NEGATIVE VALUES UPON REPEATEDLY CORRECTING THE SAME MANIPULATED VARIABLE IN ACTUAL ADJUSTMENT | PROPORTIONAL COEFFICIENT IS MULTIPLIED BY WEIGHT (0 TO 1) |
| DEVIATION HAVING THE SAME SIGN IS REPEATEDLY OBTAINED UPON REPEATEDLY CORRECTING THE SAME MANIPULATED VARIABLE IN ACTUAL ADJUSTMENT | RELIABILITY COEFFICIENT IS MULTIPLIED BY WEIGHT (1 OR MORE) |
| DEVIATION INCREASES WITHOUT CHANGING SIGN UPON ACTUAL ADJUSTMENT | SIGN OF RELIABILITY COEFFICIENT IS INVERTED |
| DEVIATION DOES NOT CHANGE UPON TEST ADJUSTMENT | ANOTHER PREDETERMINED (ONE OR MORE) MANIPULATED VARIABLE IS CORRECTED BY PREDETERMINED AMOUNT IN ACTUAL ADJUSTMENT (DEAD BAND) |
| DEVIATION DOES NOT CHANGE UPON ACTUAL ADJUSTMENT | ANOTHER PREDETERMINED (ONE OR MORE) MANIPULATED VARIABLE IS CORRECTED BY PREDETERMINED AMOUNT IN ACTUAL ADJUSTMENT (DEAD BAND) |
| DEPENDENCY TABLE | ||
| 3 | ||
| 1 | 1 | 1 |
| 0 | 1 | 1 |
| 1 | 1 | 0 |
| 1 | 1 | 0 |
| ADJUSTMENT RULE CORRESPONDING TO DEPENDENCY TABLE IN TABLE 22 | |||||
| 2 | 1 | 0 | 2 | 3 | - 1 |
| 1 | 1 | 0 | 2 | 3 | - 1 |
| 3 | 1 | 0 | 1 | - 1 |
| RULE CANDIDATE DATA | ||||
| CANDIDATE NUMBER | ORDER OF SELECTION | CHECKED | ||
| 1 | 1 | 2 | 3 | 0 |
| 2 | 1 | 3 | 2 | 0 |
| 3 | 2 | 1 | 3 | 0 |
| 4 | 2 | 3 | 1 | 0 |
| 5 | 3 | 1 | 2 | 0 |
| 6 | 3 | 2 | 1 | 0 |

| ADJUSTMENT RULE CORRESPONDING TO RULE CANDIDATE 1 | ||||
| 2 | 1 | 0 | 2 | - 1 |
| 1 | 1 | 0 | 3 | - 1 |
| 3 | 1 | 0 | 1 | - 1 |
| ADJUSTMENT RULE CORRESPONDING TO RULE CANDIDATE 2 | ||||
| 2 | 1 | 0 | 2 | - 1 |
| 1 | 1 | 0 | 3 | - 1 |
| 3 | 1 | 0 | 1 | - 1 |
| CANDIDATE RULE OF RULE CANDIDATE GENERATING UNIT 44 | |||||
| CANDIDATE NUMBER | CANDIDATE RULE | ||||
| 1 | 2 | 1 | 0 | 2 | - 1 |
| 1 | 1 | 1 | 0 | 3 | - 1 |
| 1 | 3 | 1 | 0 | 1 | - 1 |
| 2 | 2 | 1 | 0 | 3 | - 1 |
| 2 | 1 | 1 | 0 | 2 | - 1 |
| 2 | 3 | 1 | 0 | 1 | - 1 |
| 3 | 2 | 1 | 0 | 2 | - 1 |
| 3 | 1 | 1 | 0 | 3 | - 1 |
| 3 | 3 | 1 | 0 | 1 | - 1 |
| 4 | 2 | 1 | 0 | 2 | - 1 |
| 4 | 1 | 1 | 0 | 3 | - 1 |
| 4 | 3 | 1 | 0 | 1 | - 1 |
| 5 | 2 | 1 | 0 | 3 | - 1 |
| 5 | 1 | 1 | 0 | 2 | - 1 |
| 5 | 3 | 1 | 0 | 1 | - 1 |
| 6 | 2 | 1 | 0 | 3 | - 1 |
| 6 | 1 | 1 | 0 | 2 | - 1 |
| 6 | 3 | 1 | 0 | 1 | - 1 |
| RULE GROUP (OUTPUT) | |||||
| CANDIDATE NUMBER | CANDIDATE RULE | ||||
| 1 | 2 | 1 | 0 | 2 | - 1 |
| 1 | 1 | 1 | 0 | 3 | - 1 |
| 1 | 3 | 1 | 0 | 1 | - 1 |
| 2 | 2 | 1 | 0 | 3 | - 1 |
| 2 | 1 | 1 | 0 | 2 | - 1 |
| 2 | 3 | 1 | 0 | 1 | - 1 |
| ACTUAL DATA OF ADJUSTMENT OBJECT | |||||
| MANIPULATED VARIABLE (INPUT DATE) | CONTROLLED VARIABLE DEVIATION (OUTPUT DATA) | ||||
| X1 | X2 | X3 | e1 | e2 | e3 |
| 0.0 | 0.0 | 0.0 | -0.1 | -0.2 | 0.0 |
| 1.0 | 0.0 | 0.0 | 0.1 | -2.0 | 2.0 |
| 0.0 | 1.0 | 0.0 | 1.4 | -0.4 | 1.4 |
| 0.0 | 0.0 | 1.0 | 0.4 | -1.0 | -1.0 |
| INPUT/OUTPUT CHARACTERISTIC CHANGE ACTUAL DATA | |||||
| CHANGE AMOUNT OF MANIPULATE VARIABLE | CHANGE AMOUNT OF CONTROLLED VARIABLE DEVIATION | ||||
| ΔX1 | ΔX2 | ΔX3 | Δe1 | Δe2 | Δe3 |
| 1.0 | 0.0 | 0.0 | 0.2 | 0.0 | 2.0 |
| 0.0 | 1.0 | 0.0 | 1.5 | 1.6 | 1.4 |
| 0.0 | 0.0 | 1.0 | 0.5 | 1.0 | -1.0 |
| QUANTIZED INPUT/OUTPUT CHARACTERISTIC CHANGE ACTUAL DATA (U=0.3) | |||||
| CHANGE AMOUNT OF MANIPULATED VARIABLE | CHANGE AMOUNT OF (DEVIATION QUANTIZATION UNIT) | ||||
| ΔX1 | ΔX2 | ΔX3 | Δe1 | Δe2 | Δe3 |
| 1.0 | 0.0 | 0.0 | 0 | 0 | 6 |
| 0.0 | 1.0 | 0.0 | 5 | 5 | 4 |
| 0.0 | 0.0 | 1.0 | 1 | 3 | -3 |
- a manipulated variable for which controlled variables changing in a similar manner (controlled variables having a value within the range of ±N for quantization unit; in this case, N = 1) are present is regarded as an offset manipulated variable ("0"); otherwise, a gradient manipulated variable ("1").
- "1" is set in items other than "0" in the dependency table.
| DEPENDENCY TABLE 1 | ||
| 3 | ||
| 1 | 0 | 1 |
| 0 | 1 | 1 |
| 0 | 1 | 1 |
| 1 | 1 | 1 |
| PARAMETER FOR GENERATING DEPENDENCY TABLE | ||
| CORRESPONDING DEPENDENCY TABLE NUMBER | U | N |
| 1 | 0.3 | 1 |
| 2 | 0.1 | 4 |
| QUANTIZED INPUT/OUTPUT CHARACTERISTIC CHANGE ACTUAL DATA | |||||
| CHANGE AMOUNT OF MANIPULATED VARIABLE | CHANGE AMOUNT OF DEVIATION QUANTIZATION UNIT) | ||||
| ΔX1 | ΔX2 | ΔX3 | Δe1 | Δe2 | Δe3 |
| 1.0 | 0.0 | 0.0 | 2 | 0 | 20 |
| 0.0 | 1.0 | 0.0 | 15 | 16 | 14 |
| 0.0 | 0.0 | 1.0 | 5 | 10 | -10 |
| DEPENDENCY TABLE 2 | ||
| 3 | ||
| 1 | 0 | 1 |
| 1 | 1 | 1 |
| 0 | 1 | 1 |
| 1 | 1 | 1 |
| ADJUSTMENT RULES CORRESPONDING TO DEPENDENCY TABLE 1 | |||||
| 2 | 0 | 2 | 1 | 2 | - 1 |
| 3 | 1 | 1 | 1 | 2 | - 1 |
| 1 | 1 | 0 | 3 | - 1 |
| ADJUSTMENT RULES CORRESPONDING TO DEPENDENCY TABLE 2 | ||||
| 2 | 0 | 0 | 2 | - 1 |
| 3 | 1 | 0 | 3 | - 1 |
| 1 | 1 | 0 | 1 | - 1 |
Claims (20)
- An adjustment rule generating method of making a first data group (y1,y2,...) corresponding to outputs of a predetermined object (30) have a desired value by determining a second data group (x1,x2,...) corresponding to inputs to said object (30), comprising the step ofobtaining, on the basis of data obtained from said object (30), predetermined first data (y1,y2,...) influenced by predetermined second data (x1,x2,...) the predetermined first data corresponding to the outputs of said object (30) and the predetermined second data corresponding to the inputs to said object (30); characterized byselecting specific second data on the basis of the predetermined first data influenced by the predetermined second data and simultaneously selecting specific first data on the basis of the predetermined second data influencing the predetermined first data, anddetermining the specific second data capable of corresponding to said selected specific first data from the second data group.
- The method according to claim 1, characterized in thatthe obtaining step comprises the step of
obtaining change characteristics between predetermined first data (y1,y2,...) influenced by predetermined second data (x1,x2,...), andthe selecting step comprises the step of
selecting specific first data having change characteristics between outputs capable of correcting the change characteristics between the first data from the first data. - The method according to claim 1, characterized in thatthe obtaining step comprises the step of
obtaining predetermined first data (y1,y2,...) influenced by predetermined second data (x1,x2,...), and change characteristics between the predetermined first data, andthe selecting step comprises the step of
selecting specific first data having change characteristics between outputs capable of correcting the change characteristics between the first data from the first data. - The method according to claim 1, characterized in that the selecting step comprises the step of
selecting the specific second data on the basis of the predetermined first data influenced by the predetermined second data and simultaneously selecting the specific first data on the basis of the predetermined second data influencing the predetermined first data. - An adjustment rule generating apparatus for making a first data group (y1,y2,...) corresponding to outputs of a predetermined object (30) have a desired value by determining a second data group (x1,x2,...) corresponding to inputs to said object (30), comprisingan obtaining unit that obtains, on the basis of data obtained from said object (30), predetermined first data (y1,y2,...) influenced by predetermined second data (x1,x2,...), the predetermined first data corresponding to the outputs of said object (30) and the predetermined second data corresponding to the inputs to said object (30); characterized bya selecting unit (11) that selects specific second data on the basis of the predetermined first data influenced by the predetermined second data and that simultaneously selects specific first data on the basis of the predetermined second data influencing the predetermined first data, anda determining unit that determines the specific second data capable of corresponding to the selected specific first data from the second data group.
- The apparatus according to claim 5, characterized in thatthe obtaining unit obtains change characteristics between predetermined first data (y1,y2,...) influenced by predetermined second data (x1,x2,...), andthe selecting unit (11) selects specific first data having change characteristics between outputs capable of correcting the change characteristics between the first data from the first data.
- The apparatus according to claim 5, characterized in thatthe obtaining unit obtains predetermined first data (y1,y2,...) influenced by predetermined second data (x1,x2,...) and change characteristics between the predetermined first data, andthe selecting unit (11) selects specific first data having change characteristics between outputs capable of correcting the change characteristics between the first data from the first data.
- The apparatus according to claim 5, characterized in that the selecting unit (11) further selects the specific second data on the basis of the predetermined first data influenced by the predetermined second data and simultaneously selects the specific first data on the basis of the predetermined second data influencing the predetermined first data.
- The apparatus according to claim 5, characterized in thatthe selection unit (11,12) comprisesan adjustable controlled variable selection unit (11) that receives a change in controlled variable corresponding to each manipulated variable of said object (30) and qualitative feature data of a change difference between controlled variables and that defines at least one manipulated variable which can be independently adjusted from the feature data in units of controlled variables, wherein each manipulated variable of said object (30) corresponds to a respective one of said inputs to said object (30), and wherein each controlled variable corresponds to a respective one of said outputs of said object (30), andan adjustment rule format generating unit (12) that converts adjustable controlled variable data output from said adjustable controlled variable selection unit (11) into a predetermined format in units of manipulated variables and that outputs the predetermined format as an adjustment procedure.
- The apparatus according to claim 5, characterized in thatthe selection unit (11,12) comprisesan input unit that inputs data representing qualitative characteristics of an input and an output of said object (30);a first generating unit (11) that generates adjustment characteristic data representing a relationship between a specific controlled variable corresponding to the output of said object (30) and a specific manipulated variable corresponding to the input to said object (30), on the basis of the input data to adjust the controlled variable, anda second generating unit (12) that converts the adjustment characteristic data generated by said first generating unit (11) into a predetermined format and that generates the adjustment rule.
- The apparatus according to claim 10, characterized in that the input data includes dependency characteristic data representing presence/absence of a dependency relationship in said object (30) between the manipulated variable and the controlled variable.
- The apparatus according to claim 10, characterized in that the input data includes controlled variable correlation characteristic data representing correlation characteristics between a plurality of controlled variables output from said object (30).
- The apparatus according to claim 12, characterized in that the correlation characteristic data represents at least one of characteristics in which a first controlled variable and a second controlled variable change in the same direction, characteristics in which the first controlled variable and the second controlled variable change in different directions, and characteristics in which both the controlled variables change substantially independently.
- An adjustment control apparatus comprising anadjustment rule storage unit (21) that stores a plurality of adjustment rules generated by the adjustment rule generating apparatus (10) according to one of claims 5 to 13a deviation data generating unit (22) that generaces deviation data about a first data group (y1,y2,...) corresponding to outputs of a predetermined object (30) such that the first data group of the object (30) has a desired value and that outputs. the deviation dataan application rule selection unit (23) that selects second data to be adjusted and that simultaneously determines an application rule upon receiving the deviation data generated by said deviation data generating unit (22) and the adjustment rule stored in said adjustment rule storage unit (21), the second data corresponding to inputs to said object (30); anda correction amount determination unit (24) that defines a correction amount of the second data selected by said application rule selection unit (23), with reference to the deviation data, as a predetermined proportional amount of the deviation corresponding to the second data defined by the application rule.
- The apparatus according to claim 14, characterized by comprising an adjustment history data storage unit (25) that records and updates adjustment history data, and wherein said correction amount determination unit (24) refers to the deviation data and the adjustment history data in said adjustment history data storage unit (25) in accordance with the application rule selected by said application rule selection unit (23) to determine the correction amount as a proportional amount of a relative difference from another deviation, or regardless of the proportional amount, newly stores the determined correction amount and the deviation data referred to in determining the correction amount in said adjustment history data storage unit (25), and updates the adjustment history data.
- The apparatus according to claim 14, characterized in thatsaid rule selection unit (23) performs test adjustment and actual adjustment for identifying characteristics of said object (30) with reference to the adjustment history data stored in said adjustment history data storage unit (25), andsaid correction amount determination unit (24) refers to data obtained from said adjustment history data storage unit (25) and deviation data of the current second data of said adjustment object (30) to determine second data for test adjustment or actual adjustment, newly stores the determined second data and the deviation data referred to in determining the second data in said adjustment history data storage unit (25), and updates the adjustment history data.
- An adjustment possibility evaluation apparatus that evaluates whether an object (30) can be adjusted using an adjustment rule including information for defining a manipulated variable corresponding to an input to said object (30) such that a controlled variable corresponding to an output from said object (30) is set within an allowable range of a target figure, comprisingan input unit that inputs the adjustment rule generated by the adjustment rule generating apparatus (10) according to one of claims 5 to 13,a rule candidate initial setting unit (41) that initial sets adjustment rules in which manipulated variables and controlled variables are in one-to-one correspondence as candidate rules,a controlled variable selection unit (42) that selects a controlled variable to check whether adjustment is enabled for each candidate rule set by said rule candidate initial setting unit (41),a corresponding manipulated variable search unit (43) that searches for a manipulated variable which corresponds to the controlled variable selected by said controlled variable selection unit (42) and can adjust the controlled variable,a rule candidate generating unit (44) that stores the candidate rule as a rule candidate when all the controlled variables can be adjusted on the basis of the candidate rule set by said rule candidate initial setting unit (41), anda rule group generating unit (45) that outputs a rule group while omitting the same rule candidate stored in said rule candidate generating unit(44).
- An adjustment rule candidate generating apparatus generating adjustment rule candidates from a plurality of dependency tables, comprisinga dependency table candidate generating unit (51) that generates a plurality of dependency table candidates on the basis of actual input/output data of an adjustment object (30);an adjustment rule generating apparatus (10) according to one of claims 5 to 13 that receives the dependency table candidates and generating adjustment rules corresponding to the dependency table candidates, anda storage unit (52) that stores the plurality of adjustment rules obtained by inputting the plurality of dependency table candidates in said adjustment rule generating apparatus (10).
- A computer program comprising computer program code adapted to perform all steps of the method of one of claims 1 to 4, when the program is run on a computer.
- A computer program as claimed in claim 19 embodied on a computer readable medium.
Applications Claiming Priority (3)
| Application Number | Priority Date | Filing Date | Title |
|---|---|---|---|
| JP26073/97 | 1997-01-25 | ||
| JP2607397 | 1997-01-25 | ||
| JP2607397 | 1997-01-25 |
Publications (2)
| Publication Number | Publication Date |
|---|---|
| EP0856787A1 EP0856787A1 (en) | 1998-08-05 |
| EP0856787B1 true EP0856787B1 (en) | 2001-06-13 |
Family
ID=12183494
Family Applications (1)
| Application Number | Title | Priority Date | Filing Date |
|---|---|---|---|
| EP98101216A Expired - Lifetime EP0856787B1 (en) | 1997-01-25 | 1998-01-23 | Adjustment rule generating method, adjustment rule generating apparatus, adjustment control method, and adjustment control apparatus |
Country Status (4)
| Country | Link |
|---|---|
| US (1) | US6438532B1 (en) |
| EP (1) | EP0856787B1 (en) |
| CN (1) | CN1218244C (en) |
| DE (1) | DE69800898T2 (en) |
Families Citing this family (13)
| Publication number | Priority date | Publication date | Assignee | Title |
|---|---|---|---|---|
| DE19857799A1 (en) * | 1998-12-15 | 2000-06-21 | Henkel Kgaa | Method of controlling a treatment line |
| AU2001265362A1 (en) * | 2000-06-30 | 2002-01-14 | The Dow Chemical Company | Multi-variable matrix process control |
| US7027446B2 (en) * | 2001-07-18 | 2006-04-11 | P-Cube Ltd. | Method and apparatus for set intersection rule matching |
| JP4112900B2 (en) * | 2002-05-21 | 2008-07-02 | 株式会社山武 | Control method and control apparatus |
| JP4010877B2 (en) * | 2002-06-03 | 2007-11-21 | 富士通株式会社 | Optical transmission system |
| WO2005083531A1 (en) * | 2004-02-27 | 2005-09-09 | Matsushita Electric Industrial Co., Ltd. | Device control method and device control apparatus |
| DE102004057855A1 (en) | 2004-11-30 | 2006-06-08 | Deutsches Zentrum für Luft- und Raumfahrt e.V. | Method of detecting hot targets on the ground |
| JP4325618B2 (en) * | 2005-12-29 | 2009-09-02 | セイコーエプソン株式会社 | Optical aperture device, projector, correction parameter calibration device, and correction parameter calibration method |
| US7987005B2 (en) * | 2006-12-19 | 2011-07-26 | Chevron U.S.A. Inc. | System, method and program for dynamic control and optimization of a process having manipulated and controlled variables |
| US9400639B2 (en) * | 2012-06-22 | 2016-07-26 | Microsoft Technology Licensing, Llc | Generating programs using context-free compositions and probability of determined transformation rules |
| US9861035B2 (en) * | 2015-05-01 | 2018-01-09 | Deere & Company | Height of cut control system |
| US11831722B2 (en) * | 2018-12-20 | 2023-11-28 | Telefonaktiebolaget Lm Ericsson (Publ) | Functions and methods for handling pre-configured profiles for sets of detection and enforcement rules |
| CN116450708B (en) * | 2023-06-13 | 2023-09-01 | 南京市城市数字治理中心 | Enterprise data mining method and system |
Family Cites Families (21)
| Publication number | Priority date | Publication date | Assignee | Title |
|---|---|---|---|---|
| JPS5977504A (en) | 1982-10-26 | 1984-05-04 | Yokogawa Hokushin Electric Corp | Non-interference controlling system |
| US4730259A (en) | 1985-03-01 | 1988-03-08 | Gallant Stephen I | Matrix controlled expert system producible from examples |
| US4754410A (en) * | 1986-02-06 | 1988-06-28 | Westinghouse Electric Corp. | Automated rule based process control method with feedback and apparatus therefor |
| DE3772812D1 (en) * | 1986-04-11 | 1991-10-17 | Mitsubishi Electric Corp | SELF-ADJUSTING CONTROLLER. |
| JPS63106802A (en) | 1986-10-24 | 1988-05-11 | Toshiba Corp | Automatic rule forming type process adjustment aid system |
| DE3811086A1 (en) * | 1987-04-03 | 1988-10-20 | Hitachi Ltd | PID CONTROL SYSTEM |
| KR960016138B1 (en) * | 1988-06-17 | 1996-12-04 | 가부시기가이샤 히다찌세이꾸쇼 | Knowledge Information Generation System |
| JPH02211537A (en) | 1989-02-10 | 1990-08-22 | Sanyo Electric Co Ltd | Knowledge arrangement supporting device |
| US5179634A (en) * | 1989-04-14 | 1993-01-12 | Omron Corporation | System for synthesizing new fuzzy rule sets from existing fuzzy rule sets |
| US5394322A (en) * | 1990-07-16 | 1995-02-28 | The Foxboro Company | Self-tuning controller that extracts process model characteristics |
| JPH04200810A (en) | 1990-11-30 | 1992-07-21 | Hitachi Ltd | Noninteracting control method, method and device for controlling rolling mill |
| US5555409A (en) * | 1990-12-04 | 1996-09-10 | Applied Technical Sysytem, Inc. | Data management systems and methods including creation of composite views of data |
| US5325505A (en) * | 1991-09-04 | 1994-06-28 | Storage Technology Corporation | Intelligent storage manager for data storage apparatus having simulation capability |
| JPH05257695A (en) | 1992-03-16 | 1993-10-08 | Hitachi Ltd | Automatic rule generating system |
| US5471677A (en) * | 1992-06-24 | 1995-11-28 | Matsushita Electric Industrial Co., Ltd. | Data retrieval using user evaluation of data presented to construct interference rules and calculate range of inputs needed for desired output and to formulate retrieval queries |
| US5477444A (en) * | 1992-09-14 | 1995-12-19 | Bhat; Naveen V. | Control system using an adaptive neural network for target and path optimization for a multivariable, nonlinear process |
| EP0649254B1 (en) * | 1993-10-14 | 1999-03-17 | Koninklijke Philips Electronics N.V. | Method of storing coded image information |
| JPH07191706A (en) | 1993-12-27 | 1995-07-28 | Nkk Corp | Causal model identification method and control knowledge learning method |
| JPH07237256A (en) | 1994-02-28 | 1995-09-12 | Omron Corp | Method of extracting adjustment item for defect improvement, knowledge data generation method for condition adjustment using the method, adjustment item extraction device for defect improvement, and knowledge data generation system for condition adjustment using the device |
| JPH0877010A (en) * | 1994-09-07 | 1996-03-22 | Hitachi Ltd | Data analysis method and device |
| US5668928A (en) * | 1995-01-31 | 1997-09-16 | Kor Team International, Inc. | Speech recognition system and method with automatic syntax generation |
-
1998
- 1998-01-23 DE DE69800898T patent/DE69800898T2/en not_active Expired - Lifetime
- 1998-01-23 EP EP98101216A patent/EP0856787B1/en not_active Expired - Lifetime
- 1998-01-23 US US09/012,584 patent/US6438532B1/en not_active Expired - Lifetime
- 1998-01-25 CN CN981080170A patent/CN1218244C/en not_active Expired - Fee Related
Also Published As
| Publication number | Publication date |
|---|---|
| CN1199198A (en) | 1998-11-18 |
| US6438532B1 (en) | 2002-08-20 |
| EP0856787A1 (en) | 1998-08-05 |
| DE69800898T2 (en) | 2002-04-04 |
| CN1218244C (en) | 2005-09-07 |
| DE69800898D1 (en) | 2001-07-19 |
| US20020026432A1 (en) | 2002-02-28 |
Similar Documents
| Publication | Publication Date | Title |
|---|---|---|
| Tyler et al. | Performance monitoring of control systems using likelihood methods | |
| JP5734961B2 (en) | Apparatus and method for estimating model quality and adapting model in multivariable process control | |
| EP0856787A1 (en) | Adjustment rule generating method, adjustment rule generating apparatus, adjustment control method, and adjustment control apparatus | |
| Famili et al. | Data preprocessing and intelligent data analysis | |
| US5899985A (en) | Inference method and inference system | |
| EP2045675B1 (en) | Dynamic management of a process model repository for a process control system | |
| US8700550B1 (en) | Adaptive model training system and method | |
| EP0233071A1 (en) | Method and apparatus for automated rule based process control with feedback | |
| US5455872A (en) | System and method for enhanced character recogngition accuracy by adaptive probability weighting | |
| Kim et al. | Integration of inductive learning and neural networks for multi-objective FMS scheduling | |
| GB2235997A (en) | Learning-type decision support system | |
| WO1997042581A1 (en) | System and method for automatically determining a set of variables for use in creating a process model | |
| WO2019198143A1 (en) | Processing recipe generation device | |
| US6292738B1 (en) | Method for adaptive detection of engine misfire | |
| Van Aelst et al. | Fast and robust bootstrap for multivariate inference: The R package FRB | |
| US7136809B2 (en) | Method for performing an empirical test for the presence of bi-modal data | |
| Lipke | A study of the normality of earned value management indicators | |
| US7443395B2 (en) | Multi-variable operations | |
| EP3789904A1 (en) | Method and system for calibrating a simulation system for simulating micromechanical response characteristics of microstructures under investigation | |
| WO2021090518A1 (en) | Learning device, information integration system, learning method, and recording medium | |
| Grant | Selection pressures on vital rates in density–dependent populations | |
| US20220215144A1 (en) | Learning Apparatus, Learning Method and Learning Program | |
| JP2021033418A (en) | Machine learning method learning about work process and machine learning device | |
| CN113901648A (en) | Method and device for compiling part process rules | |
| JP3315361B2 (en) | Adjustment rule generation method, adjustment rule generation device, adjustment control method, and adjustment control device |
Legal Events
| Date | Code | Title | Description |
|---|---|---|---|
| PUAI | Public reference made under article 153(3) epc to a published international application that has entered the european phase |
Free format text: ORIGINAL CODE: 0009012 |
|
| 17P | Request for examination filed |
Effective date: 19980123 |
|
| AK | Designated contracting states |
Kind code of ref document: A1 Designated state(s): DE FR GB |
|
| AX | Request for extension of the european patent |
Free format text: AL;LT;LV;MK;RO;SI |
|
| AKX | Designation fees paid |
Free format text: DE FR GB |
|
| RBV | Designated contracting states (corrected) |
Designated state(s): DE FR GB |
|
| 17Q | First examination report despatched |
Effective date: 20000224 |
|
| GRAG | Despatch of communication of intention to grant |
Free format text: ORIGINAL CODE: EPIDOS AGRA |
|
| GRAG | Despatch of communication of intention to grant |
Free format text: ORIGINAL CODE: EPIDOS AGRA |
|
| GRAH | Despatch of communication of intention to grant a patent |
Free format text: ORIGINAL CODE: EPIDOS IGRA |
|
| GRAH | Despatch of communication of intention to grant a patent |
Free format text: ORIGINAL CODE: EPIDOS IGRA |
|
| GRAA | (expected) grant |
Free format text: ORIGINAL CODE: 0009210 |
|
| AK | Designated contracting states |
Kind code of ref document: B1 Designated state(s): DE FR GB |
|
| REF | Corresponds to: |
Ref document number: 69800898 Country of ref document: DE Date of ref document: 20010719 |
|
| ET | Fr: translation filed | ||
| REG | Reference to a national code |
Ref country code: GB Ref legal event code: IF02 |
|
| PLBE | No opposition filed within time limit |
Free format text: ORIGINAL CODE: 0009261 |
|
| STAA | Information on the status of an ep patent application or granted ep patent |
Free format text: STATUS: NO OPPOSITION FILED WITHIN TIME LIMIT |
|
| 26N | No opposition filed | ||
| PGFP | Annual fee paid to national office [announced via postgrant information from national office to epo] |
Ref country code: FR Payment date: 20100208 Year of fee payment: 13 |
|
| PGFP | Annual fee paid to national office [announced via postgrant information from national office to epo] |
Ref country code: GB Payment date: 20100120 Year of fee payment: 13 Ref country code: DE Payment date: 20100121 Year of fee payment: 13 |
|
| GBPC | Gb: european patent ceased through non-payment of renewal fee |
Effective date: 20110123 |
|
| REG | Reference to a national code |
Ref country code: FR Ref legal event code: ST Effective date: 20110930 |
|
| PG25 | Lapsed in a contracting state [announced via postgrant information from national office to epo] |
Ref country code: FR Free format text: LAPSE BECAUSE OF NON-PAYMENT OF DUE FEES Effective date: 20110131 |
|
| PG25 | Lapsed in a contracting state [announced via postgrant information from national office to epo] |
Ref country code: GB Free format text: LAPSE BECAUSE OF NON-PAYMENT OF DUE FEES Effective date: 20110123 |
|
| REG | Reference to a national code |
Ref country code: DE Ref legal event code: R119 Ref document number: 69800898 Country of ref document: DE Effective date: 20110802 |
|
| PG25 | Lapsed in a contracting state [announced via postgrant information from national office to epo] |
Ref country code: DE Free format text: LAPSE BECAUSE OF NON-PAYMENT OF DUE FEES Effective date: 20110802 |