EP0834069B1 - Method and apparatus for performing localized thermal analysis and sub-surface imaging by scanning thermal microscopy - Google Patents
Method and apparatus for performing localized thermal analysis and sub-surface imaging by scanning thermal microscopy Download PDFInfo
- Publication number
- EP0834069B1 EP0834069B1 EP97919593A EP97919593A EP0834069B1 EP 0834069 B1 EP0834069 B1 EP 0834069B1 EP 97919593 A EP97919593 A EP 97919593A EP 97919593 A EP97919593 A EP 97919593A EP 0834069 B1 EP0834069 B1 EP 0834069B1
- Authority
- EP
- European Patent Office
- Prior art keywords
- sample
- probe
- temperature
- recited
- thermal
- Prior art date
- Legal status (The legal status is an assumption and is not a legal conclusion. Google has not performed a legal analysis and makes no representation as to the accuracy of the status listed.)
- Expired - Lifetime
Links
- 238000000034 method Methods 0.000 title claims description 37
- 238000002076 thermal analysis method Methods 0.000 title claims description 15
- 238000003384 imaging method Methods 0.000 title claims description 11
- 238000000542 scanning thermal microscopy Methods 0.000 title claims description 4
- 239000000523 sample Substances 0.000 claims description 340
- 238000010438 heat treatment Methods 0.000 claims description 25
- 238000012544 monitoring process Methods 0.000 claims description 8
- 230000010355 oscillation Effects 0.000 claims description 4
- 230000003534 oscillatory effect Effects 0.000 claims description 4
- 238000012935 Averaging Methods 0.000 claims description 2
- 230000000704 physical effect Effects 0.000 claims 2
- 239000011343 solid material Substances 0.000 claims 1
- 239000000463 material Substances 0.000 description 28
- 230000007704 transition Effects 0.000 description 22
- 239000002245 particle Substances 0.000 description 21
- 238000002844 melting Methods 0.000 description 18
- 230000008018 melting Effects 0.000 description 18
- -1 polyethylene Polymers 0.000 description 16
- 239000005062 Polybutadiene Substances 0.000 description 14
- 239000004793 Polystyrene Substances 0.000 description 14
- 229920002857 polybutadiene Polymers 0.000 description 14
- RYGMFSIKBFXOCR-UHFFFAOYSA-N Copper Chemical compound [Cu] RYGMFSIKBFXOCR-UHFFFAOYSA-N 0.000 description 13
- 229910052802 copper Inorganic materials 0.000 description 13
- 239000010949 copper Substances 0.000 description 13
- 230000009477 glass transition Effects 0.000 description 13
- 229920002223 polystyrene Polymers 0.000 description 13
- 230000008859 change Effects 0.000 description 12
- 238000005259 measurement Methods 0.000 description 11
- 229920000642 polymer Polymers 0.000 description 10
- 230000001965 increasing effect Effects 0.000 description 9
- 239000000203 mixture Substances 0.000 description 9
- 230000006870 function Effects 0.000 description 8
- 241000532784 Thelia <leafhopper> Species 0.000 description 7
- 230000000694 effects Effects 0.000 description 7
- BASFCYQUMIYNBI-UHFFFAOYSA-N platinum Chemical compound [Pt] BASFCYQUMIYNBI-UHFFFAOYSA-N 0.000 description 7
- 238000001931 thermography Methods 0.000 description 7
- 239000004709 Chlorinated polyethylene Substances 0.000 description 6
- 229920003171 Poly (ethylene oxide) Polymers 0.000 description 6
- 238000004364 calculation method Methods 0.000 description 6
- 230000015556 catabolic process Effects 0.000 description 6
- 238000000576 coating method Methods 0.000 description 6
- 238000006731 degradation reaction Methods 0.000 description 6
- 238000010586 diagram Methods 0.000 description 6
- 239000011159 matrix material Substances 0.000 description 6
- 238000001953 recrystallisation Methods 0.000 description 6
- 238000004458 analytical method Methods 0.000 description 5
- 238000009933 burial Methods 0.000 description 5
- 238000007707 calorimetry Methods 0.000 description 5
- 238000002474 experimental method Methods 0.000 description 5
- 229920003229 poly(methyl methacrylate) Polymers 0.000 description 5
- 239000004926 polymethyl methacrylate Substances 0.000 description 5
- 229920002292 Nylon 6 Polymers 0.000 description 4
- 239000011248 coating agent Substances 0.000 description 4
- 239000004816 latex Substances 0.000 description 4
- 229920000126 latex Polymers 0.000 description 4
- 238000013507 mapping Methods 0.000 description 4
- 230000008569 process Effects 0.000 description 4
- 238000002411 thermogravimetry Methods 0.000 description 4
- BQCADISMDOOEFD-UHFFFAOYSA-N Silver Chemical compound [Ag] BQCADISMDOOEFD-UHFFFAOYSA-N 0.000 description 3
- 239000000853 adhesive Substances 0.000 description 3
- 230000001070 adhesive effect Effects 0.000 description 3
- 238000001723 curing Methods 0.000 description 3
- 238000000354 decomposition reaction Methods 0.000 description 3
- 238000001514 detection method Methods 0.000 description 3
- 230000003993 interaction Effects 0.000 description 3
- 230000007246 mechanism Effects 0.000 description 3
- 230000035515 penetration Effects 0.000 description 3
- 229910052697 platinum Inorganic materials 0.000 description 3
- 229920001483 poly(ethyl methacrylate) polymer Polymers 0.000 description 3
- 229920001610 polycaprolactone Polymers 0.000 description 3
- 239000004632 polycaprolactone Substances 0.000 description 3
- 239000007787 solid Substances 0.000 description 3
- 239000000126 substance Substances 0.000 description 3
- HEDRZPFGACZZDS-UHFFFAOYSA-N Chloroform Chemical compound ClC(Cl)Cl HEDRZPFGACZZDS-UHFFFAOYSA-N 0.000 description 2
- 239000002033 PVDF binder Substances 0.000 description 2
- 238000004630 atomic force microscopy Methods 0.000 description 2
- 229920001400 block copolymer Polymers 0.000 description 2
- 238000012512 characterization method Methods 0.000 description 2
- 238000007796 conventional method Methods 0.000 description 2
- 125000004122 cyclic group Chemical group 0.000 description 2
- YWJUZWOHLHBWQY-UHFFFAOYSA-N decanedioic acid;hexane-1,6-diamine Chemical compound NCCCCCCN.OC(=O)CCCCCCCCC(O)=O YWJUZWOHLHBWQY-UHFFFAOYSA-N 0.000 description 2
- 230000007423 decrease Effects 0.000 description 2
- 238000000113 differential scanning calorimetry Methods 0.000 description 2
- 238000009792 diffusion process Methods 0.000 description 2
- 230000004907 flux Effects 0.000 description 2
- 239000011521 glass Substances 0.000 description 2
- 230000010354 integration Effects 0.000 description 2
- 238000001459 lithography Methods 0.000 description 2
- 238000013178 mathematical model Methods 0.000 description 2
- 238000001565 modulated differential scanning calorimetry Methods 0.000 description 2
- 229920001778 nylon Polymers 0.000 description 2
- 239000003973 paint Substances 0.000 description 2
- 229920002959 polymer blend Polymers 0.000 description 2
- 229920002981 polyvinylidene fluoride Polymers 0.000 description 2
- 230000002441 reversible effect Effects 0.000 description 2
- MHOVAHRLVXNVSD-UHFFFAOYSA-N rhodium atom Chemical group [Rh] MHOVAHRLVXNVSD-UHFFFAOYSA-N 0.000 description 2
- 238000005070 sampling Methods 0.000 description 2
- 238000004621 scanning probe microscopy Methods 0.000 description 2
- 238000000926 separation method Methods 0.000 description 2
- XLYOFNOQVPJJNP-UHFFFAOYSA-N water Substances O XLYOFNOQVPJJNP-UHFFFAOYSA-N 0.000 description 2
- VEXZGXHMUGYJMC-UHFFFAOYSA-M Chloride anion Chemical compound [Cl-] VEXZGXHMUGYJMC-UHFFFAOYSA-M 0.000 description 1
- 239000004908 Emulsion polymer Substances 0.000 description 1
- 239000004593 Epoxy Substances 0.000 description 1
- 229920000571 Nylon 11 Polymers 0.000 description 1
- 239000004698 Polyethylene Substances 0.000 description 1
- 230000009471 action Effects 0.000 description 1
- 239000011324 bead Substances 0.000 description 1
- 230000008901 benefit Effects 0.000 description 1
- 230000001427 coherent effect Effects 0.000 description 1
- 230000003247 decreasing effect Effects 0.000 description 1
- 230000001419 dependent effect Effects 0.000 description 1
- 238000013461 design Methods 0.000 description 1
- 230000001066 destructive effect Effects 0.000 description 1
- 238000011161 development Methods 0.000 description 1
- 238000004455 differential thermal analysis Methods 0.000 description 1
- 238000001035 drying Methods 0.000 description 1
- 230000005284 excitation Effects 0.000 description 1
- 230000008713 feedback mechanism Effects 0.000 description 1
- 238000001914 filtration Methods 0.000 description 1
- 229920001903 high density polyethylene Polymers 0.000 description 1
- 239000004700 high-density polyethylene Substances 0.000 description 1
- 229920005621 immiscible polymer blend Polymers 0.000 description 1
- 230000006872 improvement Effects 0.000 description 1
- 230000001939 inductive effect Effects 0.000 description 1
- 230000002427 irreversible effect Effects 0.000 description 1
- 230000000670 limiting effect Effects 0.000 description 1
- 239000007788 liquid Substances 0.000 description 1
- 238000011068 loading method Methods 0.000 description 1
- 238000000386 microscopy Methods 0.000 description 1
- 238000012986 modification Methods 0.000 description 1
- 230000004048 modification Effects 0.000 description 1
- 230000003287 optical effect Effects 0.000 description 1
- 230000010363 phase shift Effects 0.000 description 1
- 229920006267 polyester film Polymers 0.000 description 1
- 229920000573 polyethylene Polymers 0.000 description 1
- 238000011084 recovery Methods 0.000 description 1
- 230000002829 reductive effect Effects 0.000 description 1
- 230000004044 response Effects 0.000 description 1
- 239000004065 semiconductor Substances 0.000 description 1
- 230000035945 sensitivity Effects 0.000 description 1
- 229910052709 silver Inorganic materials 0.000 description 1
- 239000004332 silver Substances 0.000 description 1
- 238000004088 simulation Methods 0.000 description 1
- 238000007711 solidification Methods 0.000 description 1
- 230000008023 solidification Effects 0.000 description 1
- 238000005507 spraying Methods 0.000 description 1
- 230000007480 spreading Effects 0.000 description 1
- 239000000758 substrate Substances 0.000 description 1
- 238000005979 thermal decomposition reaction Methods 0.000 description 1
- 238000012876 topography Methods 0.000 description 1
Images










Classifications
-
- G—PHYSICS
- G01—MEASURING; TESTING
- G01Q—SCANNING-PROBE TECHNIQUES OR APPARATUS; APPLICATIONS OF SCANNING-PROBE TECHNIQUES, e.g. SCANNING PROBE MICROSCOPY [SPM]
- G01Q60/00—Particular types of SPM [Scanning Probe Microscopy] or microscopes; Essential components thereof
- G01Q60/58—SThM [Scanning Thermal Microscopy] or apparatus therefor, e.g. SThM probes
-
- B—PERFORMING OPERATIONS; TRANSPORTING
- B82—NANOTECHNOLOGY
- B82Y—SPECIFIC USES OR APPLICATIONS OF NANOSTRUCTURES; MEASUREMENT OR ANALYSIS OF NANOSTRUCTURES; MANUFACTURE OR TREATMENT OF NANOSTRUCTURES
- B82Y35/00—Methods or apparatus for measurement or analysis of nanostructures
-
- G—PHYSICS
- G01—MEASURING; TESTING
- G01N—INVESTIGATING OR ANALYSING MATERIALS BY DETERMINING THEIR CHEMICAL OR PHYSICAL PROPERTIES
- G01N25/00—Investigating or analyzing materials by the use of thermal means
- G01N25/20—Investigating or analyzing materials by the use of thermal means by investigating the development of heat, i.e. calorimetry, e.g. by measuring specific heat, by measuring thermal conductivity
- G01N25/48—Investigating or analyzing materials by the use of thermal means by investigating the development of heat, i.e. calorimetry, e.g. by measuring specific heat, by measuring thermal conductivity on solution, sorption, or a chemical reaction not involving combustion or catalytic oxidation
- G01N25/4806—Details not adapted to a particular type of sample
- G01N25/4826—Details not adapted to a particular type of sample concerning the heating or cooling arrangements
- G01N25/4833—Details not adapted to a particular type of sample concerning the heating or cooling arrangements specially adapted for temperature scanning
-
- Y—GENERAL TAGGING OF NEW TECHNOLOGICAL DEVELOPMENTS; GENERAL TAGGING OF CROSS-SECTIONAL TECHNOLOGIES SPANNING OVER SEVERAL SECTIONS OF THE IPC; TECHNICAL SUBJECTS COVERED BY FORMER USPC CROSS-REFERENCE ART COLLECTIONS [XRACs] AND DIGESTS
- Y10—TECHNICAL SUBJECTS COVERED BY FORMER USPC
- Y10S—TECHNICAL SUBJECTS COVERED BY FORMER USPC CROSS-REFERENCE ART COLLECTIONS [XRACs] AND DIGESTS
- Y10S977/00—Nanotechnology
- Y10S977/70—Nanostructure
- Y10S977/724—Devices having flexible or movable element
- Y10S977/732—Nanocantilever
-
- Y—GENERAL TAGGING OF NEW TECHNOLOGICAL DEVELOPMENTS; GENERAL TAGGING OF CROSS-SECTIONAL TECHNOLOGIES SPANNING OVER SEVERAL SECTIONS OF THE IPC; TECHNICAL SUBJECTS COVERED BY FORMER USPC CROSS-REFERENCE ART COLLECTIONS [XRACs] AND DIGESTS
- Y10—TECHNICAL SUBJECTS COVERED BY FORMER USPC
- Y10S—TECHNICAL SUBJECTS COVERED BY FORMER USPC CROSS-REFERENCE ART COLLECTIONS [XRACs] AND DIGESTS
- Y10S977/00—Nanotechnology
- Y10S977/84—Manufacture, treatment, or detection of nanostructure
- Y10S977/849—Manufacture, treatment, or detection of nanostructure with scanning probe
-
- Y—GENERAL TAGGING OF NEW TECHNOLOGICAL DEVELOPMENTS; GENERAL TAGGING OF CROSS-SECTIONAL TECHNOLOGIES SPANNING OVER SEVERAL SECTIONS OF THE IPC; TECHNICAL SUBJECTS COVERED BY FORMER USPC CROSS-REFERENCE ART COLLECTIONS [XRACs] AND DIGESTS
- Y10—TECHNICAL SUBJECTS COVERED BY FORMER USPC
- Y10S—TECHNICAL SUBJECTS COVERED BY FORMER USPC CROSS-REFERENCE ART COLLECTIONS [XRACs] AND DIGESTS
- Y10S977/00—Nanotechnology
- Y10S977/84—Manufacture, treatment, or detection of nanostructure
- Y10S977/849—Manufacture, treatment, or detection of nanostructure with scanning probe
- Y10S977/852—Manufacture, treatment, or detection of nanostructure with scanning probe for detection of specific nanostructure sample or nanostructure-related property
-
- Y—GENERAL TAGGING OF NEW TECHNOLOGICAL DEVELOPMENTS; GENERAL TAGGING OF CROSS-SECTIONAL TECHNOLOGIES SPANNING OVER SEVERAL SECTIONS OF THE IPC; TECHNICAL SUBJECTS COVERED BY FORMER USPC CROSS-REFERENCE ART COLLECTIONS [XRACs] AND DIGESTS
- Y10—TECHNICAL SUBJECTS COVERED BY FORMER USPC
- Y10S—TECHNICAL SUBJECTS COVERED BY FORMER USPC CROSS-REFERENCE ART COLLECTIONS [XRACs] AND DIGESTS
- Y10S977/00—Nanotechnology
- Y10S977/84—Manufacture, treatment, or detection of nanostructure
- Y10S977/849—Manufacture, treatment, or detection of nanostructure with scanning probe
- Y10S977/86—Scanning probe structure
-
- Y—GENERAL TAGGING OF NEW TECHNOLOGICAL DEVELOPMENTS; GENERAL TAGGING OF CROSS-SECTIONAL TECHNOLOGIES SPANNING OVER SEVERAL SECTIONS OF THE IPC; TECHNICAL SUBJECTS COVERED BY FORMER USPC CROSS-REFERENCE ART COLLECTIONS [XRACs] AND DIGESTS
- Y10—TECHNICAL SUBJECTS COVERED BY FORMER USPC
- Y10S—TECHNICAL SUBJECTS COVERED BY FORMER USPC CROSS-REFERENCE ART COLLECTIONS [XRACs] AND DIGESTS
- Y10S977/00—Nanotechnology
- Y10S977/84—Manufacture, treatment, or detection of nanostructure
- Y10S977/849—Manufacture, treatment, or detection of nanostructure with scanning probe
- Y10S977/86—Scanning probe structure
- Y10S977/867—Scanning thermal probe
-
- Y—GENERAL TAGGING OF NEW TECHNOLOGICAL DEVELOPMENTS; GENERAL TAGGING OF CROSS-SECTIONAL TECHNOLOGIES SPANNING OVER SEVERAL SECTIONS OF THE IPC; TECHNICAL SUBJECTS COVERED BY FORMER USPC CROSS-REFERENCE ART COLLECTIONS [XRACs] AND DIGESTS
- Y10—TECHNICAL SUBJECTS COVERED BY FORMER USPC
- Y10S—TECHNICAL SUBJECTS COVERED BY FORMER USPC CROSS-REFERENCE ART COLLECTIONS [XRACs] AND DIGESTS
- Y10S977/00—Nanotechnology
- Y10S977/84—Manufacture, treatment, or detection of nanostructure
- Y10S977/849—Manufacture, treatment, or detection of nanostructure with scanning probe
- Y10S977/86—Scanning probe structure
- Y10S977/868—Scanning probe structure with optical means
- Y10S977/869—Optical microscope
-
- Y—GENERAL TAGGING OF NEW TECHNOLOGICAL DEVELOPMENTS; GENERAL TAGGING OF CROSS-SECTIONAL TECHNOLOGIES SPANNING OVER SEVERAL SECTIONS OF THE IPC; TECHNICAL SUBJECTS COVERED BY FORMER USPC CROSS-REFERENCE ART COLLECTIONS [XRACs] AND DIGESTS
- Y10—TECHNICAL SUBJECTS COVERED BY FORMER USPC
- Y10S—TECHNICAL SUBJECTS COVERED BY FORMER USPC CROSS-REFERENCE ART COLLECTIONS [XRACs] AND DIGESTS
- Y10S977/00—Nanotechnology
- Y10S977/84—Manufacture, treatment, or detection of nanostructure
- Y10S977/88—Manufacture, treatment, or detection of nanostructure with arrangement, process, or apparatus for testing
- Y10S977/881—Microscopy or spectroscopy, e.g. sem, tem
-
- Y—GENERAL TAGGING OF NEW TECHNOLOGICAL DEVELOPMENTS; GENERAL TAGGING OF CROSS-SECTIONAL TECHNOLOGIES SPANNING OVER SEVERAL SECTIONS OF THE IPC; TECHNICAL SUBJECTS COVERED BY FORMER USPC CROSS-REFERENCE ART COLLECTIONS [XRACs] AND DIGESTS
- Y10—TECHNICAL SUBJECTS COVERED BY FORMER USPC
- Y10S—TECHNICAL SUBJECTS COVERED BY FORMER USPC CROSS-REFERENCE ART COLLECTIONS [XRACs] AND DIGESTS
- Y10S977/00—Nanotechnology
- Y10S977/902—Specified use of nanostructure
- Y10S977/932—Specified use of nanostructure for electronic or optoelectronic application
- Y10S977/953—Detector using nanostructure
- Y10S977/957—Of chemical property or presence
Definitions
- the present invention relates to determining thermal properties of materials using a miniaturized resistive thermal probe. More particularly, the present invention relates to performing localized thermal analysis experiments whereby calorimetric information is obtained from a volume of materials on the order of a few cubic microns, whereas in conventional bulk calorimetry data is obtained from volumes of material on the order of a few cubic millimeters.
- the present invention also relates to modulating the temperature of a thermal probe to generate evanescent thermal waves in a material to thereby generate sub-surface images.
- thermal excitation Any local disruption of the structure that results in a change in density, specific heat, or thermal conductivity may be detected by some type of thermal probe - often with higher sensitivity than by the use of optical, X-ray, or electron-microscope techniques. Many of these techniques use an intensity-modulated energy source to excite a sample. That is, the intensity of the energy source used to excite the sample is made to vary with time. Induced scattered evanescent thermal waves are then detected by, for example, monitoring the surface temperature of the sample. When a scanning mechanism is also incorporated, it is then possible to achieve spatial thermal mapping. Subsurface imaging can be performed within the depth of penetration of the thermal wave.
- This principle is applied in Scanning Probe Microscopy whereby a sharp probe is brought in close proximity to the surface of a sample. Some probe/sample interaction takes place. This interaction is monitored as the probe is scanned over the surface. An image contrast is then computer-generated. The image contrast represents variations of some property (e.g ., physical, mechanical, chemical) of the sample across the scanned area.
- One such scanning probe microscope is the Atomic Force Microscope (AFM).
- AFM Atomic Force Microscope
- the height of a probe above the surface being scanned is controlled by a feedback system, that keeps the force between the probe and the surface of the sample constant. The probe height is monitored, and provides the data that is used to create image contrast which represents the topography of the scanned area.
- the probe is a specially made coaxial tip that forms a fine thermocouple junction. This probe provides a spatial resolution on the order of tens of millimeters.
- the sample is either heated using a laser or the probe, or the sample is heated electrically.
- the feedback system maintains the probe temperature constant (instead of maintaining the force constant), by varying the probe height as necessary.
- DSC heat flux differential scanning calorimeter
- the present invention provides a method of performing localized thermal analysis according to claim 1 and an apparatus for performing localized thermal analysis according to claim 19.
- the present invention is a new analytical technique which makes calorimetric measurements on a localized scale. Data obtained from the measurement can be used to generate contrast in our image of the thermal properties of the sample on a localized scale.
- images of the sample at a depth below the surface can be made. The depth corresponds to the frequency of the applied oscillatory temperature.
- the present invention applies modulated temperature differential scanning calorimetry, as described in U.S. Patent No. 5,224,755 to Reading, et al.
- Localized calorimetry is then performed at that position by inducing and detecting localized phase transitions. This is achieved by ramping the temperature of the probe by passing an electrical current through the probe. A small temperature oscillation is superimposed to that temperature ramp by adding a modulated component to current the probe current. By scanning over the surface of the sample, contrast can be developed corresponding to particular locations on the sample to create an image of the thermal properties of the sample at particular locations.
- a second embodiment of the present invention allows for sub-surface imaging thermal microscopy to be performed by modulating the temperature of the probe. This is done by passing a modulated current through it, thus generating thermal waves within the sample. The depth of penetration of these waves is frequency dependent, such that the thermal properties of a sample can be probed as a function of depth below the surface.
- the probe developed by the Topometrix Corporation, is an elongated loop of Wollaston wire, shaped in the form of a cantellver whose end forms the resistive element.
- the resistance of that element varies with temperature. Conversely, its temperature can be set by passing a current of appropriate value through it.
- a mirror is attached across the loop allowing for the contact force of the element on the sample to be held constant, as in conventional atomic force microscopy, while the probe is scanned across the surface of the sample.
- the probe is used as a highly localized heat source by passing a current through it.
- heat will flow from the probe to the sample.
- the amount of heat flowing will vary according to various properties of the sample at the location under the probe. This varying heat flow causes the temperature of the resistive element to change, thereby changing its resistance.
- a feedback circuit is preferably used to sense the change in the probe resistance (and therefore its temperature) and increase the amount of current flowing through the probe to bring it back to Its original resistance value (and therefore to its set temperature).
- a differential signal Is then monitored, either directly or through a lock-in amplifier.
- the differential signal is used to either (1) produce localized analysis plots of amplitude and phase data versus temperature that provide calorimetric information at a specific position on the sample, or (2) construct an image whose contrasts represent variations in thermal conductivity and/or diffusivity across a scanned area.
- a time-varying current through the resistive elements generates thermal waves in the sample.
- the modulation frequency of the time-varying current is functionally related to the depth below the surface of the sample at which an image of the sample is desired. A sub-surface image is thus generated.
- the depth of material below the sample surface that is contributing to the image can be controlled by suitably choosing the temperature modulation frequency.
- the penetration depth is proportional to the square root of the thermal diffusivity of the sample divided by the frequency of the applied temperature wave.
- a first object of the present invention is to provide localized differential thermal analysis at the micron level, such that events such as glass transitions and meltings can be induced in a highly spatially localized manner and identified.
- a second object of the present invention is to use scanning thermal microscopy to obtain sub-surface images of solids, in which the image contrast is due to variations in thermal diffusivity within a given controllable depth.
- Another object of the present invention is to use a highly miniaturized resistive thermal probe as a highly localized source of heat, such that it can be used to produce highly localized phase transitions at the surface of samples.
- Another object of the invention is to use modulated differential scanning calorimetric signals to produce a high-frequency temperature modulation in a probe used for sensing the thermal properties of materials at different depths below the surface.
- Another object of the present inventions to provide an apparatus which can, for a sample containing different regions subject to either reversible or irreversible changes with temperature, produce thermal images showing contrast based upon the reversing and nonreversing nature of the heat flow, respectively.
- the scanning probe system used in the preferred embodiment of the present invention is the Explorer scanning probe microscope manufactured by the Topometrix Corporation, located in Santa Clara, California.
- the system is operated as a constant force microscope.
- the Topometrix instrument uses a laser, together with a four-quadrant photodiode as the detection system for cantilever deflection.
- the scanner, probe and detection system form a self-contained system mounted independently of the sample. The sample is therefore free to be mounted on an appropriate stage (a heating stage for example).
- FIG. 1 illustrates schematically a resistive thermal probe 100 for use in a preferred embodiment of the present invention.
- the probe 100 comprises a cantilever 102 mounted to a cantilever mount 104.
- the arms of the cantilever are made of Wollaston process wire having silver wire that is preferably 75 ⁇ m in diameter.
- the silver wire preferably contains a platinum/10% rhodium core.
- the platinum/rhodium core is preferably 5 ⁇ m in diameter.
- the arms of the cantilever form a loop 106 at one end of the probe 100. Where the loop 106 is formed, the silver is etched away, thereby exposing the platinum/10% rhodium core.
- the length of the exposed core is preferably 150-200 ⁇ m in length.
- the loop 106 is the resistive heating source of the probe 100.
- the cantilever 102 of the probe 100 is bent to a suitable shape, i.e., has as sharp a bend as possible.
- the sharp bend yields a very small area of contact with the sample.
- the small area of contact with the sample allows for precise heating of a particular location on the sample.
- Such a probe 100 is commercially available from the Topometrix Corporation.
- the probe 100 is attached to a scanning probe microscope via the cantilever mount 104.
- Part of the structure acts as a cantilever 102 onto which a mirror 108 is cemented for the purpose of laser beam deflection in order to achieve force control.
- the mirror 108 reflects a laser beam to a four-quadrant photodiode (not shown).
- the laser/mirror/photodiode system is used to sense the cantilever deflection, and thus to provide feedback to enable the probe 100 to be scanned at constant force.
- the probe 100 is held magnetically in place on the scanner in a well-known manner.
- An epoxy bead (not shown) is added near the end of the cantilever to reduce the risk of breaking the filament.
- Such a scanning probe system is the Explorer scanning probe microscope produced by Topometrix Corporation.
- the resistive thermal probe 100 can be used as a highly localized heat source as well as a detector. When heated by the passage of an electric current through the resistive portion 106 of the probe 100, its contact with the sample acts as a point-like heat source. Therefore, no other means of sample heating, such as a laser, is required.
- the probe 100 is attached to a scanning mechanism, and is controlled to obtain thermal image contrast that corresponds to variations in either thermal conductivity (using DC imaging) or thermal diffusivity (using AC imaging).
- a conventional method for operating the probe is in the constant temperature, self-heating mode.
- the thermal element is used as a resistive heater, as well as functioning as a temperature sensor.
- the probe 100 forms one of the legs of a Wheatstone bridge 204.
- the remaining legs of the wheatstone bridge 204 are formed by resistors R 1 and R 2 , and a resistor R c .
- Resistors R 1 and R 2 are chosen to have constant values.
- the resistor R c is chosen to provide the set point for the bridge voltage as described below.
- the resistor R L accounts for the resistance of the probe's 100's probe leads.
- the Wheatstone bridge circuit 204 uses a feedback loop 205 to adjust a bridge voltage V b as necessary to keep the bridge 204 balanced. By maintaining the balance of the bridge 204, the temperature of the probe is kept constant.
- the feedback loop 205 generally comprises a difference amplifier 206 and a feedback circuit 212.
- the difference amplifier 206 has a first input 207, coupled to a junction 208 and a second input 209 coupled to a junction 210.
- the second input 209 is the inverted input of the difference amplifier 206.
- the difference amplifier determines the voltage difference across the junctions 208 and 210.
- the voltage difference is input to the feedback circuit 212 to adjust the bridge voltage V b as required.
- the amount of adjustment required to maintain the bridge balance is used to develop contrast in an image. For example, the spot intensity on a cathode ray tube (CRT) screen can be made to be proportional to the bridge adjustment voltage.
- CRT cathode ray tube
- the feedback loop 205 senses this shift through difference amplifier 206 and increases the voltage, V b , applied to the bridge. This in turn increases the resistive heating of the probe 100, returning its resistance to the set point.
- the set point is the probe resistance that corresponds to a constant desired operating temperature, and is set by appropriately choosing the value of R c .
- the probe 100 is scanned at constant force. Variations in the heat flow out of the probe 100 are measured by monitoring the bridge voltage V b required to maintain the probe's 100's resistance such that it produces the content desired operating temperature.
- the bridge voltage signal V b is then used to create contrast in the thermal image.
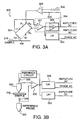
- FIG. 3A a schematic diagram illustrating a first preferred embodiment of the present invention is presented.
- the first embodiment both maintains a constant underlying temperature when scanning the surface of a sample and generates thermal waves into the sample. It does so by incorporating control circuitry 300 that adds an oscillating voltage signal 302 to an underlying DC voltage signal 303 to cause the temperature of the region of the sample 216 in contact with the probe to oscillate about a fixed temperature.
- the fixed temperature is set by the value of resistor R c and maintained by operation of the feedback circuit 306.
- a summing circuit 305 is used to sum the oscillating voltage signal 302 with the voltage set by the feedback circuit 306.
- the voltage set by the feedback circuit 306 is the voltage that is required to maintain the probe at a constant temperature (set by R c ).
- the addition of the oscillating voltage signal 302 generates a thermal wave in the sample 216.
- the bridge 204 imbalance caused by the heat flow out of the probe 100 to the sample is monitored using a lock-in amplifier (LIA) 304.
- LIAs such as LIA 304, are well-known devices that are used for coherent detection and recovery of modulated signals having a low signal-to-noise (SNR) ratio, i.e ., that are buried in noise.
- SNR signal-to-noise
- the LIA 304 determines the amplitude and phase of the heat flow due to the oscillating voltage signal 302. This information is subsequently used to generate contrast in an image as described further below.
- the LIA computes the amplitude and phase (relative to a reference) of the modulated signal of interest.
- the reference is the oscillating voltage 302.
- the LIA 304 of the present invention preferably has a frequency range from approximately 1 millihertz (mHz) to approximately 1 megahertz (MHz).
- the feedback circuit 306 preferably includes a differential stage 307 and an integration stage 308.
- the differential stage 305 determines the error between the set point value and the value actually measured.
- the error is input to the integrator in stage 308.
- the integrator 308 attempts to force the error to zero.
- Variations in the AC signal due to the heat flow from the probe 100 to the sample 216 are used to generate contrast in an image which represents variations in thermal diffusivity at a given temperature (set by R c ) within the thermal wave diffusion length. This is accomplished by monitoring the amplitude and the phase of the ac signal, using the LIA 304.
- contrast is developed in an image of the sample.
- the image represents a depth of the sample determined by the frequency of the applied oscillating voltage 302.
- the value of the contrast is proportional to the value of the generated dc amplitude, ac amplitude, or ac phase signal used to generate the contrast.
- a second preferred embodiment of the present invention is illustrated schematically in Figures 3B and 3C .
- the second preferred embodiment incorporates two probes, a sample probe 320 and a reference probe 322, to perform localized thermal analysis at the surface of the sample 316.
- localized MDSC experiments such as those described in the '775 patent, can be performed at a location on the surface of the sample, rather than for the sample bulk as in conventional systems.
- both the sample probe 320 and the reference probe 322 are similar to the probe 100 described above.
- a particular location on the sample at which to perform a localized thermal analysis is selected by first obtaining a thermal image of the sample.
- the thermal image can be obtained by a technique according to the first embodiment of the present invention or any other technique.
- the particular location is selected.
- One method for selecting the particular location is to use a pointing and selection device, such as a computer mouse, to select the particular location by pointing to and clicking on a particular location in a representation of the thermal image that is displayed on a computer monitor.
- the sample probe 322 is then positioned at the particular location by the scanning probe microscope system. When the sample probe 322 is properly positioned at the particular location, a thermal analysis is performed by supplying the sample probe 322 with a current to produce a heating function according to a temperature program as described below.
- Equal currents (I) 326 are passed into the reference probe 320 and into the sample probe 322.
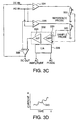
- An example of the currents 326 is illustrated graphically in Figure 3D as current 340.
- the current 340 has a constant underlying heating rate on which a modulating signal is superimposed.
- the modulating signal is sinusoidal in character.
- the modulating signal can assume a variety of functions.
- the current 340 can be generated in accordance with any desired temperature program.
- temperature programs used in conventional bulk analyses can be used.
- the current 340 can be created by choosing a repeating unit, and a number of repetitions for the repeating unit.
- Various parameters relating to the temperature program can be determined from the temperature program subsequent to its generation.
- the underlying heating rate can be determined by averaging over a single period of the temperature program.
- the frequency can be determined as the reciprocal of the period.
- the temperature as measured by the sample probe 320 can be used to calculate the underlying heating rate, and modulation amplitude and frequency as required. These parameters can be determined, or selected, by a computer or a user.
- each current 326 is the sum of an alternating current (ac) component and a direct current (dc) component.
- the ac component produces ac heating in the probes 320 and 322.
- the currents in the probes 320 and 322 are increased accordingly. Using the present invention therefore, a localized portion of the sample is exposed to a temperature that varies in an analogous manner to the current 340 illustrated in Figure 3D .
- the difference between the voltages across the probes is fed into a lock-in-amplifier 328.
- a differential amplifier 330 can be used to determine the difference.
- Three signals are derived using this configuration. First, a DC signal is obtained after low pass filtering through a low pass filter (LPF) 329. The DC signal contains information that is related to the underlying temperature of the equal currents 326. The two remaining signals are output by the LIA 328.
- the LIA 328 outputs one signal that is representative of the AC amplitude of the differential AC signal.
- the LIA 328 also outputs a signal that is representative of the phase of the AC differential signal.
- These signals can be plotted, displayed in real time, e.g ., on a CRT display, such as a computer monitor, or an oscilloscope, and/or stored to a computer disk or any other storage device.
- the temperature at which the sample undergoes a phase transition at the particular location analyzed can be determined.
- the phase transition is indicated by a sharp transition or peak in one or more of the three signals.
- the resulting amplitude and phase data can be displayed or plotted in a variety of ways. For example, plots of amplitude versus temperature and phase versus temperature can be made at specific location on the surface of the sample. In an alternative embodiment, layered plots of amplitude versus temperature and phase versus temperature can be made for locations taken at even intervals across the surface of the sample as the surface is scanned by the sample probe 320.
- Figure 3C is a more detailed schematic diagram of the circuitry used to perform localized MDSC.
- Figure 3C shows an integral control feedback circuit 332. It includes an integrator 333 and a differential amplifier 330, which are used to maintain the DC temperature of the sample probe 320 at the value set by the reference probe 322.
- the feedback circuit 332 forces the difference between the voltage across the sample probe 320 to be equal to the voltage across the reference probe 322 by forcing the error between the voltages measured by the sample probe 320 and the reference probe 322 to zero.
- an alternating current (ac IN) is injected into the two probes to produce AC heating using the summing circuits 334 and 336.
- the bandwidth of the feedback circuit 332 can be set higher to or lower than the frequency of the ac modulation. If set higher, the feedback circuit 332 responds to both the ac and dc components of the error signal. If set lower, the feedback circuit 332 only responds to the dc component of the error signal. This flexibility provides and additional parameter for conducting an experiment. Where the frequency is set depends on the given experiment. Considerations as to whether to use a higher or lower frequency include the sample material being studied and the localized phase transition through which the sample material is driven.
- the bandwidth of the feedback circuit 332 is set to 1 kHz.
- the current used is preferably such that a temperature oscillation of about one degree amplitude is obtained.
- the differential voltage across the two probes is monitored by the differential amplifier 332.
- Three signals are recorded: the amplitude of the differential underlying signal (DC OUT), as measured by a summing circuit 338, and the phase (PHASE) and amplitude (AMP) of the dynamic signal, as measured by the lock-in amplifier 328.
- the DC OUT signal is fed back to the dc in input of the summing circuit 334.
- These three signals can be digitized and read into a computer, or displayed in real time, e.g ., on a CRT display, such as a computer monitor, or an oscilloscope. As described above, various plots or displays of the data can be made using these signals.
- the temperature ramp generally produces variations in the thermal conductivity and heat capacity of the sample, which may also undergo local phase changes.
- the apparatus of Figure 3C uses local heating rather than a heating stage, so that these temperature-induced variations will themselves be subject to spatial variation according to where the sample probe is positioned. In turn, the heat flow out of the probe, and therefore the resistance and the voltage across the probe, vary according to where the sample probe is positioned. This is reflected in the variations of the amplitude and phase of the differential signals, as well as in the DC signal.
- the probed volume of material in the present invention is of the order of a few ⁇ m 3 .
- the probed volume is the smallest volume that can be used to generate a useful localized MDSC scan.
- probes can be used as heat sources as well as detectors, using a single probe would give a baseline which would tend to hide any variations in the signal indicative of phase changes between the applied temperature and the resulting measurement.
- An important feature of the differential arrangement is that by means of the feedback mechanism, the sample probe is maintained at the same temperature as the reference probe.
- a one-dimensional mathematical model which describes the probe-sample interaction has been developed in the simple case of constant temperature (DC) thermal imaging.
- DC imaging can be considered as the extreme case of AC imaging when the frequency is zero.
- This mathematical model illustrates the sub-surface imaging capability of the present invention.
- the flow of heat in the sample can be related to the heat dissipated in the resistive element and therefore to the voltage applied to the bridge as follows:
- the feedback circuit increases the energy dissipated in the probe and readjusts its temperature (and resistance) to the set value, as determined by R c .
- the electrical energy dissipated in the probe now also includes heat flowing into the sample. This outflow of heat can thus be measured and is given by:
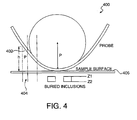
- FIG 4 is a schematic diagram depicting the probe 400 in contact with the surface of a sample 406.
- the probe is modeled as a series of elemental contiguous heat sources 402, each having the same projected area of cross-section A.
- elemental heat source 402 is over volume element 404.
- the elemental heat sources are all at the same temperature, but are located at different heights above the surface of the sample 406.
- the heat flow is assumed to be unidirectional along the z-direction into the sample. As illustrated in Figure 5 , this assumption is a major simplication to the heat flow.
- FIG. 5 depicts an expanded view of volume element 404.
- the effect of the lateral component of the heat flow 502 is accounted for by considering the walls of the element as not being thermally insulating.
- the loss at the walls is then modeled by including a loss coefficient ⁇ which represents heat loss through the walls of the element 504.
- T i z P i ⁇ e ⁇ r ⁇ z + Q i ⁇ e - ⁇ r ⁇ z
- ⁇ i ⁇ p k i ⁇ A and where P and Q are constants.
- T i is the temperature above ambient
- z z o k 1 ⁇ d T 1 z d z
- z z 1 k 2 ⁇ d T 2 z d z
- z z 1 k 2 ⁇ d T 2 z d z
- the value of the loss coefficient ⁇ can be determined as follows. Heat flow from the probe into the sample was determined experimentally for various probe positions over homogeneous regions and over regions with buried inclusions of different sizes, e.g., 0.4 ⁇ m, 1.0 ⁇ m and 4.0 ⁇ m. The values of ⁇ for each probe position are then calculated using these experimentally measured values of heat flow, the theoretical expression for the heat flow into the sample given above in equation (1), the assumed nominal values of burial depth and thickness of the inclusions, (whose thicknesses are assumed to be about one-third of the observed lateral size of the inclusions), and the values of the thermal conductivity for copper and for polystyrene shown in Table II below. The calculated values of ⁇ determined at each probe position are then averaged to determine ⁇ for use in subsequent calculations.
- the total heat flow is calculated by summing the elemental heat flows along the profile of the probe, out to where the air gap was 100 ⁇ m wide.
- the temperature of the probe was assumed to be constant along its length.
- Figures 6 , 7 and 8 show the results of calculations of temperature profiles directly below the apex of the probe, which is assumed to be just touching the surface.
- the probe is assumed to have a radius of curvature of 20 ⁇ m and a height of 100 ⁇ m.
- the temperature of the probe is assumed to be uniform and constant along the wire length. Heat flows are total heat flows from the probe and obtained by integrating along the shape of the probe.
- the probe temperature, or To was assumed to be 20 °C above ambient.
- Figure 6 shows the temperature profiles 602, 604, 606, 608, 610 and 612 inside the sample for a 10 ⁇ m thick copper layer buried at depths varying from 0.1 to 10 ⁇ m. Because of the much higher thermal conductivity of the copper, the temperature gradient across the copper layer is much smaller than the temperature gradient in the polystyrene. The temperature gradient refers to the rate of variation of temperature with depth.
- the lower curve 614 (right hand vertical scale) in Figure 6 is a plot of the heat flow from the probe for the 10 ⁇ m thick copper layer versus the depth of burial of the layer. The heat flow decreases as the layer is buried further away from the surface, and tends to the value of heat flow for a homogeneous polystyrene sample.
- Figure 7 is a series of plots 702, 704 and 706 simulating the heat flow from the probe as the probe is scanned over two copper particles 1 micron in length and 1 micron thick, for increasing separation and increasing depth of burial.
- Q f a ⁇ Q fmin + Q fmax - Q fmin ⁇ RES 100 where Q fmin is the minimum heat flow at a given burial depth, Q fmax is the maximum heat flow at a given burial depth, Q f (a) the heat flow at the trough, and RES is a coefficient of resolution.
- the graphs 802 and 804 show that the theoretical lateral resolution is on the order of a micron at the surface, but degrades when the particles are buried further deeply into the bulk.
- the insets 806 and 808 illustrate alternative curves predicted by an overlapping peaks criterion (20% minimum dip in the heat flow signal between two inclusions, neglecting the effect of noise).
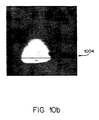
- Figures 9 and 10 are a comparison of the simulated heat flows 902, 1002 and 1004 as the probe is scanned across two particles for tip radii of 10 ⁇ m, 5 ⁇ m, and 1 ⁇ m for curves 904, 906 and 908 ( Figure 9 ) to experimental data ( Figure 10 ).
- the curves 904, 906 and 908 illustrate the improvement of lateral resolution as the radius of the curvature of the probe's tip becomes smaller.
- the bridge feedback voltage excursion ranged from an average of 886 mV to an average of 897 mV.
- This line scan was obtained for the 1 ⁇ m thick coating.
- the feedback voltage when the probe was away from the surface of the sample was 784 mV.
- the minimum heat flow, into a homogeneous polystyrene region, was calculated to be equal to 165 ⁇ W and the maximum heat flow (into a region where a copper particle is buried) was 184 ⁇ W.
- the following examples illustrate applications of the thermal probe to obtain a map of surface calorimetric data, with a lateral resolution on the order of a micron, and a probed volume of material on the order of a few ⁇ m 3 . They include:
- film-forming emulsion polymers are widely used in paper coatings, latex paints, water-based adhesives and other applications.
- the properties of the film itself depend upon the way in which the individual latex particles are able to integrate.
- the mechanisms of film integration from latex particles, and the interface development between two compatible polymers are currently the subjects of significant study by polymer scientists.
- the properties of the particle-particle interface affect the performance of the resulting coating, in the case of films used in paper coating, latex paints and water-based adhesives.
- FIG. 11A , 11B , 11C and 11D were obtained with the scanning probe microscope of the present invention operated in the constant temperature mode and the probe temperature set at 40°C.
- the thermal contrast images were computer-generated, using the feedback voltage V b applied to the Wheatstone bridge circuit 204. Because of the relatively slow scan speed (usually 100 ⁇ m s -1 ), steady state (thermal equilibrium between the probe and the region of the sample whose temperature is affected by the probe) was reached at each point, so that the image contrast was indeed determined by the value of the heat flow.
- a certain volume of material was heated. This volume can be approximately delimited by the thermal contact area and an effective depth determined by the temperature gradient below that contact area. The heat flow from the probe into the sample characterizes the thermal conductivities of the material within the heated volume.
- Samples were prepared in a well-known manner by spraying polystyrene substrates with fine copper particles (nominally less than 1 micron diameter). The samples were then hot-pressed between glass slides at a temperature just below the melting temperature of polystyrene, and then were coated with a formvar film cast from a solution in chloroform, or coated with layers of polystyrene films 17 ⁇ m thick (in this case they are hot-pressed a second time).
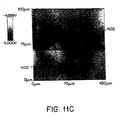
- Figures 11A , 11B and 11C are thermal images obtained when scanning samples with a coating thicknesses of 400 nm, 1 ⁇ m and 4 ⁇ m, respectively. They show areas of high thermal conductivity 1102, randomly shaped, and of sizes varying from a few microns to a few tens of microns. These figures show aggregates of the original particles, which have not fully dispersed below the surface of the samples. The particles are clearly detected and show brighter in the thermal contrast, indicating that they draw more heat from the probe, through the formvar film, because of the higher thermal conductivity of the copper. Thus at each point, the sampling volume heated extends deeply enough to include the buried particles. However, as indicated by the scale bars, the feedback voltage excursion diminishes as the thickness increases.
- This example demonstrates the use of the present invention for the study of immiscible polymer blends systems, including a Poly(vynil chloride) [PVC] / Polybutadiene [PB] blend, a Poly(ethylene oxide) [PEO] / Polybutadiene [PB] blend and a Poly(methyl methacrylate) [PMMA]/Chlorinated polyethylene [CPE] blend.
- PVC Poly(vynil chloride)
- PB Polybutadiene
- PEO Poly(ethylene oxide)
- PMMA Poly(methyl methacrylate)/CPE] blend
- the two polymers involved segregate, being immiscible: one forms a matrix and the other forms Island-like domains.
- the two phases In each sample were identified by mapping the thermal conductivity variation across the surface of the sample using the thermal probe, operated in the closed loop mode not embodied by the present invention, at a constant temperature of 40°C.
- the signal was obtained from the feedback voltage applied to the controlling bridge in order to maintain a constant probe temperature.
- the contrast at each point represents variations in thermal conductivity across the sample.
- Figure 12 is a thermal image 1202 of a PVC/PB blend obtained at a zero modulation frequency and not embodied by the present invention.
- the image contrast Is a representation of thermal conductivity variations across the sample within a depth of a few microns.
- the two phases are clearly apparent: PB, having a higher thermal conductivity (0.24 J/sec.m.K) than PVC (0.14 J/sec.m.K), is identified by the brighter island-like domains 1204 of higher thermal conductivity.
- PB segregates into domains 1204 of diameter up to about 50 ⁇ m in a matrix of PVC.
- Figures 13A and 13B are images 1302 and 1304 of a PMMA/CPE system not embodied by the present invention, respectively using unmodulated and modulated thermal probes.
- the probe was operated in the closed loop mode at a temperature of 40°C.
- a 10 kHz fluctuating temperature of about 5°C was superimposed on the 40°C operating temperature.
- the contrast corresponds to variations in thermal conductivity.
- PMMA which has a higher thermal conductivity than CPE (0.193 against 0.144 J.S -1 m -1 ,K -1 ), segregates again into island-like domains 1306 in a matrix of CPE.
- contrast arises from the phase shift of the AC voltage across the probe as it is scanned.
- the contrast in Figure 13B represents variations of thermal properties, which include diffusivity, across the sample within a depth (below the surface) equal to the thermal diffusion length, as determined by the modulation frequency.
- This example illustrates the use of the present invention to follow, in real time, the behavior of PVC domains in a PVC/PB blend as a function of temperature, using a temperature-controlled hot stage.
- the same area was scanned at increasing hot stage temperature, which was maintained constant during each scan.
- the probe was operated in the closed loop mode, at a constant temperature of 85°C. Images obtained at room temperature (RT), 50°C, 70 °C, 78°C, 95 °C and 100°C are shown in Figure 14A (1402, 1404, 1406, 1408, 1410 and 1412).
- Figure 14B also shows images (1420, 1422, 1424, 1426, 1428 and 1430) of PVC domains in a PB matrix as a function of increasing temperature. As the temperature is increased up to about 70°C, little change to the system is observed, although small domains can be seen to move and are absorbed into neighboring larger ones. As the temperature is further increased large domains move outside the field of view. One domain 1414 is clearly seen to have broken up into smaller ones 1416. The reversal in contrast in the higher temperature images is due to the temperature of the stage becoming higher than the average temperature along the probe (set at 85°C).
- PB is in the rubbery state (the glass transition takes place at -65°C) and up to about 70°C, PVC is in the glassy state.
- the probe induces a local phase transition in PVC and further softening of the PB This facilitates the movement of small domains.
- PVC becomes rubbery and this probably accounts for the break up of the PVC domain under the action of the scanning probe.
- PB is in an almost liquid state, and the large PVC domains are easily moved by the probe to beyond the field of view.
- This example shows the use of the present invention to perform spatially localized thermal analysis. Instead of using a heating stage, precisely-defined regions of the sample were heated through the temperature range of interest. The heat was supplied by the probe itself. The probe was placed at a fixed location on the surface of a sample (see Figure 3B ), and both sample probe and reference probe were subjected to a temperature ramp with an added temperature oscillation of about one degree amplitude.
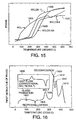
- Figure 15 shows the phase signal recorded for three types of nylons (11 (1502), 6 (1504), and 6/6 (1506)) and polycaprolactone (PCL) 1508. Melting points are identified by a sharp change in the slope of the signal. Table I shows that these changes correspond to the melting points of the materials. The changes observed at higher temperatures are probably associated with decomposition. For example, there is a good correlation with the thermal decomposition temperature range obtained from TGA shown in Table I.
- Figure 16 is a plot of the first derivative of the phase versus temperature obtained for quenched poly(ethylene terephtalate) (PET), covering a region of temperature over which degradation occurs. Below 300°C three events are clearly identified. These are interpreted as the glass transition 1602, recrystallization 1604 and melting 1606, respectively, as shown in Figure 16 .
- the inset 1608 in Figure 16 is a typical plot of bulk heat flow versus temperature obtained using conventional DSC on a bulk sample from the same material. The inset shows that the same events are recorded using conventional bulk DSC.
- the melting transition occurs over the same range of temperature in the signal obtained using a localized scan as in the bulk signal, the glass transition and recrystallization occur at higher temperatures in the localized signal as compared with the bulk signal. This may be due to surface effects, and to the small volume of material involved.
- decomposition 1610 is observed. This is consistent with bulk TGA data. Furthermore the three peaks 1612 observed during degradation may be associated with the breaking of specific chemical bonds. Degradation refers to a stage along the process which can eventually result in complete decomposition.
- This example shows that the phase signal can be used to identify transitions.
- Some of the results obtained are presented here in the form of plots of the first derivative of the phase vs. temperature. For each material, two or three plots were obtained at two different locations on the sample (the locations were separated by about 1 mm). These plots demonstrate the reproduceability of the results.
- Table I The data described in this example were obtained by linearly increasing the current in the probe, not the temperature of the sample. Thus the rate of change of temperature is not constant.
- An example of a temperature / current characteristic used for data linearization is shown in the inset 1702 to Figure 17A . Although a much faster temperature ramp can be used for the localized analysis of this example than is possible for bulk modulated differential scanning calorimetry, the average value of the heating ramp was only 15°C/min, for a more reliable comparison with bulk data.
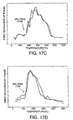
- Figures 17A-17E are a series of plots illustrating localized melting transitions for nylon 6 ( Figure 17A , feature 1704), for nylon 6/6 ( Figure 17B , feature 1706), for nylon 6/10 ( Figure 17C , feature 1708), for high density polyethylene ( Figure 17D , feature 1710) and for polyvinylidene fluoride ( Figure 17E , feature 1712).
- Melting transitions 1704, 1706, 1708, 1710 and 1712 are identified by a sharp change in the slope of the phase signal as the temperature is increased. These changes correspond to the known melting points of the materials as obtained by conventional calorimetry and shown in Table 1.
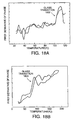
- Figures 18A-18B are plots illustrating localized glass transitions for polystyrene ( Figure 18A , feature 1802) and for poly(ethyl methacrylate) ( Figure 18B , feature 1804).
- the transition to a rubbery state is identified by a change in the slope of the phase signal, which occurs at a temperature similar to the transition temperature obtained by conventional calorimetry. However, this transition is not as pronounced as melting transitions.
- Figure 19 shows plots obtained for the block copolymer system PEO-PS-PEO, where PEO is poly(ethylene oxide) (melting temperature in the range 60 to 70°C) and PS is polystyrene (glass transition in the range of 90 to 110°C).
- PEO poly(ethylene oxide)
- PS polystyrene
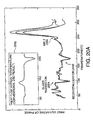
- Figure 20A shows plots recorded at three different locations on the same sample of quenched poly(ethylene terephtalate) (PET). Three reproducible events are clearly identified in each plot. These are interpreted as the glass transition 2004, recrystallization 2006 and the melting transition 2008.
- the inset 2002 in Figure 20A is a typical plot of bulk heat flow versus temperature obtained using conventional DSC on a sample from the same material, illustrating the same transitions in bulk PET.
- Figure 20B shows plots 2020, 2022 and 2024 obtained for temperatures above 300°C, covering the temperature range at which degradation occurs. Three peaks (features 2010, 2012 and 2014) are observed which are tentatively assigned to the breaking of particular bonds.
Landscapes
- Chemical & Material Sciences (AREA)
- Engineering & Computer Science (AREA)
- General Physics & Mathematics (AREA)
- General Health & Medical Sciences (AREA)
- Physics & Mathematics (AREA)
- Health & Medical Sciences (AREA)
- Analytical Chemistry (AREA)
- Biochemistry (AREA)
- Life Sciences & Earth Sciences (AREA)
- Combustion & Propulsion (AREA)
- Chemical Kinetics & Catalysis (AREA)
- Immunology (AREA)
- Pathology (AREA)
- Nanotechnology (AREA)
- Nuclear Medicine, Radiotherapy & Molecular Imaging (AREA)
- Radiology & Medical Imaging (AREA)
- Crystallography & Structural Chemistry (AREA)
- Investigating Or Analyzing Materials Using Thermal Means (AREA)
Description
- The present application claims the benefit of the earlier filing date of
U.S. Provisional Application, Serial No. 60/015,894, filed on April 22, 1996 . - The present invention relates to determining thermal properties of materials using a miniaturized resistive thermal probe. More particularly, the present invention relates to performing localized thermal analysis experiments whereby calorimetric information is obtained from a volume of materials on the order of a few cubic microns, whereas in conventional bulk calorimetry data is obtained from volumes of material on the order of a few cubic millimeters. The present invention also relates to modulating the temperature of a thermal probe to generate evanescent thermal waves in a material to thereby generate sub-surface images.
- Several methods for the non-destructive characterization of solids make use of thermal excitation. Any local disruption of the structure that results in a change in density, specific heat, or thermal conductivity may be detected by some type of thermal probe - often with higher sensitivity than by the use of optical, X-ray, or electron-microscope techniques. Many of these techniques use an intensity-modulated energy source to excite a sample. That is, the intensity of the energy source used to excite the sample is made to vary with time. Induced scattered evanescent thermal waves are then detected by, for example, monitoring the surface temperature of the sample. When a scanning mechanism is also incorporated, it is then possible to achieve spatial thermal mapping. Subsurface imaging can be performed within the depth of penetration of the thermal wave.
- Most conventional methods of thermal imaging employ an energy beam that emerges from a small source and spreads out according to the rules of diffraction. The extent of this spreading is normally governed by the wavelength associated with the energy flux. However, if the sample is within the "near-field" region, i.e., significantly less than one wavelength away from the source, then a greatly reduced beam diameter can be achieved. In this case, the beam diameter is not much larger than the size of the source itself.
- This principle is applied in Scanning Probe Microscopy whereby a sharp probe is brought in close proximity to the surface of a sample. Some probe/sample interaction takes place. This interaction is monitored as the probe is scanned over the surface. An image contrast is then computer-generated. The image contrast represents variations of some property (e.g., physical, mechanical, chemical) of the sample across the scanned area. One such scanning probe microscope is the Atomic Force Microscope (AFM). In conventional AFM, the height of a probe above the surface being scanned is controlled by a feedback system, that keeps the force between the probe and the surface of the sample constant. The probe height is monitored, and provides the data that is used to create image contrast which represents the topography of the scanned area.
- Near-field thermal imaging is described by C.C. Williams and H.K. Wickramasinghe in Photoacoustic and Photothermal Phenomena, P. Hess and J. Peltzl (eds.), p. 364 (1988). In their device, the probe is a specially made coaxial tip that forms a fine thermocouple junction. This probe provides a spatial resolution on the order of tens of millimeters. The sample is either heated using a laser or the probe, or the sample is heated electrically. The feedback system maintains the probe temperature constant (instead of maintaining the force constant), by varying the probe height as necessary.
- In "Thermal Imaging Using the Atomic Force Microscope," Appl. Phys. Lett., vol. 62, pp. 2501-3 (1993), Majumdar, et al. describe a technique for thermal imaging that uses a simpler design of thermocouple tip, than that disclosed by Williams and Wickramasinghe. Majundar, et al. implemented standard atomic force microscopy feedback to maintain tip/sample contact. R. B. Dinwiddie, R.J. Pylkki and P.E. West "Thermal Conductivity Contrast Imaging with a Scanning Thermal Microscope," Thermal Conductivity 22, T. W. Tong (ed.) (1994), describe the use of a probe in the form of a tiny platinum resistance thermometer.
U.S. Patent No. 5,441,343 to Pylkki et al. , which is incorporated herein by reference, discloses the thermal sensing probe for use with a scanning probe microscope, in which the contact force of the probe is maintained at a constant level as the probe is scanned across the surface of the sample. - In those studies, the samples were generally probed at a constant (ac or dc) amplitude of either surface temperature or heat flow. Thus changes in the thermal properties of materials, such as heat capacity or thermal conductivity, were not investigated. This is because the temperature of the sample was not raised by a sufficient amount for a change in the sample's thermal properties to be detected.
- Bulk thermal analysis techniques have been developed to study such changes in the thermal properties of materials. Modulated temperature differential scanning microscopy (MDSC) and spatially-resolved modulated differential scanning calorimetry (SR-MDSC) are described in
U.S. Patent No. 5,224,775 ('775 patent) andU.S. Patent No. 5,248,199 , respectively, which are both incorporated herein by reference. A conventional heat flux differential scanning calorimeter (DSC) measures the heat flow into and out of a sample with respect to a reference. Both sample and reference are usually subjected to a linear temperature/time ramp. In one implementation of MDSC, a sinusoidal modulation is superimposed on the underlying heating ramp to generate a corresponding sinusoidal response in the heat flow signal. This results in two measurements of heat capacity, an underlying linear long-period measurement due to the underlying heating ramp and a higher-frequency cyclic measurement due to the superimposed sinusoidal modulation. For many systems the cyclic measurement "sees" only the reversible heat capacity associated with molecular vibrations, e.g., glass transitions, whereas the underlying measurement also sees endotherms and exotherms associated with kinetically-controlled events such as recrystallizations, cure reactions or the loss of volatile materials. - The reader may be further enlightened as to the state of the art by reference to the patent documents
US-A-5248199 andUS-A-5224775 . The present invention is characterised by reference toUS 5224775 . - In order to alleviate at least some of the technical problems experienced with the aforementioned prior art the present invention provides a method of performing localized thermal analysis according to
claim 1 and an apparatus for performing localized thermal analysis according to claim 19. - The present invention is a new analytical technique which makes calorimetric measurements on a localized scale. Data obtained from the measurement can be used to generate contrast in our image of the thermal properties of the sample on a localized scale. In addition, by subjecting the sample to an oscillating program, images of the sample at a depth below the surface can be made. The depth corresponds to the frequency of the applied oscillatory temperature.
- The present invention applies modulated temperature differential scanning calorimetry, as described in
U.S. Patent No. 5,224,755 to Reading, et al. - ('775 patent), which has been conventionally used to perform bulk thermal analysis experiments of a sample material, to microscopic thermal analysis of a sample material using two highly miniaturized resistive probes, developed by the Topometrix Corporation (
U.S. Patent No. 5,441,343 to Pylkki et al. ('343 patent)), in a differential configuration. A sample probe attached to a Scanning Probe Microscope is positioned at a desired location on the surface within the field of view. - Localized calorimetry is then performed at that position by inducing and detecting localized phase transitions. This is achieved by ramping the temperature of the probe by passing an electrical current through the probe. A small temperature oscillation is superimposed to that temperature ramp by adding a modulated component to current the probe current. By scanning over the surface of the sample, contrast can be developed corresponding to particular locations on the sample to create an image of the thermal properties of the sample at particular locations.
- A second embodiment of the present invention allows for sub-surface imaging thermal microscopy to be performed by modulating the temperature of the probe. This is done by passing a modulated current through it, thus generating thermal waves within the sample. The depth of penetration of these waves is frequency dependent, such that the thermal properties of a sample can be probed as a function of depth below the surface.
- The probe, developed by the Topometrix Corporation, is an elongated loop of Wollaston wire, shaped in the form of a cantellver whose end forms the resistive element. The resistance of that element varies with temperature. Conversely, its temperature can be set by passing a current of appropriate value through it. A mirror is attached across the loop allowing for the contact force of the element on the sample to be held constant, as in conventional atomic force microscopy, while the probe is scanned across the surface of the sample.
- In the two embodiments of the present invention, the probe is used as a highly localized heat source by passing a current through it. As the probe is brought close to the surface of a sample, heat will flow from the probe to the sample. The amount of heat flowing will vary according to various properties of the sample at the location under the probe. This varying heat flow causes the temperature of the resistive element to change, thereby changing its resistance. A feedback circuit is preferably used to sense the change in the probe resistance (and therefore its temperature) and increase the amount of current flowing through the probe to bring it back to Its original resistance value (and therefore to its set temperature). A differential signal Is then monitored, either directly or through a lock-in amplifier. The differential signal is used to either (1) produce localized analysis plots of amplitude and phase data versus temperature that provide calorimetric information at a specific position on the sample, or (2) construct an image whose contrasts represent variations in thermal conductivity and/or diffusivity across a scanned area. In one embodiment, a time-varying current through the resistive elements generates thermal waves in the sample. The modulation frequency of the time-varying current is functionally related to the depth below the surface of the sample at which an image of the sample is desired. A sub-surface image is thus generated. The depth of material below the sample surface that is contributing to the image can be controlled by suitably choosing the temperature modulation frequency. As described in Almond, et al, "Photothermal Science and Techniques," ), which is hereby incorporated by reference in its entirety, the penetration depth is proportional to the square root of the thermal diffusivity of the sample divided by the frequency of the applied temperature wave.
- A first object of the present invention is to provide localized differential thermal analysis at the micron level, such that events such as glass transitions and meltings can be induced in a highly spatially localized manner and identified.
- A second object of the present invention is to use scanning thermal microscopy to obtain sub-surface images of solids, in which the image contrast is due to variations in thermal diffusivity within a given controllable depth.
- Another object of the present invention is to use a highly miniaturized resistive thermal probe as a highly localized source of heat, such that it can be used to produce highly localized phase transitions at the surface of samples.
- Another object of the invention is to use modulated differential scanning calorimetric signals to produce a high-frequency temperature modulation in a probe used for sensing the thermal properties of materials at different depths below the surface.
- Another object of the present inventions to provide an apparatus which can, for a sample containing different regions subject to either reversible or irreversible changes with temperature, produce thermal images showing contrast based upon the reversing and nonreversing nature of the heat flow, respectively.
- These and other objects of the present invention are described in greater detail in the detailed description of the invention, the appended drawings and the attached claims.
-
-
Figure 1 is a schematic diagram of the cantilevered thermal resistance probe. -
Figure 2 is a circuit diagram of the probe control and sensing circuit. -
Figures 3A-3C are schematic diagrams of alternative probe control and sensing circuits. -
Figure 4 is an illustration of the probe in relation to buried inclusions. -
Figure 5 is a detail of the semi-infinite volume element ofFigure 4 . -
Figure 6 is a series of calculated plots of the heat flow (lower curve) and the temperature profiles (upper curves) within the sample for five different depths of a buried copper layer. -
Figure 7 is a simulated heat flow scan across two particles, buried at three different depths (as labelled). -
Figure 8 shows the variation of the calculated lateral resolution as a function of layer depth. -
Figure 9 shows the calculation of simulated heat flows as the probe is scanned across two particles for three different tip radii (as indicated). -
Figure 10 shows a feedback voltage line scan, for comparison with the calculation shown inFigure 9 . -
Figures 11A-11D are subsurface thermal images of buried particles. -
Figure 12 is a thermal image of a PVC/PB immiscible blend. -
Figures 13A and 13B are thermal images of a PMMA/CPE blend. -
Figures 14A and14B illustrate temperature- and probe-induced effects on domains in a PVC/PB blend. -
Figure 15 shows the phase signal recorded for three types of nylons, and for PCL. -
Figure 16 is a plot of the derivative of the phase signal of PET. The inset shows a typical heat flow signal obtained using conventional bulk differential scanning calorimeter. -
Figures 17A-17E are plots of the first derivative of the phase, which illustrate localized melting transitions for a number of polymers. The melting temperature range as observed with conventional calorimetry is given in brackets as follows:-
Figure 17A : nylon 6 (210-220°C) (the inset shows a probe current versus temperature characteristic used to achieve linearization for all the data presented in this example). -
Figure 17B :nylon 6/6 (240-265°C). -
Figure 17C nylon 6/10 (190-220°C). -
Figure 17D polyethylene (130-140°C). -
Figure 17E : polyvinylidene fluoride (155-185°C).
-
-
Figures 18A-18B are plots of the first derivative of the phase versus temperature, illustrating a localized glass transition for two polymers:-
Figure 18A : polystyrene (90-110°C). -
Figure 18B : poly(ethyl methacrylate) (60-90°C).
-
-
Figure 19 shows plots of the first derivative of the phase versus temperature obtained for the PEO-PS-PEO block copolymer system. -
Figure 20A shows plots of the first derivative of the phase signal versus temperature obtained at three different locations on a quenched poly(ethylene terephtalate) sample. -
Figure 20B are plots obtained in a temperature range in which the sample degrades, showing three reproducible peaks. - The scanning probe system used in the preferred embodiment of the present invention is the Explorer scanning probe microscope manufactured by the Topometrix Corporation, located in Santa Clara, California. Preferably, the system is operated as a constant force microscope. When operated as a force microscope, the Topometrix instrument uses a laser, together with a four-quadrant photodiode as the detection system for cantilever deflection. The scanner, probe and detection system form a self-contained system mounted independently of the sample. The sample is therefore free to be mounted on an appropriate stage (a heating stage for example).
-
Figure 1 illustrates schematically a resistivethermal probe 100 for use in a preferred embodiment of the present invention. Theprobe 100 comprises acantilever 102 mounted to acantilever mount 104. The arms of the cantilever are made of Wollaston process wire having silver wire that is preferably 75 µm in diameter. The silver wire preferably contains a platinum/10% rhodium core. The platinum/rhodium core is preferably 5 µm in diameter. The arms of the cantilever form aloop 106 at one end of theprobe 100. Where theloop 106 is formed, the silver is etched away, thereby exposing the platinum/10% rhodium core. The length of the exposed core is preferably 150-200 µm in length. Theloop 106 is the resistive heating source of theprobe 100. As shown inFigure 1 , thecantilever 102 of theprobe 100 is bent to a suitable shape, i.e., has as sharp a bend as possible. The sharp bend yields a very small area of contact with the sample. The small area of contact with the sample allows for precise heating of a particular location on the sample. Such aprobe 100 is commercially available from the Topometrix Corporation. - The
probe 100 is attached to a scanning probe microscope via thecantilever mount 104. Part of the structure acts as acantilever 102 onto which amirror 108 is cemented for the purpose of laser beam deflection in order to achieve force control. Themirror 108 reflects a laser beam to a four-quadrant photodiode (not shown). The laser/mirror/photodiode system is used to sense the cantilever deflection, and thus to provide feedback to enable theprobe 100 to be scanned at constant force. Theprobe 100 is held magnetically in place on the scanner in a well-known manner. An epoxy bead (not shown) is added near the end of the cantilever to reduce the risk of breaking the filament. Such a scanning probe system is the Explorer scanning probe microscope produced by Topometrix Corporation. - The resistive
thermal probe 100 can be used as a highly localized heat source as well as a detector. When heated by the passage of an electric current through theresistive portion 106 of theprobe 100, its contact with the sample acts as a point-like heat source. Therefore, no other means of sample heating, such as a laser, is required. Theprobe 100 is attached to a scanning mechanism, and is controlled to obtain thermal image contrast that corresponds to variations in either thermal conductivity (using DC imaging) or thermal diffusivity (using AC imaging). - A conventional method for operating the probe is in the constant temperature, self-heating mode. The thermal element is used as a resistive heater, as well as functioning as a temperature sensor. As illustrated schematically in
Figure 2 , theprobe 100 forms one of the legs of aWheatstone bridge 204. The remaining legs of thewheatstone bridge 204 are formed by resistors R1 and R2, and a resistor Rc. Resistors R1 and R2 are chosen to have constant values. The resistor Rc is chosen to provide the set point for the bridge voltage as described below. The resistor RL accounts for the resistance of the probe's 100's probe leads. - The
Wheatstone bridge circuit 204 uses afeedback loop 205 to adjust a bridge voltage Vb as necessary to keep thebridge 204 balanced. By maintaining the balance of thebridge 204, the temperature of the probe is kept constant. Thefeedback loop 205 generally comprises adifference amplifier 206 and afeedback circuit 212. Thedifference amplifier 206 has afirst input 207, coupled to ajunction 208 and asecond input 209 coupled to ajunction 210. Thesecond input 209 is the inverted input of thedifference amplifier 206. The difference amplifier determines the voltage difference across thejunctions feedback circuit 212 to adjust the bridge voltage Vb as required. The amount of adjustment required to maintain the bridge balance is used to develop contrast in an image. For example, the spot intensity on a cathode ray tube (CRT) screen can be made to be proportional to the bridge adjustment voltage. - As the
probe 100 contacts thesample surface 216, heat flows from theprobe 100 to the sample. In the absence of temperature feedback, this flow of heat reduces the probe temperature, decreasing its resistance and causing the bridge balance to shift. Thefeedback loop 205 senses this shift throughdifference amplifier 206 and increases the voltage, Vb, applied to the bridge. This in turn increases the resistive heating of theprobe 100, returning its resistance to the set point. The set point is the probe resistance that corresponds to a constant desired operating temperature, and is set by appropriately choosing the value of Rc. Theprobe 100 is scanned at constant force. Variations in the heat flow out of theprobe 100 are measured by monitoring the bridge voltage Vb required to maintain the probe's 100's resistance such that it produces the content desired operating temperature. The bridge voltage signal Vb is then used to create contrast in the thermal image. - Referring to
Figure 3A , a schematic diagram illustrating a first preferred embodiment of the present invention is presented. The first embodiment both maintains a constant underlying temperature when scanning the surface of a sample and generates thermal waves into the sample. It does so by incorporatingcontrol circuitry 300 that adds anoscillating voltage signal 302 to an underlyingDC voltage signal 303 to cause the temperature of the region of thesample 216 in contact with the probe to oscillate about a fixed temperature. The fixed temperature is set by the value of resistor Rc and maintained by operation of thefeedback circuit 306. - A summing
circuit 305 is used to sum theoscillating voltage signal 302 with the voltage set by thefeedback circuit 306. The voltage set by thefeedback circuit 306 is the voltage that is required to maintain the probe at a constant temperature (set by Rc). The addition of theoscillating voltage signal 302 generates a thermal wave in thesample 216. Thebridge 204 imbalance caused by the heat flow out of theprobe 100 to the sample is monitored using a lock-in amplifier (LIA) 304. LIAs, such asLIA 304, are well-known devices that are used for coherent detection and recovery of modulated signals having a low signal-to-noise (SNR) ratio, i.e., that are buried in noise. Thus, theLIA 304 determines the amplitude and phase of the heat flow due to theoscillating voltage signal 302. This information is subsequently used to generate contrast in an image as described further below. The LIA computes the amplitude and phase (relative to a reference) of the modulated signal of interest. In the preferred embodiment, the reference is theoscillating voltage 302. TheLIA 304 of the present invention preferably has a frequency range from approximately 1 millihertz (mHz) to approximately 1 megahertz (MHz). - The
feedback circuit 306 preferably includes adifferential stage 307 and anintegration stage 308. Thedifferential stage 305 determines the error between the set point value and the value actually measured. The error is input to the integrator instage 308. Theintegrator 308 attempts to force the error to zero. Variations in the AC signal due to the heat flow from theprobe 100 to thesample 216 are used to generate contrast in an image which represents variations in thermal diffusivity at a given temperature (set by Rc) within the thermal wave diffusion length. This is accomplished by monitoring the amplitude and the phase of the ac signal, using theLIA 304. - Using the values of the generated dc amplitude, ac amplitude and/or ac phase signals, contrast is developed in an image of the sample. The image represents a depth of the sample determined by the frequency of the applied
oscillating voltage 302. In the preferred embodiment, the value of the contrast is proportional to the value of the generated dc amplitude, ac amplitude, or ac phase signal used to generate the contrast. - A second preferred embodiment of the present invention is illustrated schematically in
Figures 3B and3C . The second preferred embodiment incorporates two probes, asample probe 320 and areference probe 322, to perform localized thermal analysis at the surface of thesample 316. For example, localized MDSC experiments, such as those described in the '775 patent, can be performed at a location on the surface of the sample, rather than for the sample bulk as in conventional systems. In the preferred embodiment, both thesample probe 320 and thereference probe 322 are similar to theprobe 100 described above. - According to the preferred embodiment of the present invention, a particular location on the sample at which to perform a localized thermal analysis is selected by first obtaining a thermal image of the sample. The thermal image can be obtained by a technique according to the first embodiment of the present invention or any other technique. Using the thermal image, the particular location is selected. One method for selecting the particular location is to use a pointing and selection device, such as a computer mouse, to select the particular location by pointing to and clicking on a particular location in a representation of the thermal image that is displayed on a computer monitor. The
sample probe 322 is then positioned at the particular location by the scanning probe microscope system. When thesample probe 322 is properly positioned at the particular location, a thermal analysis is performed by supplying thesample probe 322 with a current to produce a heating function according to a temperature program as described below. - Equal currents (I) 326 are passed into the
reference probe 320 and into thesample probe 322. An example of thecurrents 326 is illustrated graphically inFigure 3D as current 340. As shown, the current 340 has a constant underlying heating rate on which a modulating signal is superimposed. In the preferred embodiment, the modulating signal is sinusoidal in character. However, as described in the '775 patent, the modulating signal can assume a variety of functions. - The current 340 can be generated in accordance with any desired temperature program. For example, temperature programs used in conventional bulk analyses can be used. In addition to the sinusoidal current described above for example, the current 340 can be created by choosing a repeating unit, and a number of repetitions for the repeating unit. Various parameters relating to the temperature program can be determined from the temperature program subsequent to its generation. For example, the underlying heating rate can be determined by averaging over a single period of the temperature program. Moreover, the frequency can be determined as the reciprocal of the period. In addition, the temperature as measured by the
sample probe 320 can be used to calculate the underlying heating rate, and modulation amplitude and frequency as required. These parameters can be determined, or selected, by a computer or a user. - Referring back to
Figure 3B , thesample probe 320 is in mechanical contact with the surface of thesample 316 at a fixed location. Thereference probe 322 is preferably not in contact with any solid. As described below with reference toFigure 3C , each current 326 is the sum of an alternating current (ac) component and a direct current (dc) component. The ac component produces ac heating in theprobes probes Figure 3D . - The difference between the voltages across the probes is fed into a lock-in-
amplifier 328. Adifferential amplifier 330 can be used to determine the difference. Three signals are derived using this configuration. First, a DC signal is obtained after low pass filtering through a low pass filter (LPF) 329. The DC signal contains information that is related to the underlying temperature of theequal currents 326. The two remaining signals are output by theLIA 328. TheLIA 328 outputs one signal that is representative of the AC amplitude of the differential AC signal. TheLIA 328 also outputs a signal that is representative of the phase of the AC differential signal. These signals can be plotted, displayed in real time, e.g., on a CRT display, such as a computer monitor, or an oscilloscope, and/or stored to a computer disk or any other storage device. - Using these signals, the temperature at which the sample undergoes a phase transition at the particular location analyzed can be determined. The phase transition is indicated by a sharp transition or peak in one or more of the three signals. The resulting amplitude and phase data can be displayed or plotted in a variety of ways. For example, plots of amplitude versus temperature and phase versus temperature can be made at specific location on the surface of the sample. In an alternative embodiment, layered plots of amplitude versus temperature and phase versus temperature can be made for locations taken at even intervals across the surface of the sample as the surface is scanned by the
sample probe 320. -
Figure 3C is a more detailed schematic diagram of the circuitry used to perform localized MDSC.Figure 3C shows an integralcontrol feedback circuit 332. It includes anintegrator 333 and adifferential amplifier 330, which are used to maintain the DC temperature of thesample probe 320 at the value set by thereference probe 322. Thefeedback circuit 332 forces the difference between the voltage across thesample probe 320 to be equal to the voltage across thereference probe 322 by forcing the error between the voltages measured by thesample probe 320 and thereference probe 322 to zero. In addition, an alternating current (ac IN) is injected into the two probes to produce AC heating using the summingcircuits - The bandwidth of the
feedback circuit 332 can be set higher to or lower than the frequency of the ac modulation. If set higher, thefeedback circuit 332 responds to both the ac and dc components of the error signal. If set lower, thefeedback circuit 332 only responds to the dc component of the error signal. This flexibility provides and additional parameter for conducting an experiment. Where the frequency is set depends on the given experiment. Considerations as to whether to use a higher or lower frequency include the sample material being studied and the localized phase transition through which the sample material is driven. Preferably, the bandwidth of thefeedback circuit 332 is set to 1 kHz. Furthermore, the current used is preferably such that a temperature oscillation of about one degree amplitude is obtained. The differential voltage across the two probes is monitored by thedifferential amplifier 332. Three signals are recorded: the amplitude of the differential underlying signal (DC OUT), as measured by a summingcircuit 338, and the phase (PHASE) and amplitude (AMP) of the dynamic signal, as measured by the lock-inamplifier 328. The DC OUT signal is fed back to the dc in input of the summingcircuit 334. These three signals can be digitized and read into a computer, or displayed in real time, e.g., on a CRT display, such as a computer monitor, or an oscilloscope. As described above, various plots or displays of the data can be made using these signals. - As in any macroscopic differential scanning calorimeter measurement, the temperature ramp generally produces variations in the thermal conductivity and heat capacity of the sample, which may also undergo local phase changes. The apparatus of
Figure 3C uses local heating rather than a heating stage, so that these temperature-induced variations will themselves be subject to spatial variation according to where the sample probe is positioned. In turn, the heat flow out of the probe, and therefore the resistance and the voltage across the probe, vary according to where the sample probe is positioned. This is reflected in the variations of the amplitude and phase of the differential signals, as well as in the DC signal. The probed volume of material in the present invention is of the order of a few µm3. The probed volume is the smallest volume that can be used to generate a useful localized MDSC scan. It can be used to map thermally activated near-surface processes such as glass transitions, melting, cure reactions, recrystallizations and degradations. Because the probes are used as heat sources as well as detectors, using a single probe would give a baseline which would tend to hide any variations in the signal indicative of phase changes between the applied temperature and the resulting measurement. An important feature of the differential arrangement is that by means of the feedback mechanism, the sample probe is maintained at the same temperature as the reference probe. - A one-dimensional mathematical model which describes the probe-sample interaction has been developed in the simple case of constant temperature (DC) thermal imaging. DC imaging can be considered as the extreme case of AC imaging when the frequency is zero. This mathematical model illustrates the sub-surface imaging capability of the present invention.
- The flow of heat in the sample can be related to the heat dissipated in the resistive element and therefore to the voltage applied to the bridge as follows:
- The resistance Rp of the probe (and therefore its temperature T) is set by selecting Rc (see
Figure 2 ). This resistance can be expressed as:
where a is the temperature coefficient of the resistance of the probe material, Ta is the ambient temperature, Ra is the resistance of the probe at ambient temperature and R l is the lead resistance. - When the probe is away from the sample, the energy dissipated in the probe to raise its temperature to the desired value T is then given by:

where Vp0 is the voltage across the probe and is calculated from the bridge voltage Vb0 as:
- As the probe is lowered towards the sample heat will flow out, lowering the temperature and resistance of the probe, but the feedback circuit increases the energy dissipated in the probe and readjusts its temperature (and resistance) to the set value, as determined by Rc.
- The heat dissipated in the probe is now:

where the new voltage probe Vp is calculated from the bridge feedback voltage V. - The electrical energy dissipated in the probe now also includes heat flowing into the sample. This outflow of heat can thus be measured and is given by:
-

- The flow of heat in the sample is affected by several factors including the contact area of the probe, the temperature difference between probe and sample and the thermal conductivity of the sample.
Figure 4 is a schematic diagram depicting theprobe 400 in contact with the surface of asample 406. The probe is modeled as a series of elementalcontiguous heat sources 402, each having the same projected area of cross-section A. For example,elemental heat source 402 is overvolume element 404. The elemental heat sources are all at the same temperature, but are located at different heights above the surface of thesample 406. To simplify the heat flow calculation, the heat flow is assumed to be unidirectional along the z-direction into the sample. As illustrated inFigure 5 , this assumption is a major simplication to the heat flow. In reality, there is a lateral component 502 to the heat flow in each volume element.Figure 5 depicts an expanded view ofvolume element 404. The effect of the lateral component of the heat flow 502 is accounted for by considering the walls of the element as not being thermally insulating. The loss at the walls is then modeled by including a loss coefficient ∈ which represents heat loss through the walls of theelement 504. - Consider an element of cross-section A extending through a layer of thickness (z2 - z1) (material 2) embedded at depth z1 in a semi-infinite matrix (material 1). The thermal conductivities of
material 1 andmaterial 2 are k1 and k2, respectively. The corresponding part of the surface of the thermal probe 408, which is the heat source, is at a distance zo from the surface. Heat conduction into the sample is through a layer of air whose thermal conductivity is ko. The loss coefficient ∈, which represents heat flow through the walls of the element, is assumed to be constant along the length of the element of volume. - In this one-dimensional approximation, the temperature profile in the heated element can be described by the following differential equation:

with i = 0, 1, 2, 3. The general solution is:
where
and where P and Q are constants. The solution to the problem is found using the following boundary conditions, which define temperature and heat flow continuity (Ti is the temperature above ambient):


- These equations enable the determination of the eight unknowns Pi, Qi, and thus the determination of the temperature profiles Ti(z). The theoretical value of heat flow Qf elm into the heated element is given by:

- The value of the loss coefficient ∈ can be determined as follows. Heat flow from the probe into the sample was determined experimentally for various probe positions over homogeneous regions and over regions with buried inclusions of different sizes, e.g., 0.4 µm, 1.0 µm and 4.0 µm. The values of ∈ for each probe position are then calculated using these experimentally measured values of heat flow, the theoretical expression for the heat flow into the sample given above in equation (1), the assumed nominal values of burial depth and thickness of the inclusions, (whose thicknesses are assumed to be about one-third of the observed lateral size of the inclusions), and the values of the thermal conductivity for copper and for polystyrene shown in Table II below. The calculated values of ∈ determined at each probe position are then averaged to determine ∈ for use in subsequent calculations.
- Using the calculated value of the loss coefficient ∈, the total heat flow is calculated by summing the elemental heat flows along the profile of the probe, out to where the air gap was 100 µm wide. The temperature of the probe was assumed to be constant along its length.
-
Figures 6 ,7 and8 show the results of calculations of temperature profiles directly below the apex of the probe, which is assumed to be just touching the surface. The probe is assumed to have a radius of curvature of 20 µm and a height of 100 µm. The temperature of the probe is assumed to be uniform and constant along the wire length. Heat flows are total heat flows from the probe and obtained by integrating along the shape of the probe. The profiles were calculated for the case of copper inclusions (thermal conductivity = 400 W / m.C) embedded in polystyrene matrix (thermal conductivity = 0.13 W / m.C). The probe temperature, or To, was assumed to be 20 °C above ambient. -
Figure 6 shows the temperature profiles 602, 604, 606, 608, 610 and 612 inside the sample for a 10 µm thick copper layer buried at depths varying from 0.1 to 10 µm. Because of the much higher thermal conductivity of the copper, the temperature gradient across the copper layer is much smaller than the temperature gradient in the polystyrene. The temperature gradient refers to the rate of variation of temperature with depth. The lower curve 614 (right hand vertical scale) inFigure 6 is a plot of the heat flow from the probe for the 10 µm thick copper layer versus the depth of burial of the layer. The heat flow decreases as the layer is buried further away from the surface, and tends to the value of heat flow for a homogeneous polystyrene sample. -
Figure 7 is a series ofplots copper particles 1 micron in length and 1 micron thick, for increasing separation and increasing depth of burial. As a criterion of lateral resolution, we assume that two particles are resolved if:
where Qfmin is the minimum heat flow at a given burial depth, Qfmax is the maximum heat flow at a given burial depth, Qf(a) the heat flow at the trough, and RES is a coefficient of resolution. - If RES is set equal to 20 then the graphs 802 (probe radius p = 20 µm) and 804 (probe radius p = 1 µm) presented in
Figure 8 illustrate lateral resolution as a function of the depth at which the copper layer is buried. Thegraphs insets -
Figures 9 and10 are a comparison of the simulated heat flows 902, 1002 and 1004 as the probe is scanned across two particles for tip radii of 10 µm, 5 µm, and 1 µµm forcurves Figure 9 ) to experimental data (Figure 10 ). Thecurves - In the
scan line 1006 shown infigure 10 , the bridge feedback voltage excursion ranged from an average of 886 mV to an average of 897 mV. This line scan was obtained for the 1 µm thick coating. The feedback voltage when the probe was away from the surface of the sample was 784 mV. The minimum heat flow, into a homogeneous polystyrene region, was calculated to be equal to 165 µW and the maximum heat flow (into a region where a copper particle is buried) was 184 µW. These figures should be compared with theoretical values of 138 µW and 158 µW obtained for a 10 µm thick particle buried at 1 µm depth. - Using the two experimental values of heat flow, the calculated value of the thermal conductivity of polystyrene was 0.21 W m-1 C-1 and the depth of the copper particle was 0.23 µ. These discrepancies arise from approximations and assumptions in the model and also because the sample geometry is not yet fully controllable. Indeed, the surfaces are not truly flat. Furthermore, from the strength of the thermal signal it is clear that the particles were not all buried at the same depth. It is likely that when the samples were hot pressed, the particles sank at different depths below the surface. The model could be extended to three dimensions, to obtain more reliable thermal data for quantitative interpretation. Using well-known lithography techniques, accurate and reproducible samples could be prepared for further adjustments to the model. Such lithography techniques can be found in M.S. Tyagi, "Introduction to Semiconductor Devices," Section 19.5.2, Wiley (New York 1991), which is hereby incorporated by reference. A full calibration of the instrument would then be possible and quantitative interpretation of the recorded data in terms of thermal conductivity measurements, for example, could then be achieved.
- The following examples illustrate applications of the thermal probe to obtain a map of surface calorimetric data, with a lateral resolution on the order of a micron, and a probed volume of material on the order of a few µm3. They include:
- mapping at the sample surface variations in thermal conductivity and in thermal diffusivity, when the temperature-modulation mode is used;
- sub-surface imaging-- in principle, by varying the frequency of the evanescent temperature wave used, the depth to which the evanescent waves penetrate (and hence the thickness of the region being imaged) can be controlled; and
- localized calorimetric analysis of micron-sized regions, as a step towards mapping thermally activated near-surface processes such as glass transitions, meltings, cure reactions, recrystallizations, and degradations.
- The use of the present invention in the characterization of polymer blends is of particular importance, because of the wide use of polymer blends in adhesives and coatings. In such applications, changes in surface properties as a function of temperature are of critical importance.
- For example, film-forming emulsion polymers are widely used in paper coatings, latex paints, water-based adhesives and other applications. The properties of the film itself depend upon the way in which the individual latex particles are able to integrate. The mechanisms of film integration from latex particles, and the interface development between two compatible polymers are currently the subjects of significant study by polymer scientists. For example, the properties of the particle-particle interface affect the performance of the resulting coating, in the case of films used in paper coating, latex paints and water-based adhesives.
- The following examples are provided to illustrate certain embodiments of the present invention. They are not to be construed as limiting the invention in any way.
- This example illustrates the use of the present invention to map heterogeneous samples with heterogeneous thermal properties.
Figures 11A ,11B ,11C and11D were obtained with the scanning probe microscope of the present invention operated in the constant temperature mode and the probe temperature set at 40°C. The thermal contrast images were computer-generated, using the feedback voltage Vb applied to theWheatstone bridge circuit 204. Because of the relatively slow scan speed (usually 100 µm s-1), steady state (thermal equilibrium between the probe and the region of the sample whose temperature is affected by the probe) was reached at each point, so that the image contrast was indeed determined by the value of the heat flow. At each sampling point a certain volume of material was heated. This volume can be approximately delimited by the thermal contact area and an effective depth determined by the temperature gradient below that contact area. The heat flow from the probe into the sample characterizes the thermal conductivities of the material within the heated volume. - Samples were prepared in a well-known manner by spraying polystyrene substrates with fine copper particles (nominally less than 1 micron diameter). The samples were then hot-pressed between glass slides at a temperature just below the melting temperature of polystyrene, and then were coated with a formvar film cast from a solution in chloroform, or coated with layers of polystyrene films 17 µm thick (in this case they are hot-pressed a second time).
-
Figures 11A ,11B and11C are thermal images obtained when scanning samples with a coating thicknesses of 400 nm, 1 µm and 4 µm, respectively. They show areas of highthermal conductivity 1102, randomly shaped, and of sizes varying from a few microns to a few tens of microns. These figures show aggregates of the original particles, which have not fully dispersed below the surface of the samples. The particles are clearly detected and show brighter in the thermal contrast, indicating that they draw more heat from the probe, through the formvar film, because of the higher thermal conductivity of the copper. Thus at each point, the sampling volume heated extends deeply enough to include the buried particles. However, as indicated by the scale bars, the feedback voltage excursion diminishes as the thickness increases. Deeply buried particles do not show, as illustrated byFigure 11D . Here a particle can be faintly seen within this sample, which had been covered with a 17 µm polyester film. We conclude that with a probe temperature of 40°C, the "depth of vision" of the probe is a few microns. This is limited by the background noise (including ambient thermal fluctuations and electronic noise). - This example demonstrates the use of the present invention for the study of immiscible polymer blends systems, including a Poly(vynil chloride) [PVC] / Polybutadiene [PB] blend, a Poly(ethylene oxide) [PEO] / Polybutadiene [PB] blend and a Poly(methyl methacrylate) [PMMA]/Chlorinated polyethylene [CPE] blend. The blends were cast from solutions on microscope glass covers with a 50/50 percentage weight. After drying, films about a hundred microns thick are formed.
- In each system, the two polymers involved segregate, being immiscible: one forms a matrix and the other forms Island-like domains. The two phases In each sample were identified by mapping the thermal conductivity variation across the surface of the sample using the thermal probe, operated in the closed loop mode not embodied by the present invention, at a constant temperature of 40°C. The signal was obtained from the feedback voltage applied to the controlling bridge in order to maintain a constant probe temperature. The contrast at each point represents variations in thermal conductivity across the sample.
-
Figure 12 is athermal image 1202 of a PVC/PB blend obtained at a zero modulation frequency and not embodied by the present invention. The image contrast Is a representation of thermal conductivity variations across the sample within a depth of a few microns. The two phases are clearly apparent: PB, having a higher thermal conductivity (0.24 J/sec.m.K) than PVC (0.14 J/sec.m.K), is identified by the brighter island-like domains 1204 of higher thermal conductivity. Thus in this particular system, PB segregates intodomains 1204 of diameter up to about 50 µm in a matrix of PVC. -
Figures 13A and 13B areimages Figure 13A , the probe was operated in the closed loop mode at a temperature of 40°C. ForFigure 13B , a 10 kHz fluctuating temperature of about 5°C was superimposed on the 40°C operating temperature. InFigure 13A , the contrast corresponds to variations in thermal conductivity. Thus in this particular system, PMMA, which has a higher thermal conductivity than CPE (0.193 against 0.144 J.S-1m-1,K-1), segregates again into island-like domains 1306 in a matrix of CPE. InFigure 13B , contrast arises from the phase shift of the AC voltage across the probe as it is scanned. The contrast inFigure 13B represents variations of thermal properties, which include diffusivity, across the sample within a depth (below the surface) equal to the thermal diffusion length, as determined by the modulation frequency. - This example illustrates the use of the present invention to follow, in real time, the behavior of PVC domains in a PVC/PB blend as a function of temperature, using a temperature-controlled hot stage. The same area was scanned at increasing hot stage temperature, which was maintained constant during each scan. The probe was operated in the closed loop mode, at a constant temperature of 85°C. Images obtained at room temperature (RT), 50°C, 70 °C, 78°C, 95 °C and 100°C are shown in
Figure 14A (1402, 1404, 1406, 1408, 1410 and 1412). (The temperature of the sample is shown in the upper right-hand corner of each image.)Figure 14B also shows images (1420, 1422, 1424, 1426, 1428 and 1430) of PVC domains in a PB matrix as a function of increasing temperature. As the temperature is increased up to about 70°C, little change to the system is observed, although small domains can be seen to move and are absorbed into neighboring larger ones. As the temperature is further increased large domains move outside the field of view. Onedomain 1414 is clearly seen to have broken up intosmaller ones 1416. The reversal in contrast in the higher temperature images is due to the temperature of the stage becoming higher than the average temperature along the probe (set at 85°C). - At and above room temperature, PB is in the rubbery state (the glass transition takes place at -65°C) and up to about 70°C, PVC is in the glassy state. The probe induces a local phase transition in PVC and further softening of the PB This facilitates the movement of small domains. Above 70°C, PVC becomes rubbery and this probably accounts for the break up of the PVC domain under the action of the scanning probe. Above about 90°C, PB is in an almost liquid state, and the large PVC domains are easily moved by the probe to beyond the field of view.
- This example shows the use of the present invention to perform spatially localized thermal analysis. Instead of using a heating stage, precisely-defined regions of the sample were heated through the temperature range of interest. The heat was supplied by the probe itself. The probe was placed at a fixed location on the surface of a sample (see
Figure 3B ), and both sample probe and reference probe were subjected to a temperature ramp with an added temperature oscillation of about one degree amplitude. - A number of polymeric materials were investigated. The transitions were more sharply identified in the phase signal. Some of the results obtained are presented here in the form of plots of the phase, or the first derivative of the phase, against temperature. Data from bulk samples of the same materials obtained from conventional bulk thermal analysis techniques (DSC and thermogravimetric analysis (TGA)) are also presented for comparison in Table I.
-
Figure 15 shows the phase signal recorded for three types of nylons (11 (1502), 6 (1504), and 6/6 (1506)) and polycaprolactone (PCL) 1508. Melting points are identified by a sharp change in the slope of the signal. Table I shows that these changes correspond to the melting points of the materials. The changes observed at higher temperatures are probably associated with decomposition. For example, there is a good correlation with the thermal decomposition temperature range obtained from TGA shown in Table I. -
Figure 16 is a plot of the first derivative of the phase versus temperature obtained for quenched poly(ethylene terephtalate) (PET), covering a region of temperature over which degradation occurs. Below 300°C three events are clearly identified. These are interpreted as theglass transition 1602,recrystallization 1604 andmelting 1606, respectively, as shown inFigure 16 . Theinset 1608 inFigure 16 is a typical plot of bulk heat flow versus temperature obtained using conventional DSC on a bulk sample from the same material. The inset shows that the same events are recorded using conventional bulk DSC. However, while the melting transition occurs over the same range of temperature in the signal obtained using a localized scan as in the bulk signal, the glass transition and recrystallization occur at higher temperatures in the localized signal as compared with the bulk signal. This may be due to surface effects, and to the small volume of material involved. - At temperatures above about 350°C, decomposition 1610 is observed. This is consistent with bulk TGA data. Furthermore the three
peaks 1612 observed during degradation may be associated with the breaking of specific chemical bonds. Degradation refers to a stage along the process which can eventually result in complete decomposition. - This example shows that the phase signal can be used to identify transitions. Some of the results obtained are presented here in the form of plots of the first derivative of the phase vs. temperature. For each material, two or three plots were obtained at two different locations on the sample (the locations were separated by about 1 mm). These plots demonstrate the reproduceability of the results. These data can be compared to the data from bulk samples of the same materials obtained from conventional bulk thermal analysis techniques, shown in Table I. The data described in this example were obtained by linearly increasing the current in the probe, not the temperature of the sample. Thus the rate of change of temperature is not constant. An example of a temperature / current characteristic used for data linearization is shown in the
inset 1702 toFigure 17A . Although a much faster temperature ramp can be used for the localized analysis of this example than is possible for bulk modulated differential scanning calorimetry, the average value of the heating ramp was only 15°C/min, for a more reliable comparison with bulk data. -
Figures 17A-17E are a series of plots illustrating localized melting transitions for nylon 6 (Figure 17A , feature 1704), fornylon 6/6 (Figure 17B , feature 1706), fornylon 6/10 (Figure 17C , feature 1708), for high density polyethylene (Figure 17D , feature 1710) and for polyvinylidene fluoride (Figure 17E , feature 1712). Melting transitions 1704, 1706, 1708, 1710 and 1712 are identified by a sharp change in the slope of the phase signal as the temperature is increased. These changes correspond to the known melting points of the materials as obtained by conventional calorimetry and shown in Table 1. -
Figures 18A-18B are plots illustrating localized glass transitions for polystyrene (Figure 18A , feature 1802) and for poly(ethyl methacrylate) (Figure 18B , feature 1804). The transition to a rubbery state is identified by a change in the slope of the phase signal, which occurs at a temperature similar to the transition temperature obtained by conventional calorimetry. However, this transition is not as pronounced as melting transitions. -
Figure 19 shows plots obtained for the block copolymer system PEO-PS-PEO, where PEO is poly(ethylene oxide) (melting temperature in therange 60 to 70°C) and PS is polystyrene (glass transition in the range of 90 to 110°C). Onetransition 1902 only is observed, with no detectable separation of transition events associated with individual polymers. This indicates that individual polymers are not present as separate chemical identities. -
Figure 20A shows plots recorded at three different locations on the same sample of quenched poly(ethylene terephtalate) (PET). Three reproducible events are clearly identified in each plot. These are interpreted as theglass transition 2004,recrystallization 2006 and themelting transition 2008. Theinset 2002 inFigure 20A is a typical plot of bulk heat flow versus temperature obtained using conventional DSC on a sample from the same material, illustrating the same transitions in bulk PET.Figure 20B showsplots features - The event associated with the glass transition in PET does not show in the phase signal the same way as it does in the case of polystyrene (
Figure 18A , feature 1802) or in the case of poly(ethyl methacrylate) (Figure 18B , feature 1804). This may be because when a polymer goes through a local phase change, such as a glass transition or a melting transition, it softens. This leads to changes in the area of mechanical contact of the probe, so that the recorded signal is affected. This effect must be assessed and deconvoluted from effects due to changes in thermal conductivity/diffusivity, or to heat exchanges (endotherms and exotherms) associated with phase changes. - Although all the characteristic plots presented in these examples were obtained by ramping the temperature upwards, it is also possible to use the present invention with downward temperature ramps. For example, when the temperature is lowered rapidly (e.g., at 100°C/min) down through the melting point of a crystalline polymer (e.g., nylon 11), the change in the phase signal observed at solidification is much less pronounced than the change in the phase signal obtained when temperature is lowered at, e.g., 15°C/min. This may indicate that locally the material has not fully returned to its crystalline from, but is still (possibly partially) amorphous. However, it is also possible that any mechanical loading effect depends upon the direction of the temperature increase or decrease.
- Also, for a polymer at 20 °C, on the basis of the rate at which the spatial resolution degrades with depth under the conditions required for thermal imaging, it can be estimated that a volume of a few cubic microns is probed. Of course, this volume will vary with both the temperature and the temperature ramping rate.
- The foregoing disclosure of examples and embodiments of the present invention has been presented for purposes of illustration and description. It is not intended to be exhaustive or to limit the invention to the precise forms disclosed. Many variations and modifications of the embodiments described herein will be obvious to one of ordinary skill in the art in light of the above disclosure. The scope of the invention is to be defined only by the claims appended hereto, and by their equivalents.
Claims (28)
- A method of performing localized thermal analysis using scanning thermal microscopy, comprising :(a) placing a sample (216, 316,406,) on a stage;(b) exposing a particular location on the surface of said sample (216,316,406) to a temperature generated In accordance with a temperature program having a linear component and an oscillatory component using a heat source (402); and(c) measuring a physical parameter indicative of a thermal property of said sample (216,316,406) at said particular location,(d) recording a result of said measuring step (c)characterised by the step of using the heat source (402) to measure the physical parameter, which heat source (402) allows highly localized heating.
- The method as recited in claim 1, wherein step (b) comprises the steps of:(1) selecting an underlying heating rate to generate a temperature ramp as said linear component;(2) selecting a modulating function as said oscillatory component:(3) modulating said temperature ramp with said modulating function to generate said temperature program; and(4) generating said temperature in accordance with said temperature program.
- The method as recited in claim 2, wherein step (2) comprises the step of selecting a modulation amplitude and a modulation frequency.
- The method as recited in claim 2, wherein step (2) comprises the step of selecting a repeating unit and a number of repetitions for said repeating unit.
- The method as recited in claim 2, wherein step (1) comprises the step of selecting said underlying heating rate by averaging over a period of said modulation function.
- The method as recited in claim 3, wherein step (2) comprises the step of determining said modulation frequency and said modulation amplitude from said temperature program.
- The method as recited in claim 3, wherein step (2) comprises the steps of:(i) digitizing said temperature to generate a digitized temperature; and(ii) determining said modulation frequency and said modulation amplitude from said digitized temperature.
- The method as recited in claim 2, wherein said function is a sinusoid.
- The method as recited in claim 1, further comprising the step of repeating steps (a) - (d) at a plurality of particular locations on the surface of said sample (216,316,406) to thereby determine thermal properties of the sample (216,316,406) at each of said plurality of particular locations.
- The method as recited in claim 1, further comprising the step of separating the dependence of said physical parameter on said temperature into component parts.
- The method as recited in claim 10, wherein said component parts comprise a reversing component and a non-reversing component.
- The method as recited in any one of the preceding claims, wherein said physical parameter is heat flow.
- The method as recited in any one of the preceding claims, wherein said stage is an X-Y stage.
- The method as recited in claim 1, comprising the steps of:wherein in step (b) said temperature program causes the heat source to heat a location on a surface of the sample (216,316,406) at an oscillating temperature using a localized heating element;wherein measuring a physical parameter of step (c) comprises detecting an amount of heat flow at said location from said heating element to said sample (216,316,406); andwherein said recording of step (d) comprises recording heat flows at the location, and,contrasting said recorded heat flows to image a sub-surface point of the sample (216,316,406) at the location in order to develop contrast according to the heat flow and so produce a subsurface image of said sample at said location.
- The method as recited in claim 14, comprising the step of choosing the frequency of said oscillation according to a desired imaging depth below the surface of the sample (216,316,406).
- The method as recited in claim 14 or 15, further comprising the steps of:(e) scanning the heating element to a plurality of locations on the surface of the sample (216,316,406); and(f) performing steps (a) - (b) at each of said plurality of locations.
- The method as recited in claim 16, wherein the heating element is a resistive probe, further comprising the steps of:(g) maintaining a predetermined constant voltage having an underlying DC voltage and a modulated voltage across said resistive probe;(h) measuring the variation of the voltage across said probe as said probe scans over said plurality of locations; and(i) determining said contrast in accordance with the phase or amplitude of the modulated voltage.
- The method as recited in claim 17 where said resistive probe forms one leg of a Wheatstone bridge, further comprising the step of:(j) setting a balance for said bridge, wherein step (h) comprises the step of maintaining said balance in said bridge, and step (1) comprises the step of monitoring the modulated voltage across the bridge using a lock-in amplifier; and(k) determining a phase and an amplitude of the modulated signal using said lock-in amplifier to generate a contrast at each of said plurality of locations.
- An apparatus for performing localized thermal analysis using scanning thermal microscopy comprising:a sample holder in which to place a sample (216,316,406);means for generating a temperature program having a linear component and an oscillator component;means to apply a temperature In accordance with said temperature program to a plurality of locations on the surface of said sample,monitoring means for monitoring a physical property indicative of a thermal property of said sample (216,316,406) at each of said plurality of locations;and recording means for recording a signal representative of said physical property at each said plurality of localized portions,said monitoring means being provided by a sample probe (320) and characterised in that said sample probe provides a highly localized heat source as said means to apply a temperature to said sample surface.
- Apparatus as recited in claim 19 comprising a reference probe (322) to apply a temperature in accordance with said temperature program to a reference.
- The apparatus as recited one of claims 19 or 20, wherein said physical parameter is a differential heat flow measured between said sample probe (320) and said reference probe (322).
- The apparatus as recited in one of claims 19 to 21, wherein said reference probe (322) is not connected to any solid material.
- The apparatus as recited in any one of claims 19 to 22, wherein said monitoring means comprising a lock-in-amplifier to monitor a phase and amplitude of said physical parameter corresponding to said time-varying component.
- The apparatus as recited in any one of claims 19 to 23 adapted for performing sub-surface imaging of a sample (216,316,406) comprising:a stage to provide a sample holder on which to place said sample (216,316,406);said temperature program means generates a temperature program oscillating in correspondence with a depth of a point below said surface to be imaged in said sample (216,316,406); andmeans for contrasting said monitored physical parameters to image said sample (216,316,406) at said location.
- The apparatus as recited in claim 24 wherein a display device is provided for displaying said image.
- The apparatus as recited in claim 24, wherein said sample probe comprises a thermal resistive probe.
- The apparatus as recited in claim 24, wherein said oscillatory component is a sinusoid having a frequency that corresponds to said depth.
- The apparatus as recited in claim 25, wherein said probe forms one leg of a Wheatstone bridge, further comprising a lock-in-amplifier to monitor a voltage and a phase associated with said time-varying component, wherein said contrast is developed in accordance with said amplitude and phase.
Applications Claiming Priority (3)
| Application Number | Priority Date | Filing Date | Title |
|---|---|---|---|
| US1589496P | 1996-04-22 | 1996-04-22 | |
| US15894P | 1996-04-22 | ||
| PCT/IB1997/000528 WO1997040369A1 (en) | 1996-04-22 | 1997-04-22 | Method and apparatus for performing localized thermal analysis and sub-surface imaging by scanning thermal microscopy |
Publications (2)
| Publication Number | Publication Date |
|---|---|
| EP0834069A1 EP0834069A1 (en) | 1998-04-08 |
| EP0834069B1 true EP0834069B1 (en) | 2013-03-27 |
Family
ID=21774224
Family Applications (1)
| Application Number | Title | Priority Date | Filing Date |
|---|---|---|---|
| EP97919593A Expired - Lifetime EP0834069B1 (en) | 1996-04-22 | 1997-04-22 | Method and apparatus for performing localized thermal analysis and sub-surface imaging by scanning thermal microscopy |
Country Status (5)
| Country | Link |
|---|---|
| US (2) | US6095679A (en) |
| EP (1) | EP0834069B1 (en) |
| JP (1) | JP3229329B2 (en) |
| CA (1) | CA2225315C (en) |
| WO (1) | WO1997040369A1 (en) |
Cited By (2)
| Publication number | Priority date | Publication date | Assignee | Title |
|---|---|---|---|---|
| US10054494B2 (en) | 2014-11-26 | 2018-08-21 | International Business Machines Corporation | Temperature sensing |
| US11693028B2 (en) | 2017-11-15 | 2023-07-04 | Kla Corporation | Probe for testing an electrical property of a test sample |
Families Citing this family (78)
| Publication number | Priority date | Publication date | Assignee | Title |
|---|---|---|---|---|
| DE69734153T2 (en) * | 1996-12-31 | 2006-06-22 | Reading, Michael, Ealing | METHOD AND APPARATUS FOR CHEMICAL ANALYSIS FIGURE THROUGH THERMAL GRID MICROSCOPY |
| US6405137B1 (en) | 1996-12-31 | 2002-06-11 | Ta Instruments, Inc. | Method and apparatus for performing chemical analysis using imaging by scanning thermal microscopy |
| HU224150B1 (en) * | 1997-04-24 | 2005-06-28 | Paulik Edit Bessenyeyné | Method and instrument of temperature controller on thermal change of state test |
| US6260997B1 (en) * | 1997-10-28 | 2001-07-17 | Michael Claybourn | Method and apparatus for high spatial resolution spectroscopic microscopy |
| US6185992B1 (en) * | 1999-07-15 | 2001-02-13 | Veeco Instruments Inc. | Method and system for increasing the accuracy of a probe-based instrument measuring a heated sample |
| WO2002040944A1 (en) * | 2000-11-16 | 2002-05-23 | International Business Machines Corporation | Method and apparatus for reading an array of thermal resistance sensors |
| JP3925610B2 (en) * | 2001-02-13 | 2007-06-06 | 喜萬 中山 | Heat generation probe and heat generation probe device |
| US7366704B2 (en) * | 2001-06-28 | 2008-04-29 | Waters Investments, Limited | System and method for deconvoluting the effect of topography on scanning probe microscopy measurements |
| FR2820873A1 (en) * | 2001-07-10 | 2002-08-16 | Commissariat Energie Atomique | Reading of digital data stored by use of a phase change in a recording material using a method based on thermal flux exchange between a sensor and the recording medium so that a single device can be used for reading and writing |
| US7073938B2 (en) * | 2001-10-31 | 2006-07-11 | The Regents Of The University Of Michigan | Micromachined arrayed thermal probe apparatus, system for thermal scanning a sample in a contact mode and cantilevered reference probe for use therein |
| US6692145B2 (en) * | 2001-10-31 | 2004-02-17 | Wisconsin Alumni Research Foundation | Micromachined scanning thermal probe method and apparatus |
| US6679625B2 (en) * | 2001-12-17 | 2004-01-20 | International Business Machines Corporation | Scanning heat flow probe |
| KR100416764B1 (en) * | 2002-03-21 | 2004-01-31 | 삼성전자주식회사 | Non-invasive measuring apparatus of a living body and method thereof |
| JP3828030B2 (en) * | 2002-03-25 | 2006-09-27 | エスアイアイ・ナノテクノロジー株式会社 | Temperature measuring probe and temperature measuring device |
| ATE521886T1 (en) * | 2002-06-10 | 2011-09-15 | Mettler Toledo Ag | METHOD AND DEVICE FOR THE THERMAL ANALYSIS OF A MATERIAL |
| NL1021400C2 (en) * | 2002-09-05 | 2004-03-08 | Tno | Method and device for determining a phase transition of a substance. |
| US7324455B2 (en) * | 2003-03-14 | 2008-01-29 | International Business Machines Corporation | Transfer of error-analysis and statistical data in a fibre channel input/output system |
| US7054257B2 (en) * | 2003-04-29 | 2006-05-30 | International Business Machines Corporation | AFM-based data storage and microscopy |
| US7448798B1 (en) | 2003-06-18 | 2008-11-11 | Veeco Instruments Inc. | Scanning thermal probe microscope |
| US7055378B2 (en) * | 2003-08-11 | 2006-06-06 | Veeco Instruments, Inc. | System for wide frequency dynamic nanomechanical analysis |
| JP4069084B2 (en) * | 2004-01-29 | 2008-03-26 | 富士フイルム株式会社 | Image recording material and image forming method |
| US7313501B2 (en) * | 2005-02-02 | 2007-12-25 | Texas Instruments Incorporated | Method and system for determining the location of a potential defect in a device based on a temperature profile |
| WO2006107991A2 (en) * | 2005-04-05 | 2006-10-12 | Anasys Instruments | Method and apparatus for localized infrared spectroscopy and micro-tomography using a combination of thermal expansion and temperature change measurements |
| GB0509043D0 (en) * | 2005-05-04 | 2005-06-08 | Smiths Group Plc | Thermal probe systems |
| US7654734B2 (en) * | 2005-05-10 | 2010-02-02 | General Electric Company | Methods and devices for evaluating the thermal exposure of a metal article |
| US7626144B2 (en) * | 2005-09-29 | 2009-12-01 | Mikhail Merzliakov | Method and apparatus for rapid temperature changes |
| US7490981B2 (en) * | 2005-12-01 | 2009-02-17 | Basf Catalysts Llc | Method for determining thermal effusivity and/or thermal conductivity of sheet material |
| WO2007133585A2 (en) * | 2006-05-11 | 2007-11-22 | Anasys Instruments | Quantitative calorimetry signal for sub-micron scale thermal analysis |
| US8087821B2 (en) * | 2007-06-06 | 2012-01-03 | Waters Technologies Corporation | Infrared heated differential scanning calorimeter |
| GB2478879B8 (en) * | 2007-06-06 | 2012-10-03 | Waters Technologies Corp | System and method for thermal analysis using variable thermal resistance. |
| US8177422B2 (en) * | 2008-08-15 | 2012-05-15 | Anasys Instruments | Transition temperature microscopy |
| US8955161B2 (en) | 2008-11-13 | 2015-02-10 | Bruker Nano, Inc. | Peakforce photothermal-based detection of IR nanoabsorption |
| US8650660B2 (en) | 2008-11-13 | 2014-02-11 | Bruker Nano, Inc. | Method and apparatus of using peak force tapping mode to measure physical properties of a sample |
| KR101873936B1 (en) | 2008-11-13 | 2018-07-04 | 브루커 나노, 인코퍼레이션. | Scanning probe microscope |
| JP5461917B2 (en) | 2009-08-12 | 2014-04-02 | 株式会社日立ハイテクサイエンス | Softening point measuring device and heat conduction measuring device |
| US8484759B2 (en) * | 2009-08-17 | 2013-07-09 | Ut-Battelle, Llc | Spatially resolved quantitative mapping of thermomechanical properties and phase transition temperatures using scanning probe microscopy |
| WO2011065877A1 (en) * | 2009-11-26 | 2011-06-03 | Hot Disk Ab | Measurement of thermal properties |
| MY156153A (en) | 2009-12-01 | 2016-01-15 | Bruker Nano Inc | Method and apparatus of operating a scanning probe microscope |
| US8384020B2 (en) * | 2010-09-24 | 2013-02-26 | Ut-Battelle, Llc | Spatially resolved thermal desorption/ionization coupled with mass spectrometry |
| WO2012078415A2 (en) * | 2010-11-29 | 2012-06-14 | Bruker Nano, Inc. | Method and apparatus of using peak force tapping mode to measure physical properties of a sample |
| US8914911B2 (en) * | 2011-08-15 | 2014-12-16 | The Board Of Trustees Of The University Of Illinois | Magnetic actuation and thermal cantilevers for temperature and frequency dependent atomic force microscopy |
| US9267851B2 (en) | 2012-06-29 | 2016-02-23 | Ut-Battelle, Llc | Single-contact tunneling thermometry |
| US10054495B2 (en) * | 2013-07-02 | 2018-08-21 | Exergen Corporation | Infrared contrasting color temperature measurement system |
| US9097737B2 (en) | 2013-11-25 | 2015-08-04 | Oxford Instruments Asylum Research, Inc. | Modular atomic force microscope with environmental controls |
| DE102014218136B4 (en) * | 2014-09-10 | 2019-07-18 | Fraunhofer-Gesellschaft zur Förderung der angewandten Forschung e.V. | Thermographic examination device and method for the non-destructive examination of a near-surface structure on a test object |
| FR3028314B1 (en) * | 2014-11-07 | 2016-12-23 | Aircelle Sa | PROCESS FOR CHARACTERIZING THERMAL AGING OF COMPOSITE MATERIALS, PARTICULARLY COMPOSITE MATERIALS WITH ORGANIC MATRIX |
| US9702837B2 (en) * | 2014-12-02 | 2017-07-11 | Kuwait Institute For Scientific Research | System for measuring glass transition temperature of a polymer |
| US10338016B1 (en) * | 2015-09-28 | 2019-07-02 | Jeffrey Callister | Verification of material composition in precious metal object |
| US11573159B2 (en) | 2019-01-08 | 2023-02-07 | Saudi Arabian Oil Company | Identifying fracture barriers for hydraulic fracturing |
| US11162978B2 (en) | 2019-03-19 | 2021-11-02 | The University Of Akron | Method of operating scanning thermal microscopy probe for quantitative mapping of thermal conductivity |
| US11319478B2 (en) | 2019-07-24 | 2022-05-03 | Saudi Arabian Oil Company | Oxidizing gasses for carbon dioxide-based fracturing fluids |
| US11492541B2 (en) | 2019-07-24 | 2022-11-08 | Saudi Arabian Oil Company | Organic salts of oxidizing anions as energetic materials |
| US11268919B2 (en) | 2019-09-12 | 2022-03-08 | Saudi Arabian Oil Company | Thermal analysis for source rocks |
| US11150206B2 (en) | 2019-09-12 | 2021-10-19 | Saudi Arabian Oil Company | Thermal analysis for source rocks |
| WO2021138355A1 (en) | 2019-12-31 | 2021-07-08 | Saudi Arabian Oil Company | Viscoelastic-surfactant fracturing fluids having oxidizer |
| US11339321B2 (en) | 2019-12-31 | 2022-05-24 | Saudi Arabian Oil Company | Reactive hydraulic fracturing fluid |
| US11352548B2 (en) | 2019-12-31 | 2022-06-07 | Saudi Arabian Oil Company | Viscoelastic-surfactant treatment fluids having oxidizer |
| US11473001B2 (en) | 2020-01-17 | 2022-10-18 | Saudi Arabian Oil Company | Delivery of halogens to a subterranean formation |
| US11268373B2 (en) | 2020-01-17 | 2022-03-08 | Saudi Arabian Oil Company | Estimating natural fracture properties based on production from hydraulically fractured wells |
| US11473009B2 (en) | 2020-01-17 | 2022-10-18 | Saudi Arabian Oil Company | Delivery of halogens to a subterranean formation |
| US11365344B2 (en) | 2020-01-17 | 2022-06-21 | Saudi Arabian Oil Company | Delivery of halogens to a subterranean formation |
| WO2021199378A1 (en) * | 2020-04-01 | 2021-10-07 | 日本電信電話株式会社 | Measurement device |
| US11549894B2 (en) | 2020-04-06 | 2023-01-10 | Saudi Arabian Oil Company | Determination of depositional environments |
| US11578263B2 (en) | 2020-05-12 | 2023-02-14 | Saudi Arabian Oil Company | Ceramic-coated proppant |
| US11542815B2 (en) | 2020-11-30 | 2023-01-03 | Saudi Arabian Oil Company | Determining effect of oxidative hydraulic fracturing |
| US12019038B2 (en) | 2021-01-21 | 2024-06-25 | Saudi Arabian Oil Company | Evaluation of source rock samples from subterranean reservoirs |
| US11860087B2 (en) * | 2021-04-02 | 2024-01-02 | The Board Of Trustees Of The University Of Illinois | Method and apparatus for nanoscale infrared absorption tomography |
| WO2023053104A1 (en) * | 2021-10-03 | 2023-04-06 | Imageprovision Technology Private Limited | Method and system for tracking and analysis of particles due to thermal variations |
| US12071589B2 (en) | 2021-10-07 | 2024-08-27 | Saudi Arabian Oil Company | Water-soluble graphene oxide nanosheet assisted high temperature fracturing fluid |
| US12025589B2 (en) | 2021-12-06 | 2024-07-02 | Saudi Arabian Oil Company | Indentation method to measure multiple rock properties |
| US12253467B2 (en) | 2021-12-13 | 2025-03-18 | Saudi Arabian Oil Company | Determining partition coefficients of tracer analytes |
| US11885790B2 (en) | 2021-12-13 | 2024-01-30 | Saudi Arabian Oil Company | Source productivity assay integrating pyrolysis data and X-ray diffraction data |
| US12012550B2 (en) | 2021-12-13 | 2024-06-18 | Saudi Arabian Oil Company | Attenuated acid formulations for acid stimulation |
| US12000278B2 (en) | 2021-12-16 | 2024-06-04 | Saudi Arabian Oil Company | Determining oil and water production rates in multiple production zones from a single production well |
| CN114509110B (en) * | 2022-01-11 | 2023-10-10 | 西安理工大学 | Basin-type insulator stress monitoring system based on digital twin technology |
| JP7844229B2 (en) * | 2022-04-01 | 2026-04-13 | 株式会社ディスコ | Testing method |
| US12385858B2 (en) | 2023-03-10 | 2025-08-12 | Saudi Arabian Oil Company | Evaluating source rock based on time series analysis |
| CN119804549B (en) * | 2024-12-24 | 2025-12-26 | 成都理工大学 | A rock slab clamping device and method for convective heat transfer experiments within cracks |
Family Cites Families (21)
| Publication number | Priority date | Publication date | Assignee | Title |
|---|---|---|---|---|
| US4122719A (en) * | 1977-07-08 | 1978-10-31 | Environmental Systems Corporation | System for accurate measurement of temperature |
| SU1137380A1 (en) * | 1983-02-18 | 1985-01-30 | Куйбышевский ордена Трудового Красного Знамени политехнический институт им.В.В.Куйбышева | Method of calorimetric calibration of device for differential thermal analysis |
| US4636088A (en) * | 1984-05-21 | 1987-01-13 | Therma-Wave, Inc. | Method and apparatus for evaluating surface conditions of a sample |
| JPS61502615A (en) * | 1984-07-03 | 1986-11-13 | オクシデンタル リサ−チ コ−ポレイシヨン | Titanium, hafnium and zirconium group 4B transition metal group passivated metal powder for powder metallurgy and method for producing the same |
| JPS61175557A (en) * | 1985-01-30 | 1986-08-07 | Shimadzu Corp | Heat analyzer |
| DE3736200A1 (en) * | 1987-10-26 | 1989-05-03 | Siemens Ag | METHOD FOR OPERATING A SEMICONDUCTOR GAS SENSOR WORKING ACCORDING TO THE CALORIMETER PRINCIPLE WITH SEVERAL SENSOR ELEMENTS |
| US5080495A (en) * | 1989-08-30 | 1992-01-14 | Mitsui Toatsu Chemicals, Inc. | Method and apparatus for measuring thermal diffusivity by ac joule-heating |
| JP2864628B2 (en) * | 1990-02-28 | 1999-03-03 | 株式会社島津製作所 | Differential differential thermal analyzer |
| US5067820A (en) * | 1990-06-19 | 1991-11-26 | The United States Of America As Represented By The United States Department Of Energy | Radionuclide calorimeter system |
| US5112136A (en) * | 1990-09-24 | 1992-05-12 | Kiyoshi Sakuma | Method of and apparatus for measuring thermal conductivity |
| US5224775C2 (en) * | 1992-03-02 | 2002-04-23 | Ta Instr Inc | Method and apparatus for modulated differential analysis |
| US5248199A (en) * | 1992-03-02 | 1993-09-28 | Ta Instruments, Inc. | Method and apparatus for spatially resolved modulated differential analysis |
| JP2909950B2 (en) * | 1993-09-24 | 1999-06-23 | セイコーインスツルメンツ株式会社 | Thermal analyzer |
| US5441343A (en) * | 1993-09-27 | 1995-08-15 | Topometrix Corporation | Thermal sensing scanning probe microscope and method for measurement of thermal parameters of a specimen |
| US5535614A (en) * | 1993-11-11 | 1996-07-16 | Nok Corporation | Thermal conductivity gas sensor for measuring fuel vapor content |
| US5711604A (en) * | 1993-12-14 | 1998-01-27 | Seiko Instruments Inc. | Method for measuring the coefficient of heat conductivity of a sample |
| US5548113A (en) * | 1994-03-24 | 1996-08-20 | Trustees Of Boston University | Co-axial detection and illumination with shear force dithering in a near-field scanning optical microscope |
| US5549387A (en) * | 1994-06-01 | 1996-08-27 | The Perkin-Elmer Corporation | Apparatus and method for differential analysis using real and imaginary signal components |
| CH690627A5 (en) * | 1995-05-19 | 2000-11-15 | Mettler Toledo Gmbh | Simple differential thermal analysis. |
| US5813763A (en) * | 1996-10-11 | 1998-09-29 | Microcal Incorporated | Ultrasensitive differential microcalorimeter |
| US5806979A (en) * | 1996-11-19 | 1998-09-15 | Iowa State University Research Foundation, Inc. | Calorimetric system and method |
-
1997
- 1997-04-21 US US08/837,547 patent/US6095679A/en not_active Expired - Lifetime
- 1997-04-22 JP JP53789397A patent/JP3229329B2/en not_active Expired - Lifetime
- 1997-04-22 EP EP97919593A patent/EP0834069B1/en not_active Expired - Lifetime
- 1997-04-22 WO PCT/IB1997/000528 patent/WO1997040369A1/en not_active Ceased
- 1997-04-22 CA CA002225315A patent/CA2225315C/en not_active Expired - Lifetime
-
2000
- 2000-06-01 US US09/584,396 patent/US6491425B1/en not_active Expired - Lifetime
Cited By (2)
| Publication number | Priority date | Publication date | Assignee | Title |
|---|---|---|---|---|
| US10054494B2 (en) | 2014-11-26 | 2018-08-21 | International Business Machines Corporation | Temperature sensing |
| US11693028B2 (en) | 2017-11-15 | 2023-07-04 | Kla Corporation | Probe for testing an electrical property of a test sample |
Also Published As
| Publication number | Publication date |
|---|---|
| JPH11509003A (en) | 1999-08-03 |
| US6491425B1 (en) | 2002-12-10 |
| US6095679A (en) | 2000-08-01 |
| WO1997040369A1 (en) | 1997-10-30 |
| EP0834069A1 (en) | 1998-04-08 |
| CA2225315C (en) | 2004-01-27 |
| CA2225315A1 (en) | 1997-10-30 |
| JP3229329B2 (en) | 2001-11-19 |
Similar Documents
| Publication | Publication Date | Title |
|---|---|---|
| US6491425B1 (en) | Method and apparatus for performing localized thermal analysis and sub-surface imaging by scanning thermal microscopy | |
| Hammiche et al. | Scanning thermal microscopy: Subsurface imaging, thermal mapping of polymer blends, and localized calorimetry | |
| Hammiche et al. | Sub-surface imaging by scanning thermal microscopy | |
| Hammiche et al. | Localized thermal analysis using a miniaturized resistive probe | |
| Nelson et al. | Measuring material softening with nanoscale spatial resolution using heated silicon probes | |
| US6200022B1 (en) | Method and apparatus for localized dynamic mechano-thermal analysis with scanning probe microscopy | |
| JP2966691B2 (en) | Method and apparatus for image-like modulation differential analysis | |
| EP0948741B1 (en) | Method and apparatus for high spatial resolution spectroscopic microscopy | |
| Puyoo et al. | Thermal exchange radius measurement: Application to nanowire thermal imaging | |
| Hammiche et al. | Highly localized thermal, mechanical, and spectroscopic characterization of polymers using miniaturized thermal probes | |
| US7448798B1 (en) | Scanning thermal probe microscope | |
| US20090120172A1 (en) | Nanoindentation surface analysis method | |
| US20100042356A1 (en) | Transition temperature microscopy | |
| Reading et al. | Micro‐thermal analysis of polymers: current capabilities and future prospects | |
| Park et al. | Topography imaging with a heated atomic force microscope cantilever in tapping mode | |
| Buzin et al. | Application of a Wollaston wire probe for quantitative thermal analysis | |
| Price et al. | New adventures in thermal analysis | |
| Moon et al. | The principles of micro-thermal analysis and its application to the study of macromolecules | |
| Hammiche et al. | Two new microscopical variants of thermomechanical modulation: scanning thermal expansion microscopy and dynamic localized thermomechanical analysis | |
| Leitgeb et al. | Thermal and spatial resolution in scanning thermal microscopy images: A study on the probe’s heating parameters | |
| Chirtoc et al. | Temperature-dependent quantitative 3ω scanning thermal microscopy: Local thermal conductivity changes in NiTi microstructures induced by martensite-austenite phase transition | |
| US7262066B2 (en) | Systems and methods for thin film thermal diagnostics with scanning thermal microstructures | |
| Cretin et al. | Scanning thermal microscopy | |
| Dawson et al. | Scanning thermal microscopy techniques for polymeric thin films using temperature contrast mode to measure thermal diffusivity and a novel approach in conductivity contrast mode to the mapping of thermally conductive particles | |
| Dinelli et al. | Glass transition measurements on heterogeneous surfaces |
Legal Events
| Date | Code | Title | Description |
|---|---|---|---|
| PUAI | Public reference made under article 153(3) epc to a published international application that has entered the european phase |
Free format text: ORIGINAL CODE: 0009012 |
|
| 17P | Request for examination filed |
Effective date: 19971126 |
|
| AK | Designated contracting states |
Kind code of ref document: A1 Designated state(s): BE DE FR GB |
|
| 17Q | First examination report despatched |
Effective date: 20040323 |
|
| 17Q | First examination report despatched |
Effective date: 20040323 |
|
| GRAP | Despatch of communication of intention to grant a patent |
Free format text: ORIGINAL CODE: EPIDOSNIGR1 |
|
| GRAS | Grant fee paid |
Free format text: ORIGINAL CODE: EPIDOSNIGR3 |
|
| GRAA | (expected) grant |
Free format text: ORIGINAL CODE: 0009210 |
|
| AK | Designated contracting states |
Kind code of ref document: B1 Designated state(s): BE DE FR GB |
|
| REG | Reference to a national code |
Ref country code: GB Ref legal event code: FG4D |
|
| REG | Reference to a national code |
Ref country code: DE Ref legal event code: R096 Ref document number: 69740573 Country of ref document: DE Effective date: 20130523 |
|
| REG | Reference to a national code |
Ref country code: DE Ref legal event code: R082 Ref document number: 69740573 Country of ref document: DE Representative=s name: UEXKUELL & STOLBERG, DE |
|
| REG | Reference to a national code |
Ref country code: GB Ref legal event code: 732E Free format text: REGISTERED BETWEEN 20131017 AND 20131023 |
|
| REG | Reference to a national code |
Ref country code: DE Ref legal event code: R082 Ref document number: 69740573 Country of ref document: DE Representative=s name: UEXKUELL & STOLBERG PARTNERSCHAFT VON PATENT- , DE Effective date: 20131008 Ref country code: DE Ref legal event code: R082 Ref document number: 69740573 Country of ref document: DE Representative=s name: UEXKUELL & STOLBERG, DE Effective date: 20131008 Ref country code: DE Ref legal event code: R081 Ref document number: 69740573 Country of ref document: DE Owner name: WATERS TECHNOLOGIES CORPORATION (N.D.GES.D. ST, US Free format text: FORMER OWNER: TA INSTRUMENTS, INC., NEW CASTLE, DEL., US Effective date: 20131008 Ref country code: DE Ref legal event code: R081 Ref document number: 69740573 Country of ref document: DE Owner name: WATERS TECHNOLOGIES CORPORATION (N.D.GES.D. ST, US Free format text: FORMER OWNER: TA INSTRUMENTS, INC., NEW CASTLE, DEL., US Effective date: 20130327 Ref country code: DE Ref legal event code: R081 Ref document number: 69740573 Country of ref document: DE Owner name: WATERS TECHNOLOGIES CORPORATION (N.D.GES.D. ST, US Free format text: FORMER OWNER: TA INSTRUMENTS, INC., NEW CASTLE, US Effective date: 20131008 Ref country code: DE Ref legal event code: R081 Ref document number: 69740573 Country of ref document: DE Owner name: WATERS TECHNOLOGIES CORPORATION (N.D.GES.D. ST, US Free format text: FORMER OWNER: TA INSTRUMENTS, INC., NEW CASTLE, US Effective date: 20130327 |
|
| REG | Reference to a national code |
Ref country code: FR Ref legal event code: TP Owner name: WATERS TECHNOLOGIES CORPORATION, US Effective date: 20131219 |
|
| PLBE | No opposition filed within time limit |
Free format text: ORIGINAL CODE: 0009261 |
|
| STAA | Information on the status of an ep patent application or granted ep patent |
Free format text: STATUS: NO OPPOSITION FILED WITHIN TIME LIMIT |
|
| 26N | No opposition filed |
Effective date: 20140103 |
|
| REG | Reference to a national code |
Ref country code: DE Ref legal event code: R097 Ref document number: 69740573 Country of ref document: DE Effective date: 20140103 |
|
| REG | Reference to a national code |
Ref country code: FR Ref legal event code: PLFP Year of fee payment: 20 |
|
| PGFP | Annual fee paid to national office [announced via postgrant information from national office to epo] |
Ref country code: DE Payment date: 20160427 Year of fee payment: 20 Ref country code: GB Payment date: 20160427 Year of fee payment: 20 |
|
| PGFP | Annual fee paid to national office [announced via postgrant information from national office to epo] |
Ref country code: BE Payment date: 20160427 Year of fee payment: 20 Ref country code: FR Payment date: 20160425 Year of fee payment: 20 |
|
| REG | Reference to a national code |
Ref country code: DE Ref legal event code: R071 Ref document number: 69740573 Country of ref document: DE |
|
| REG | Reference to a national code |
Ref country code: GB Ref legal event code: PE20 Expiry date: 20170421 |
|
| PG25 | Lapsed in a contracting state [announced via postgrant information from national office to epo] |
Ref country code: GB Free format text: LAPSE BECAUSE OF EXPIRATION OF PROTECTION Effective date: 20170421 |