EP0833878B1 - Method for preparing lubricating oils - Google Patents
Method for preparing lubricating oils Download PDFInfo
- Publication number
- EP0833878B1 EP0833878B1 EP96916493A EP96916493A EP0833878B1 EP 0833878 B1 EP0833878 B1 EP 0833878B1 EP 96916493 A EP96916493 A EP 96916493A EP 96916493 A EP96916493 A EP 96916493A EP 0833878 B1 EP0833878 B1 EP 0833878B1
- Authority
- EP
- European Patent Office
- Prior art keywords
- chemical
- sample
- series
- data
- properties
- Prior art date
- Legal status (The legal status is an assumption and is not a legal conclusion. Google has not performed a legal analysis and makes no representation as to the accuracy of the status listed.)
- Expired - Lifetime
Links
Images

Classifications
-
- G—PHYSICS
- G01—MEASURING; TESTING
- G01N—INVESTIGATING OR ANALYSING MATERIALS BY DETERMINING THEIR CHEMICAL OR PHYSICAL PROPERTIES
- G01N33/00—Investigating or analysing materials by specific methods not covered by groups G01N1/00 - G01N31/00
- G01N33/26—Oils; Viscous liquids; Paints; Inks
- G01N33/28—Oils, i.e. hydrocarbon liquids
- G01N33/2888—Lubricating oil characteristics, e.g. deterioration
-
- G—PHYSICS
- G01—MEASURING; TESTING
- G01N—INVESTIGATING OR ANALYSING MATERIALS BY DETERMINING THEIR CHEMICAL OR PHYSICAL PROPERTIES
- G01N33/00—Investigating or analysing materials by specific methods not covered by groups G01N1/00 - G01N31/00
- G01N33/26—Oils; Viscous liquids; Paints; Inks
- G01N33/28—Oils, i.e. hydrocarbon liquids
- G01N33/2829—Mixtures of fuels
-
- C—CHEMISTRY; METALLURGY
- C10—PETROLEUM, GAS OR COKE INDUSTRIES; TECHNICAL GASES CONTAINING CARBON MONOXIDE; FUELS; LUBRICANTS; PEAT
- C10G—CRACKING HYDROCARBON OILS; PRODUCTION OF LIQUID HYDROCARBON MIXTURES, e.g. BY DESTRUCTIVE HYDROGENATION, OLIGOMERISATION, POLYMERISATION; RECOVERY OF HYDROCARBON OILS FROM OIL-SHALE, OIL-SAND, OR GASES; REFINING MIXTURES MAINLY CONSISTING OF HYDROCARBONS; REFORMING OF NAPHTHA; MINERAL WAXES
- C10G2400/00—Products obtained by processes covered by groups C10G9/00 - C10G69/14
- C10G2400/10—Lubricating oil
-
- G—PHYSICS
- G01—MEASURING; TESTING
- G01N—INVESTIGATING OR ANALYSING MATERIALS BY DETERMINING THEIR CHEMICAL OR PHYSICAL PROPERTIES
- G01N1/00—Sampling; Preparing specimens for investigation
- G01N1/02—Devices for withdrawing samples
- G01N1/10—Devices for withdrawing samples in the liquid or fluent state
- G01N1/16—Devices for withdrawing samples in the liquid or fluent state with provision for intake at several levels
-
- G—PHYSICS
- G01—MEASURING; TESTING
- G01N—INVESTIGATING OR ANALYSING MATERIALS BY DETERMINING THEIR CHEMICAL OR PHYSICAL PROPERTIES
- G01N1/00—Sampling; Preparing specimens for investigation
- G01N1/02—Devices for withdrawing samples
- G01N1/10—Devices for withdrawing samples in the liquid or fluent state
- G01N1/20—Devices for withdrawing samples in the liquid or fluent state for flowing or falling materials
- G01N1/2035—Devices for withdrawing samples in the liquid or fluent state for flowing or falling materials by deviating part of a fluid stream, e.g. by drawing-off or tapping
Definitions
- This invention relates to a method for preparing lubricating oils by predicting performance, perceptual, chemical or physical properties of streams entering or exiting units in the lubes manufacturing process using a combination of gas chromatography and mass spectrometry.
- Refineries and chemical plants typically control processing of various component streams and certain additives through the use of both on-line analyzers and off-line laboratory analyses to provide quality information. These quality parameters (chemical composition, physical or perceptual or performance properties) are then fed back into a process control computer which contains control software or algorithms which control refinery or chemical plant hardware (distillation towers or proportional flow control valves).
- the control programs are typically executed more than three times per hour and their output is used to control either processes or proportional flow valves to vary the quality of the finished product which can either go to tankage or directly to pipelines and terminals, trucks, or to ship-loading facilities. Multiple on-line analyzers are typically required for this process control.
- Gas chromatograph has been used to predict physical and performance properties of hydrocarbon mixtures boiling in the gasoline range.
- Crawford and Hellmuth, Fuel, 1990, 69, 443-447 describe the use of gas chromatography and principal components regression analysis to predict the octane values for gasolines blended from different refinery streams.
- Japanese laid-open patent application JP 03-100463 relates to a method of estimating the cetane number for fuel oils by separating an oil sample into its components using gas chromatography, measuring the signal strength of ion intensities at characteristic masses in the mass spectrum, and correlating these ion intensities to cetane number using multiple regression analysis.
- Combined gas chromatography/mass spectrometry (GS/MS) analysis has been done on crude oils.
- U.S. Patent 5,119,315 discloses a method for aligning sample data such as a mass chromatogram with reference data from a known substance. Williams et al, 12th European Assoc. Organic Geochem., Organic Geochem. Int. Mtg. (Germany 09/16-20/85); Organic Geochemistry 1986, Vol. 10 (1-3) 451-461, discusses the biodegradation of crude oils as measured by GC/MS analysis.
- This invention relates to a process for controlling the manufacture of lubricating oils from a feed having a boiling point of about 350°C or greater by the steps of introducing the feed into a distillation unit, separating the feed into light, medium and heavy distillates, introducing the distillates into an extraction unit, extracting the distillates to produce raffinates, introducing the raffinates into a dewaxing unit and dewaxing the raffinates to produce lubricating oils, said process comprising:
- Another embodiment of the invention relates to a method for controlling or monitoring chemical or refinery processes which utilize feedstocks and/or produce products having boiling points greater than about 350°C which comprises:
- the gas chromatography/mass spectrometry (GC/MS) method described above can be used to rapidly predict a wide range of perceptual, performance, chemical and/or physical properties of complex mixtures such as intermediate streams in the lubes manufacturing process and lubricating oil products. Such properties include distillation characteristics, pour point, density, aniline point, feed stock quality, cloud point, haze, viscosity and the like as well as specific chemical constituents.
- the multivariate correlation methods can also treat the collinear data generated by the GC/MS analyses.
- Figure 1 is a schematic flow diagram of a manufacturing process for a lube oil.
- the typical lubricating oil manufacturing process involves a distillation unit, an extraction unit, a dewaxing unit and optionally, a hydrofining unit.
- the lubricating oil products are commonly used as base stocks for producing finished oils or may be specialty products such as transformer oils and agricultural oils.
- FIG 1 is a schematic flow diagram showing an on-line manufacturing process.
- Feed stocks 10 are complex hydrocarbon mixtures such as crudes or heavy distillate streams.
- the feedstock is fed to distillation unit 20 through line 12.
- Feedstock may be sampled through sampling port 14 which is connected to sampling line 16 interrupted by valve 18.
- Distillation unit 20 is typically a pipestill which distills the feed stock into a plurality of distillation cuts. For purposes of simplicity, these distillation cuts are shown exiting unit 20 as line 22n which represents a plurality of lines where n is the number of distinct distillation cuts. Each of the lines 22n may be sampled through sampling ports 24n which are connected to sampling lines 26n interrupted by valves 28n.
- the distillate cuts are fed to extraction unit 30 where they are extracted using solvents such as phenol, N-methylpyrrolidone and the like.
- solvents such as phenol, N-methylpyrrolidone and the like.
- the extraction process results in raffinates and bottoms. Again for purposes of simplicity, these raffinates are shown exiting the extraction unit 30 as a single line 32n which represents a plurality of lines where n is the number of different raffinate extracts.
- Each of the lines 32n may be sampled through sampling ports 34n which are connected to sampling lines 36n interrupted by valves 38n.
- the raffinate extracts are usually stripped of solvent in a stripping unit (not shown) prior to entering a dewaxing unit 40. through sampling ports 44n which are connected to sampling lines 46n interrupted by valves 48n.
- the dewaxed raffinates exiting unit 40 through lines 42n may be used as lubricating oils (following removal of dewaxing aid). Typical examples of such lube oils are known as light neutrals, heavy neutrals, bright stocks and the like. These lube oils may be sampled for product quality through sampling ports 44n connected to sampling lines 46n interrupted by valves 48n. These lube oils may optionally be subjected to a hydrofinishing step in a hydrofiner unit 50. Hydrofiners use catalysts and conditions well known in the art.
- the hydrofinished oils may be sampled through sampling ports 54m connected to sampling lines 56m interrupted by valves 58m.
- sampling manifold 60 Each of lines 16, 26n, 36n, 46n and 56m are connected to sampling manifold 60.
- Sampling manifold 60 also includes an optional provision for at-line operation wherein a remote location 70 is connected to the sampling manifold 60 through line 62 interrupted by valve 66 and sampling port 64.
- Sampling manifold 60 is a central location where all samples to be analyzed are gathered prior to GC/MS analysis.
- Manifold 60 can be purged by sample to be analyzed to remove contaminants and purged material recycled through line 72 interrupted by valve 74.
- Sample to be analyzed is fed through line 76 to sample injection valve 80.
- Injection valve 80 can likewise be purged by sample to be analyzed through line 82 interrupted by valve 84.
- sample manifold 60 and sample injection valve 80 are purged, sample to be analyzed is injected into GC/MS analyzer.
- Samples from off-line operation can be directly injected through valve 80. Off-line samples are those collected at remote locations and brought to a central facility for analysis.
- the raw data generated by GC/MS analyzer 90 is fed to computer 100. Spent sample and purging materials are sent to recycle through line 92 interrupted by valve 94.
- Computer 100 mathematically treats raw GC/MS data.
- Output from computer 100 is then fed as an electronic signal through line 102 to control computer 110.
- Control computer 110 is connected through line 112 to units 20, 30, 40 and 50 and controls operating conditions within said units 20, 30, 40 and 50. The operating conditions in turn controls the quality of lube oil product exiting unit 40 and/or 50.
- the operation of the GC/MS analyzer 90 and computer 100 is described in further detail as follows.
- the feedstock, distillate cuts and lubricating oil products are all complex hydrocarbon mixtures involving thousands of individual chemical species.
- the use of GC/MS to analyze such complex mixtures for chemical and physical properties involves the generation of large amounts of collinear data. Multiple regression analysis may be employed for treating normal linear data. However, this type of analysis cannot be used for collinear data.
- the process according to the invention involves a means for predicting chemical, performance, perceptual and physical properties of feedstock, distillates, raffinates and lubricating oils by quantitative identification of components using a combination of retention times from a GC analysis coupled with target fragment and/or molecular ions produced by the MS.
- the MS information is compared against a set of known properties from reference samples which form a training set. By mathematically comparing the experimental data with that of the training set, one may predict the desired properties of other feedstocks, distillates, raffinates and lubricating oils.
- GC/MS utilizes a gas chromatograph interfaced with a mass spectrometer. While a chromatographic method such as supercritical fluid chromatography, liquid chromatography or size exclusion chromatography may be used to separate the mixture into components or mixtures of components, gas chromatography, especially capillary gas chromatography is the preferred means for interfacing with a mass spectrometer. Both GC and MS use computer software for instrument control, data acquisition and data reduction. The computer platform should be capable of acquiring at least 2000 mass spectra in about 7 minutes.
- the sample mixture to be analyzed is first injected into a GC where the mixture components are separated as a function of retention time, often on the basis of boiling points. Only partial chromatographic resolution of mixture components is necessary.
- the GC oven temperature is usually programmed for samples with a wide boiling range. Separated components may also be identified by a detector such as a flame ionization detector, atomic emission detector, thermal conductivity detector or electron capture detector.
- the separated or partially separated components are then transferred to the mass spectrometer under dynamic flow conditions. Since a GC operates under atmospheric pressure and a MS under vacuum condition (about 10 -3 kPa), the instrument interface requires a coupling device such as a molecular separator (e.g., jet, membrane, etc.), open split coupler or capillary direct interface to efficiently transfer sample while minimizing carrier gas effects.
- a coupling device such as a molecular separator (e.g., jet, membrane, etc.), open split coupler or capillary direct interface to efficiently transfer sample while minimizing carrier gas effects.
- the mixture may be introduced directly into a MS using a direct insertion probe without a prior GC separation step.
- Other thermal separation techniques not involving a GC may be used to introduce the sample into the mass spectrometer.
- MS sample molecules are bombarded with high energy electrons thereby creating molecular ions which fragment in a pattern characteristic of the molecular species involved.
- a continuous series of mass spectra are obtained over a scan range of at least 10 to at least 800 daltons.
- the mass spectral data may also be acquired under selected ion monitoring (SIM) mode. In the selected ion mode, care must be taken to select ions representative of the components of interest and to operate under repeatable conditions.
- SIM selected ion monitoring
- a variety of MS instruments may be used including low resolution, high resolution, MS/MS (hybrid, triple quadrupole, etc.), ion cyclotron resonance and time of flight.
- Any ionization technique may be used, such as electron ionization, chemical ionization, multiphoton ionization, field desorption, field ionization, etc., provided that the technique provides either molecular or fragment ions which are suitable for use in the analysis procedure.
- the results of sample analysis are a series of l mass spectra.
- the mass spectra are divided into n time intervals where n is an integer from 1 to l.
- At least one diagnostic ion is chosen from each of m time intervals where m is an integer from 1 to n.
- the term "diagnostic ion” refers to an ion which is representative of a compound, a chemical class or a performance, perceptual or physical property correlated thereto. Regardless of whether mass spectra are obtained in the scan or selected ion monitoring mode, it is important that the mass spectra be obtained under repeatable conditions.
- the mass range covered during acquisition should be sufficient to provide acquisition of all of the ions which could be used as diagnostic ions during mathematical treatment of each mass spectral scan. If the mass spectral data are acquired in the selected ion monitoring mode, then care must be taken that the ions selected for monitoring are suitable for use in measuring the components of interest.
- sample mass spectral data are then compared to mass spectral data from a series of reference samples with known performance, perceptual, physical and/or chemical properties.
- There are commercially available computer programs for such data alignment for example, Hewlett-Packard GC/MS software G 1034C version C.01.05.
- the reference mass spectral data, and associated properties data are arranged in matrix form for mathematical treatment as described below.
- one matrix is formed of reference sample ion intensities at given masses and the other matrix contains known ion intensities for molecular fragment ions of known components.
- the training set for chemical composition data is thus made up of mass spectral data for different components characteristic of compounds or molecular series expected to be found in the sample mixtures. Similar training sets can be formed for other chemical or perceptual or performance or physical properties of interest. These training sets form one block or matrix of data (Y-block or properties matrix).
- the actual sample mass spectral data (which may have been time aligned) form the other block (X-block) or matrix of data.
- PLS/PCR/RR are described in the literature, e.g., Wold S., A. Oxford, H. Wold, and W. J. Dunn, "The Collinearity Problem in Linear Regression. The Partial Least Squares (PLS) Approach to Generalized Inverses", SIAM J. Sci. Stat. Comput., 1984 5(3), 735-743, or Geladi P., and B. R. Kowalki, "Partial Least Squares Regression: A tutorial", Anal. Chem. Acta, 1986, 185, 1-17, or Hökuldsson A., "PLS Regression Methods", J.
- Chemometrics 1988, 2, 211-228, or in many other articles in journals such as the Journal of Chemometrics or Intelligent Laboratory Systems; Frank, I., and J. Friedman, "A Statistical View of Some Chemometrics Regression Tools", Technometrics, 1993, Vol. 35, No. 2; Jackson, J. E., “A User's Guide to Principal Components”, Wiley-Interscience, New York, 1991; Montogomery, D.C. and E. A. Peck, "Introduction To Linear Regression Analysis", Wiley-Interscience, New York, 1990; and Martens, H., and T. Naes, “Multivariable Calibration", Wiley-Interscience, New York, 1989.
- feed stocks and lube oils contain a wide range of compound types such as paraffins, cycloparaffins, aromatics, and olefins. It is known that paraffinic hydrocarbons yield fragment ions at masses 43, 57, 71, 85,...daltons, and these masses may be used as diagnostic of this class of compounds.
- training sets for other chemical, performance, perceptual or physical properties may be developed by correlating compositional data with other properties of interest, e.g., distillation characteristics, viscosities and viscosity index, volatility, refractive index and the like.
- properties of interest e.g., distillation characteristics, viscosities and viscosity index, volatility, refractive index and the like.
- the result of a mathematical treatment such as PLS/PCR/RR of the training set is a set of coefficients for the properties of interest.
- the method for predicting the physical or chemical properties of a complex hydrocarbon mixture is demonstrated in this example using density at 15°C as the specific property for purposes of illustration.
- the method is generally applicable to a range of other physical properties as well as performance or perceptual or chemical properties of such mixtures.
- the initial consideration is to establish a set of standard GC/MS operating parameters so that the GC/MS analytical data used for predicting properties is obtained under consistent operating conditions.
- the GC/MS instrument used in this example is a Hewlett-Packard 5972 Mass Selective Detector interfaced to a Hewlett Packard 5890 Series II Gas Chromatograph fitted for use with microbore columns.
- GC/MS operating conditions are summarized in Table 1.
- Table 1 GC Conditions Column Phenyl Silicone (such as HP-5) 10m x 0.1 mm, 17 micron film thickness Temperature Program Initial Temperature (°C) 180 Initial Time (minutes) 0 Program Rate (°C/min) 15 Final Temperature (°C) 310 Final Time (minutes) 5.33 Pressure Program Initial Pressure (psi) 30 Initial Time (minutes) 0 Program Rate (psi/minute) 4 Final Pressure (psi) 80 Final Time (minutes) 10 Carrier Gas Helium Linear Velocity 25.6 Injection Port Temperature (°C) 300 Injection Volume ⁇ L 0.5 Split Ratio 500:1 Column Head Press, kPa Approx. 260 Interface Temperature (°C) 310 Mass Spectrometer Conditions Ionization Mode Electron Ionization, 70 eV nominal Cycle Time (minutes) 0.003
- a data treatment method should be selected prior to obtaining raw GC/MS data.
- Two types of data treatments which may be used are either Chemist's Rules or Hydrocarbon Compound Type Analysis as described, for example, in Robinson, C.J., "Low Resolution Mass Spectrometric Determination of Aromatics and Saturates in Petroleum Fractions", Analytical Chemistry, 1971, 43(11), pp. 1425-1434.
- Chemist's Rules involve two separate sections: (1) a calibration section to correct retention times, i.e., the time between zero and the time when a given peak occurs; and (2) the actual Rules which are based on a selected series of masses corresponding to prominent compounds or molecular series expected for the type of hydrocarbon mixture under investigation. These compounds or compound types are selected on the basis that they have prominent molecular and/or fragment ions unique to that compound or molecular series.
- a portion of the Chemist's Rules are shown in Table 2.
- a full set of Chemist's Rules are shown in its entirety following Example 4.
- a reference retention time is then determined for each mass spectral ion grouping selected for use in the Chemist's Rules for each of the selected molecular types or molecules identified in Table 2. Such corrections are necessary due to slight shifts in retention times which may result from column degradation, column head pressure fluctuations, changes in column carrier gas linear velocity, or minor fluctuations in the GC column oven temperatures or other causes.
- the calibration step generates a series of correction factors for the entire GC/MS data file. There are commercially available programs which will perform retention time corrections. The results of applying such corrections are shown in Table 3.
- the actual Rules are then determined.
- a total of 178 Rules is used based on compound or compound series identification.
- a set of characteristic mass numbers are determined. These characteristic mass numbers can range from 1 to n, where n is an integer representing the entire mass range scanned or the number of selected ions being monitored. In this case, six characteristic mass numbers are illustrated.
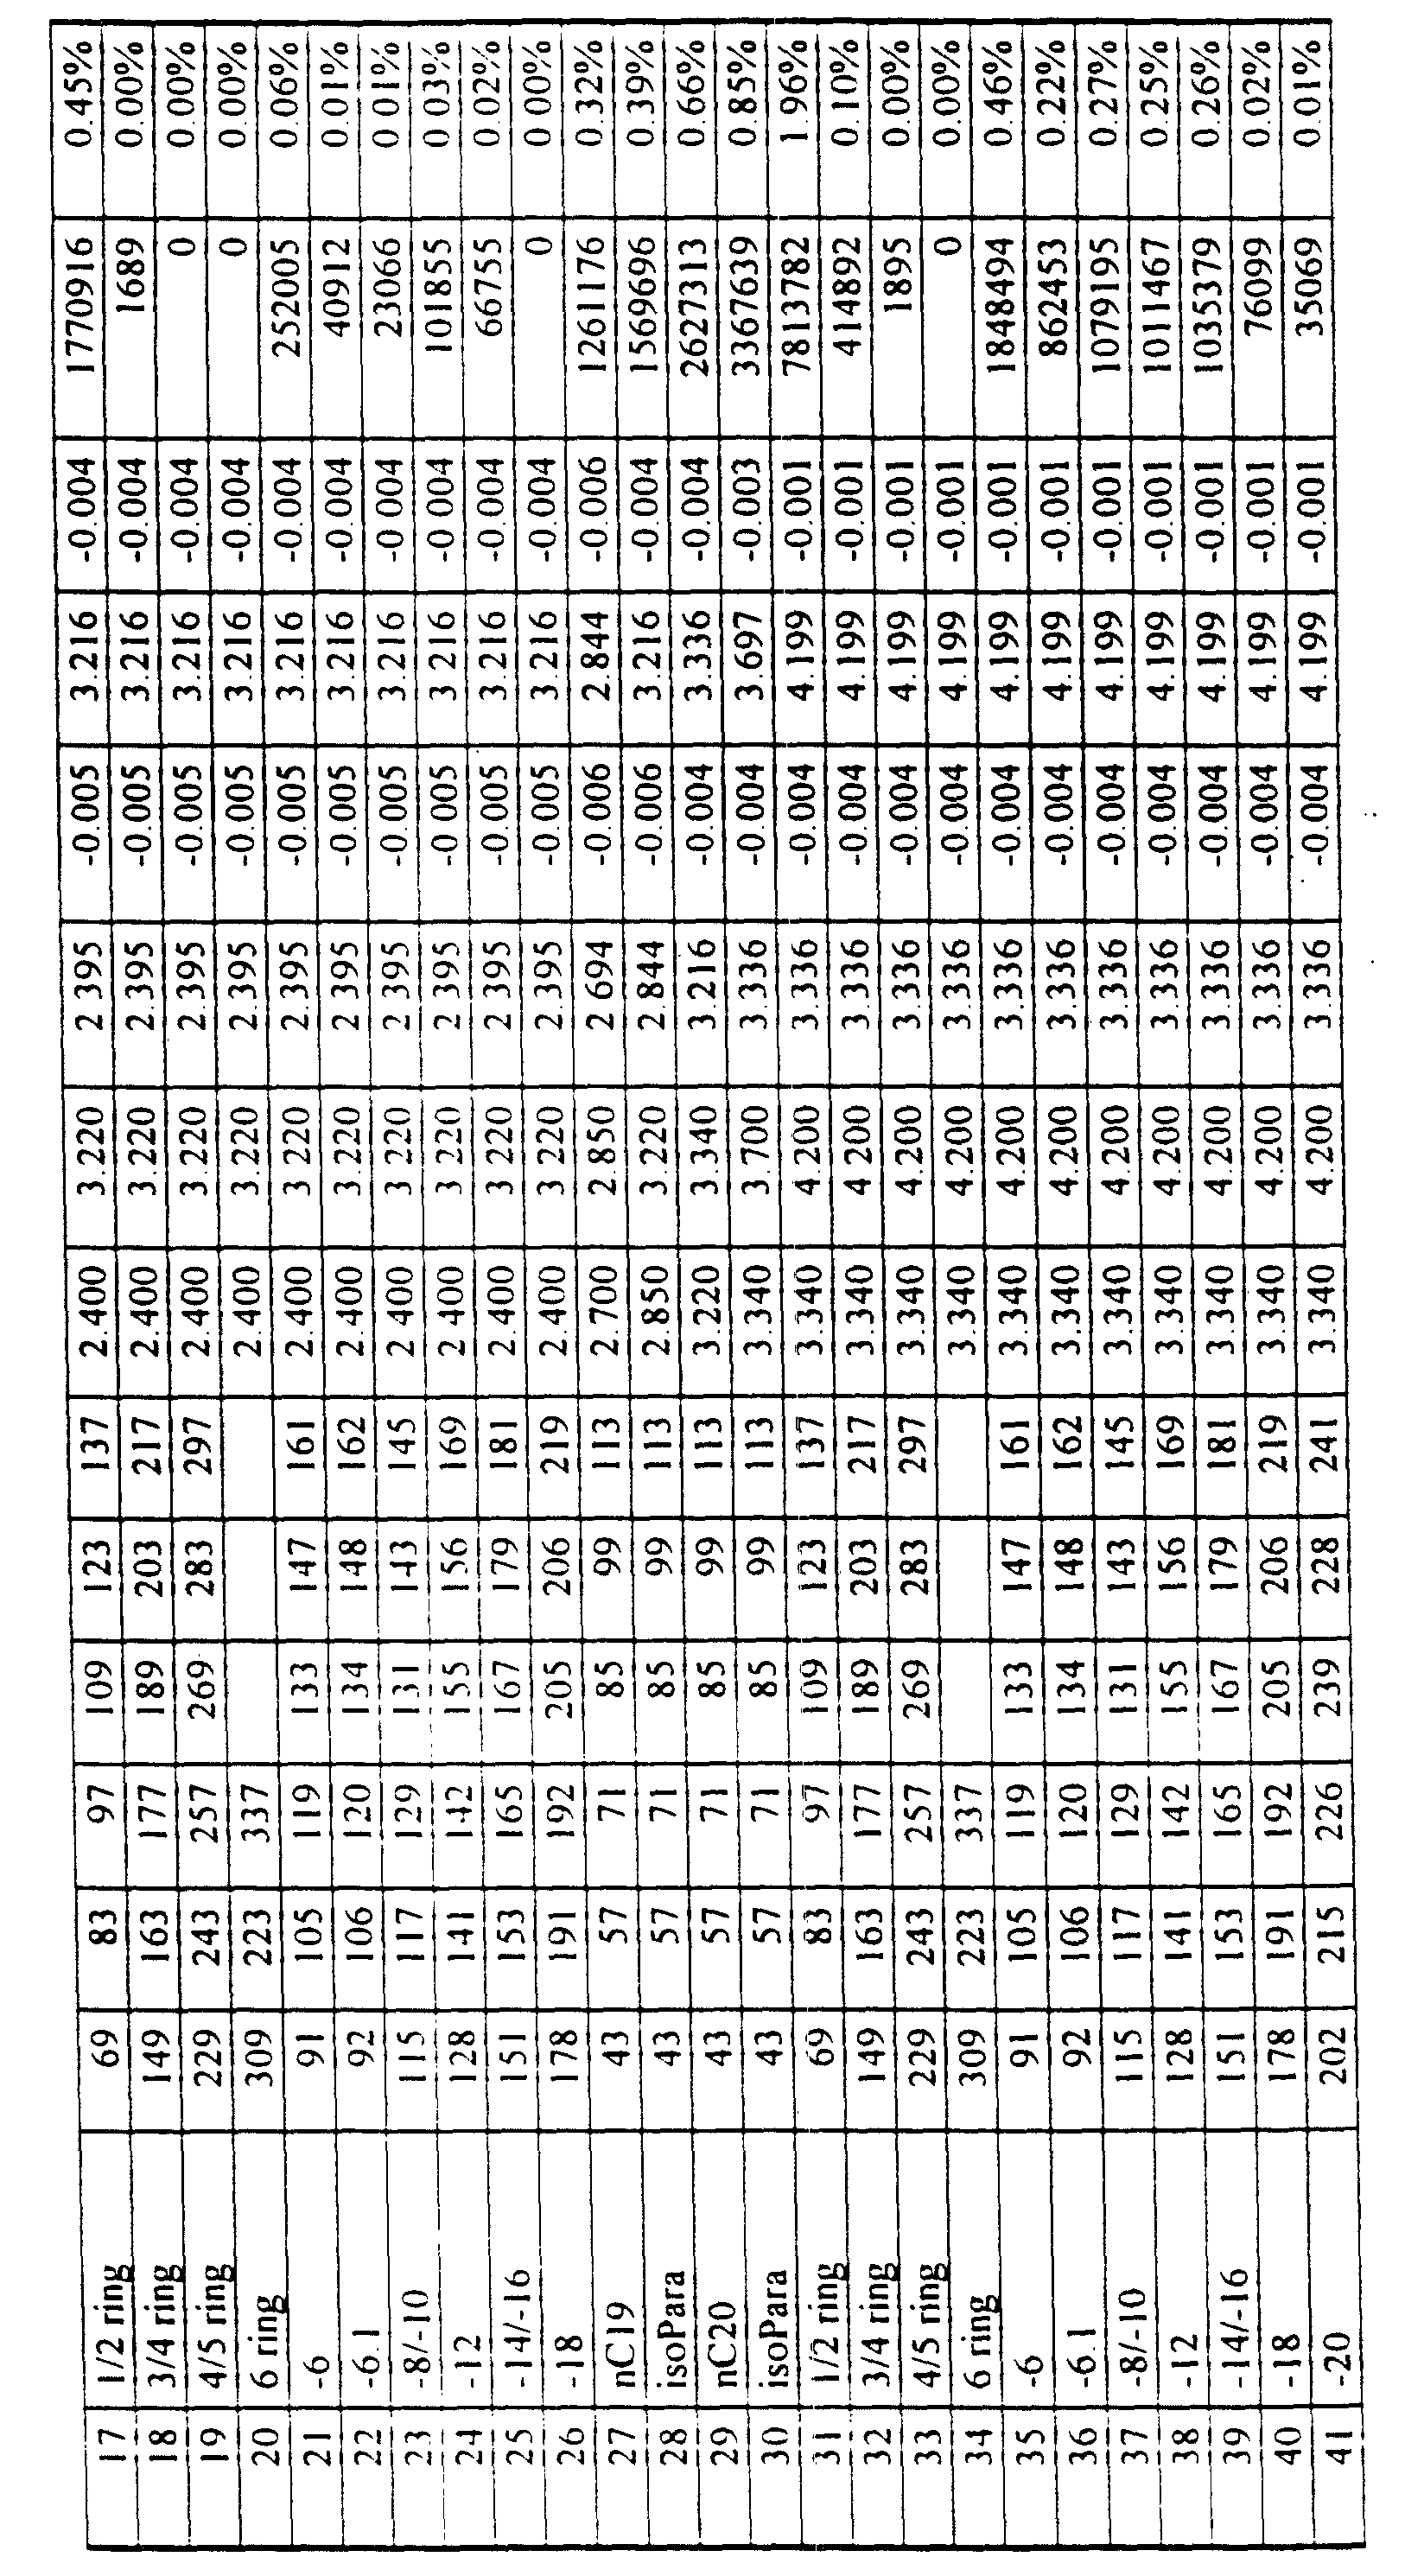
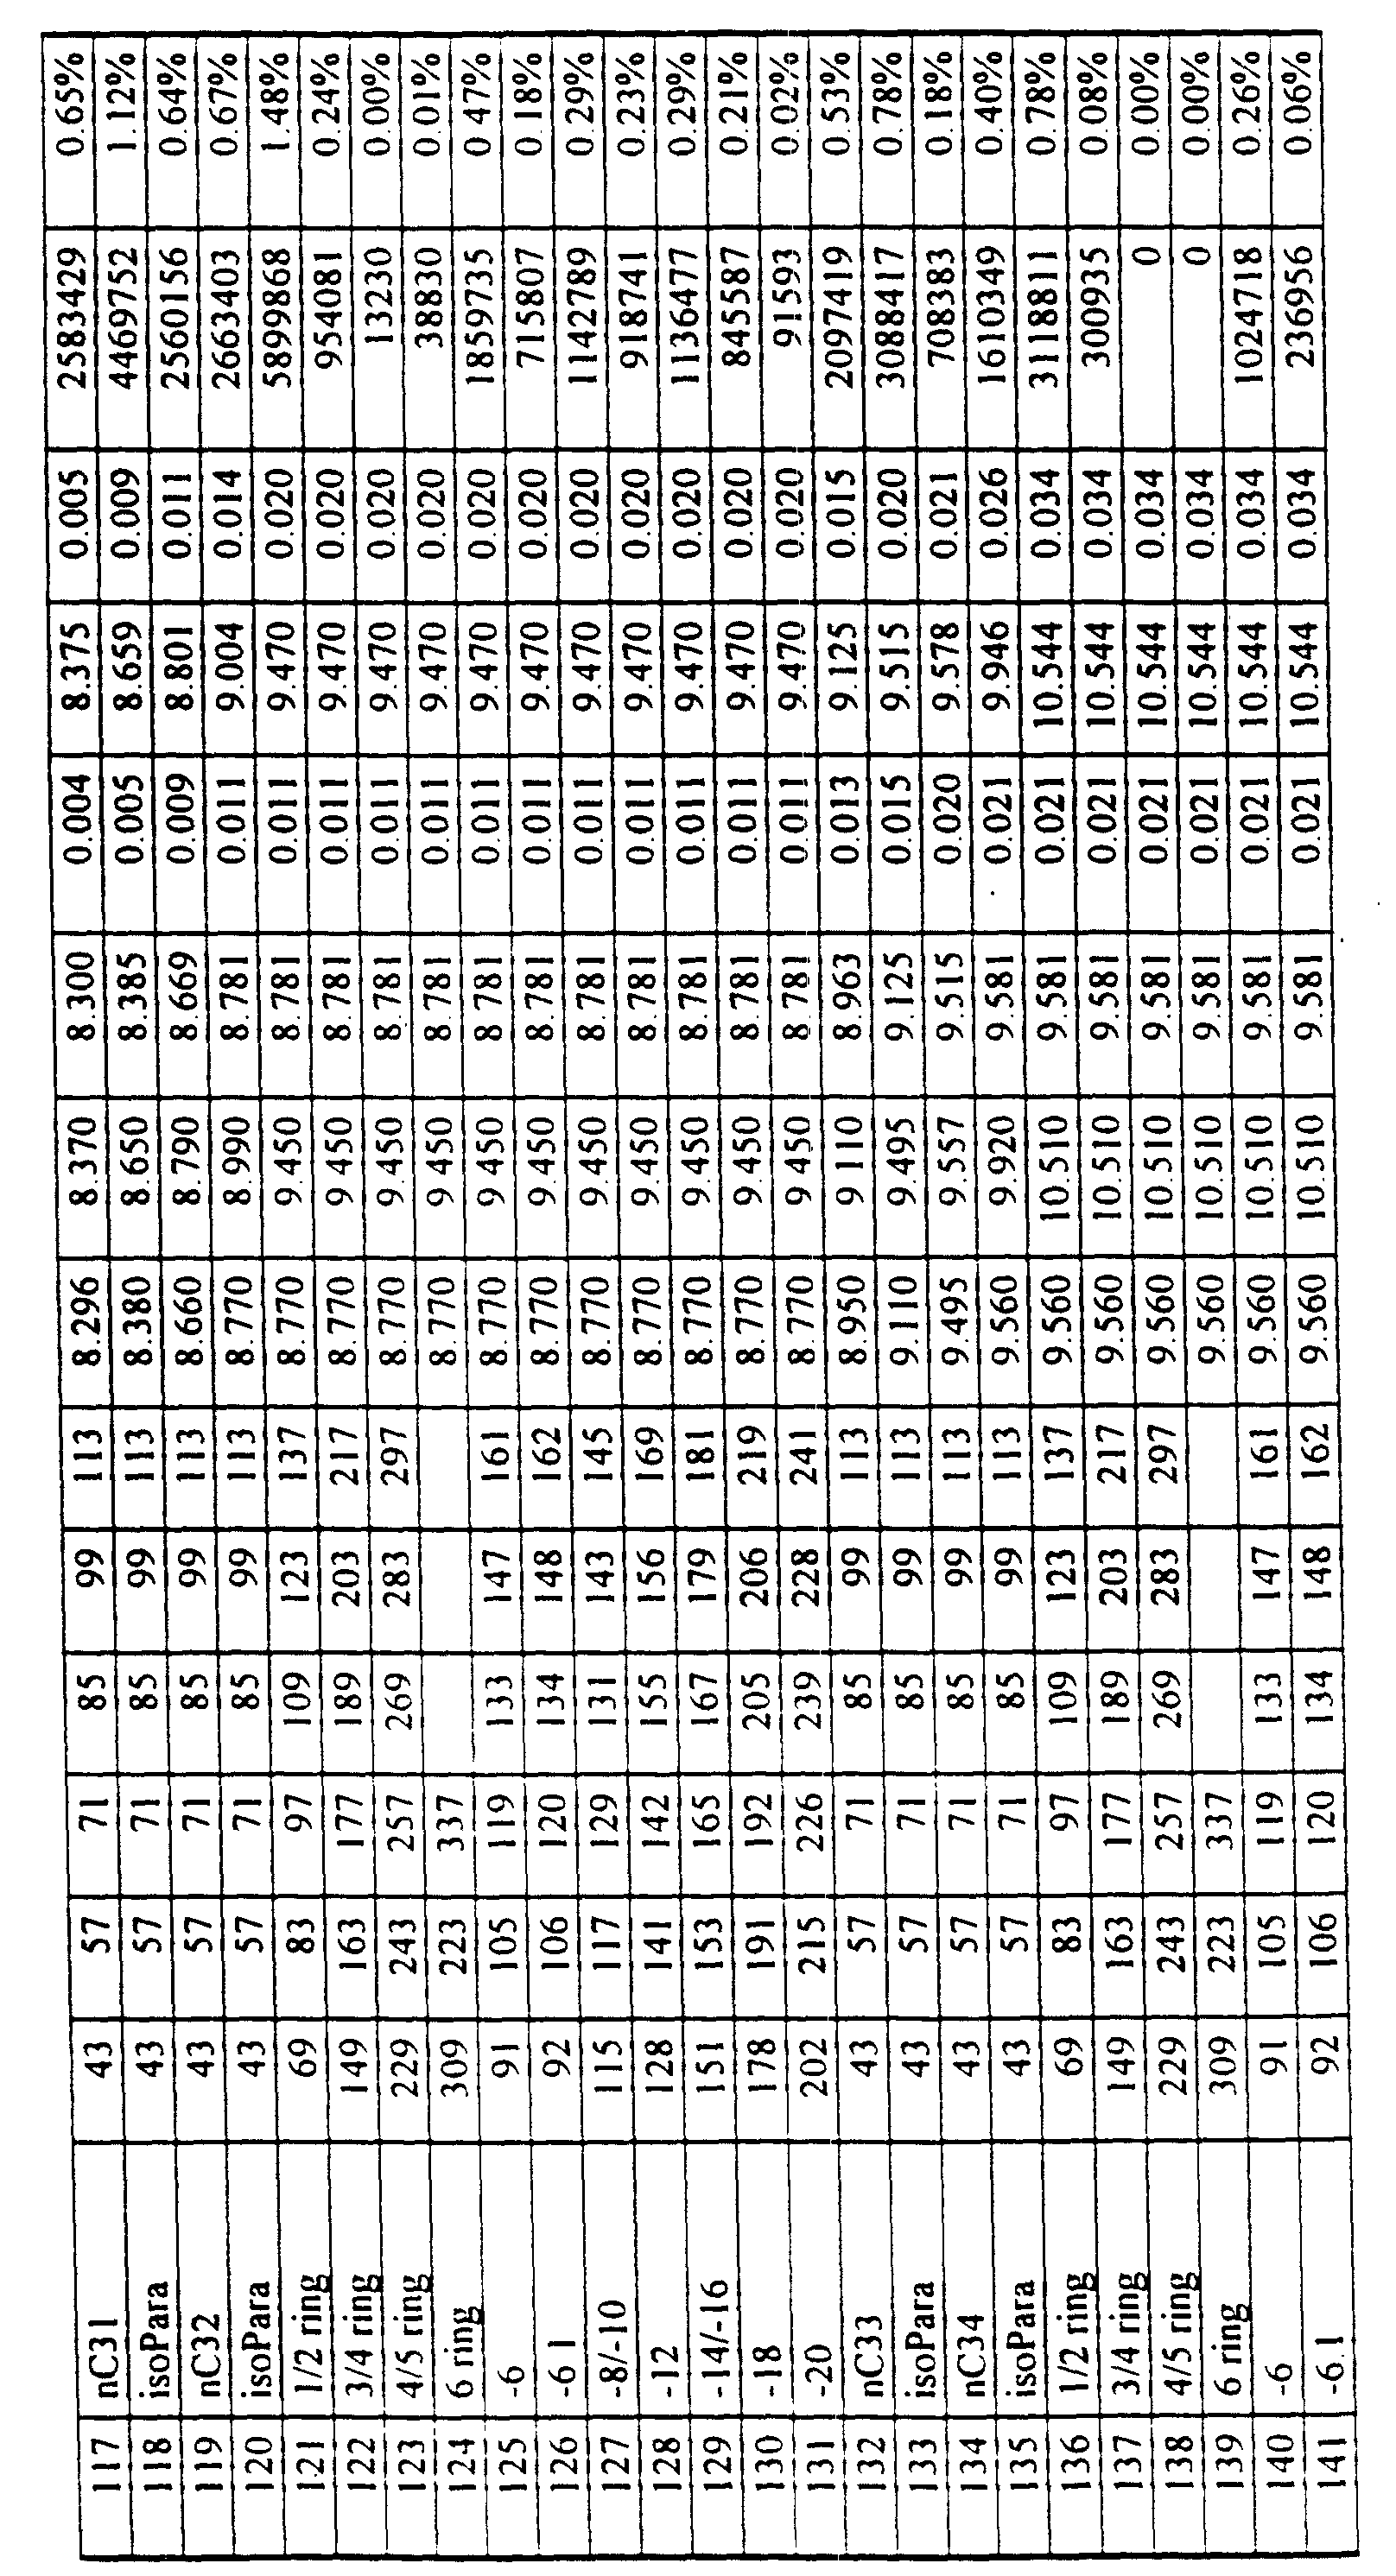
- the ion intensities of the masses for each Rule are summed within the upper and lower retention time limits for that rule. The results are shown for a sampling of the 178 Rules in Table 4 for this demonstration analysis. A full set of rules is shown in its entirety following Example 4.
- PLS/PCR/RR are numerical analysis techniques for detecting and formulating a mathematical structure (model) within a data set comprising observations associated with multiple objects. Each object has associated without observations for multiple variables, the latter being common to all objects. These multiple variables are assigned into two categories, known as X-block and Y-block (GC/MS data in this case). Observations associated with all variables in the X-block are realized from a common process. Observations associated with variables in the Y-block (known properties in this case) are realized from processes that may be different for each variable.
- the data set used to construct this mathematical model is referred to as the model calibration data set.
- PLS/PCR/RR The common use of PLS/PCR/RR is to apply the model developed from the calibration data set to X-block observations realized for new objects (not in the calibration data set) to predict values for the corresponding variables in the Y-block for these new objects, without having to execute the Y-block processes used in the calibration data set.
- diagnostics that are simultaneously generated by the PLS/PCR/RR model, assessment of whether the new objects can be adequately described by the model, and whether the model is used in an extrapolation mode versus interpolation mode can be performed.
- PLS/PCR addresses the collinearity features in the X-block and Y-block, by suitably reducing the dimensionality in both X- and Y-blocks (for PLS), and X-block only (for PCR) to form the model.
- Collinearity is a term referring to the existence of relationships between variables within the block itself.
- a number of independent dimensions in the X- and Y- blocks are identified by forming pseudo-variables known as principal components or latent vectors through different sets of linear combinations of original variables in each block. Each set of such combinations constitutes an independent dimension. It comprises a set of coefficients that each value associated with each variable in the block is to be weighted by to arrive at the new value for this dimension.
- the values for the new, reduced dimensions in the Y-block are regressed onto their counterparts in the new, reduced dimensions of the X-block to arrive at the most parsimonious dimension size (number of latent vectors) and their associated weights, with the final goal of one linear equation generated to permit prediction of Y-block variables using X-block variables.
- the number of dimensions used to construct the model is determined through optimization of a criterion known as PRESS (Prediction Error Sum of Squares), cumulated by a Cross Validation (CV) technique using the training data set, and, following the general model parsimony principle.
- the number of independent dimensions in the X-block are first selected and identified in a similar fashion as in PLS by forming principal components. Then, for each variable in the Y-block, a model is obtained by performing ordinary multiple linear regression using the Principal Components as "Prediction Variables".
- Lambda Matrix is added to the Covariance Matrix of the X-block with the net effect of stabilizing the numerical computation needed to obtain the model coefficients.
- the selection of Lambda values is through optimization of PRESS criterion using cross validation of the training set.
- the Chemist's Rule data for the various reference samples derived from GC/MS analysis form the X-block variables.
- PLS/PCR/RR treatment may require preliminary reorganization of the X-block data, such as transposition and removal of redundant data and constants or mathematical transformations.
- the Y-block variables are the property (or properties) to be predicted, and may also require mathematical transformations such as logarithmic or geometric, as well as reorganization.
- the data blocks may be represented by:
- the Y-block may be a single observation per set of Chemist's Rules as shown above, or it may be a n x m matrix of observations where there are m different properties to be predicted.
- the results of PLS treatment of the training set data are a series of coefficients.
- Raw GC/MS data from an unknown sample (or samples) are then treated by the Chemist's Rules first to correct the retention times and then to form the ion summations.
- Each value for the Chemist's Rule ion summation result is then multiplied by the training set coefficients and summed to generate the prediction of the desired property.
- Table 5 illustrates the quality of the predicted density values for both the training set and the unknown test set for density at 15°C. Predicted vs. Measured Waxy Raffinate Density Values @ 15°C (g/ml).
- Example 1 The procedure of Example 1 was repeated for predicting refractive index @ 75°C for the suite of 150N grade waxy raffinates. The same 22 samples were used for the training set, while the remaining five samples were used as a test set. The results for the refractive index at 75°C are summarized in Table 6. Predicted vs.
- Example 1 The procedure of Example 1 was repeated for predicting viscosity at 100°C for 150N grade waxy raffinates. The same 22 samples were used for the training set, while the remaining five samples were used as a test set. The results for density prediction are summarized in Table 7. Predicted vs.
- Example 1 The procedure of Example 1 was repeated for predicting weight percent wax content for 150N grade waxy raffinates. The same 22 samples were used for the training set, while the remaining five samples were used as a test set. The results for density prediction are summarized in Table 8. Predicted vs.
- the subject method can also be applied for predicting properties of other types of complex hydrocarbon mixtures in similar boiling ranges, such as catalytic cracker feedstock quality, feed to extraction or dewaxing units, feedstocks to distillation or stripping towers, and to blending considerations.
Landscapes
- Chemical & Material Sciences (AREA)
- Health & Medical Sciences (AREA)
- Engineering & Computer Science (AREA)
- Life Sciences & Earth Sciences (AREA)
- Medicinal Chemistry (AREA)
- Biochemistry (AREA)
- General Chemical & Material Sciences (AREA)
- Food Science & Technology (AREA)
- Chemical Kinetics & Catalysis (AREA)
- Physics & Mathematics (AREA)
- Analytical Chemistry (AREA)
- Oil, Petroleum & Natural Gas (AREA)
- General Health & Medical Sciences (AREA)
- General Physics & Mathematics (AREA)
- Immunology (AREA)
- Pathology (AREA)
- Other Investigation Or Analysis Of Materials By Electrical Means (AREA)
- Lubricants (AREA)
Abstract
Description
- This invention relates to a method for preparing lubricating oils by predicting performance, perceptual, chemical or physical properties of streams entering or exiting units in the lubes manufacturing process using a combination of gas chromatography and mass spectrometry.
- Refineries and chemical plants typically control processing of various component streams and certain additives through the use of both on-line analyzers and off-line laboratory analyses to provide quality information. These quality parameters (chemical composition, physical or perceptual or performance properties) are then fed back into a process control computer which contains control software or algorithms which control refinery or chemical plant hardware (distillation towers or proportional flow control valves). The control programs are typically executed more than three times per hour and their output is used to control either processes or proportional flow valves to vary the quality of the finished product which can either go to tankage or directly to pipelines and terminals, trucks, or to ship-loading facilities. Multiple on-line analyzers are typically required for this process control.
- Gas chromatograph has been used to predict physical and performance properties of hydrocarbon mixtures boiling in the gasoline range. Crawford and Hellmuth, Fuel, 1990, 69, 443-447, describe the use of gas chromatography and principal components regression analysis to predict the octane values for gasolines blended from different refinery streams. Japanese laid-open patent application JP 03-100463 relates to a method of estimating the cetane number for fuel oils by separating an oil sample into its components using gas chromatography, measuring the signal strength of ion intensities at characteristic masses in the mass spectrum, and correlating these ion intensities to cetane number using multiple regression analysis.
- Combined gas chromatography/mass spectrometry (GS/MS) analysis has been done on crude oils. U.S. Patent 5,119,315 discloses a method for aligning sample data such as a mass chromatogram with reference data from a known substance. Williams et al, 12th European Assoc. Organic Geochem., Organic Geochem. Int. Mtg. (Germany 09/16-20/85); Organic Geochemistry 1986, Vol. 10 (1-3) 451-461, discusses the biodegradation of crude oils as measured by GC/MS analysis.
- It would be desirable to have a single analyzer means for rapidly measuring chemical or physical properties of intermediate streams in the manufacturing process and/or lube oil products and using these properties to control units within the manufacturing process and/or product quality.
- This invention relates to a process for controlling the manufacture of lubricating oils from a feed having a boiling point of about 350°C or greater by the steps of introducing the feed into a distillation unit, separating the feed into light, medium and heavy distillates, introducing the distillates into an extraction unit, extracting the distillates to produce raffinates, introducing the raffinates into a dewaxing unit and dewaxing the raffinates to produce lubricating oils, said process comprising:
- (a) obtaining samples of at least one of lubricating oil, feed, distillate and raffinate;
- (b) selecting at least one physical, chemical, perceptual or performance property of at least one of lubricating oil, feed, distillate and raffinate;
- (c) selecting reference samples, said reference samples containing characteristic compound types present in the at least one lubricating oil, feed, distillate and raffinate and which have known values for the property or properties selected in step (b);
- (d) producing a training set by the steps of:
- (1) injecting each reference sample into a gas chromatograph which is interfaced
to a mass spectrometer thereby causing at least a partial separation of the
hydrocarbon mixture into constituent chemical components;
separation of the hydrocarbon mixture into constituent chemical components; - (2) introducing the constituent chemical components of each reference sample into the mass spectrometer, under dynamic flow conditions;
- (3) obtaining for each reference sample a series of time resolved mass chromatograms;
- (4) calibrating the mass chromatograms to correct retention times;
- (5) selecting a series of corrected retention time windows;
- (6) selecting within each retention time window a series of molecular and/or fragment ions, said ions being representative of characteristic compounds or compound classes expected within the retention time window;
- (7) recording the total amount of each characteristic compound or compound group selected in step d(6);
- (8) forming the data from steps d(6) and d(7) into a X-block matrix;
- (9) forming the property data selected in (b) for reference samples selected in (c) into a Y-block matrix;
- (10) analyzing the data from steps d(8) and d(9) by multivariate correlation techniques including Partial Least Squares, Principal Component Regression, or Ridge Regression to produce a series of coefficients;
- (e) subjecting at least one unknown sample of at least one of lubricating oil, feed, distillate and raffinate to steps d(1) to d(3) in the same manner as the reference sample to produce a series of time resolved mass chromatograms;
- (f) repeating steps d(4) and d(8) for each mass chromatogram from step (e);
- (h) using the predicted values of the property or properties of the lubricating oil and/or at least one of the feed, distillate and raffinate sample or samples to control operation of at least one of the distillation unit, extraction unit and dewaxing unit.
-
- Another embodiment of the invention relates to a method for controlling or monitoring chemical or refinery processes which utilize feedstocks and/or produce products having boiling points greater than about 350°C which comprises:
- (a) obtaining at least one sample of a refinery or chemical feedstock or product;
- (b) selecting at least one physical, chemical, perceptual or performance property of at least one refinery or chemical process feedstock or product;
- (c) selecting reference samples, said reference samples containing characteristic compound types present in the at least one refinery or chemical process feedstock or product and which have known values for the property or properties selected in step (b);
- (d) producing a training set by the steps of:
- (1) injecting each reference sample into a gas chromatograph which is interfaced to a mass spectrometer thereby causing at least a partial separation of the hydrocarbon mixture into constituent chemical components;
- (2) introducing the constituent chemical components of each reference sample into the mass spectrometer, under dynamic flow conditions.
- (3) obtaining for each reference sample a series of time resolved mass chromatograms;
- (4) calibrating the mass chromatograms to correct retention times;
- (5) selecting a series of corrected retention time windows;
- (6) selecting within each retention time window a series of molecular and/or fragment ions, said ions being representative of characteristic compounds or compound classes expected within the retention time window;
- (5) selecting a series of corrected retention time windows;
- (6) selecting within each retention time window a series of molecular and/or fragment ions, said ions being representative of characteristic compounds or compound classes expected within the retention time window;
- (7) recording the total amount of each characteristic compound or compound group selected in step d(6);
- (8) forming the data from steps d(6) and d(7) into a X-block matrix;
- (9) forming the property data selected in (b) for reference samples selected in (c) into a Y-block matrix;
- (10) analyzing the data from steps d(8) and d(9) by multivariate correlation techniques including Partial Least Squares, Principal Component Regression, or Ridge Regression to produce a series of coefficients;
- (e) subjecting at least one unknown refinery or chemical process feedstock or process sample to steps d(1) to d(3) in the same manner as the reference samples to produce a series of time resolved mass chromatograms;
- (f) repeating steps d(4) and d(8) for each mass chromatogram from step (e);
- (g) multiplying the matrix from step (f) by the coefficients from step d(10) to produce a predicted value of the property or properties for the refinery or chemical process feedstocks or products sample or samples; and
- (h) using the predicted values of the property or properties of the refinery or chemical feedstocks, intermediate or products sample or samples to control the refinery or chemical process.
-
- The gas chromatography/mass spectrometry (GC/MS) method described above can be used to rapidly predict a wide range of perceptual, performance, chemical and/or physical properties of complex mixtures such as intermediate streams in the lubes manufacturing process and lubricating oil products. Such properties include distillation characteristics, pour point, density, aniline point, feed stock quality, cloud point, haze, viscosity and the like as well as specific chemical constituents. The multivariate correlation methods can also treat the collinear data generated by the GC/MS analyses.
- Figure 1 is a schematic flow diagram of a manufacturing process for a lube oil.
- The typical lubricating oil manufacturing process involves a distillation unit, an extraction unit, a dewaxing unit and optionally, a hydrofining unit. The lubricating oil products are commonly used as base stocks for producing finished oils or may be specialty products such as transformer oils and agricultural oils.
- Figure 1 is a schematic flow diagram showing an on-line manufacturing process.
Feed stocks 10 are complex hydrocarbon mixtures such as crudes or heavy distillate streams. The feedstock is fed todistillation unit 20 throughline 12. Feedstock may be sampled through samplingport 14 which is connected to samplingline 16 interrupted byvalve 18. -
Distillation unit 20 is typically a pipestill which distills the feed stock into a plurality of distillation cuts. For purposes of simplicity, these distillation cuts are shown exitingunit 20 asline 22n which represents a plurality of lines where n is the number of distinct distillation cuts. Each of thelines 22n may be sampled throughsampling ports 24n which are connected tosampling lines 26n interrupted byvalves 28n. - The distillate cuts are fed to
extraction unit 30 where they are extracted using solvents such as phenol, N-methylpyrrolidone and the like. The extraction process results in raffinates and bottoms. Again for purposes of simplicity, these raffinates are shown exiting theextraction unit 30 as asingle line 32n which represents a plurality of lines where n is the number of different raffinate extracts. Each of thelines 32n may be sampled throughsampling ports 34n which are connected tosampling lines 36n interrupted byvalves 38n. The raffinate extracts are usually stripped of solvent in a stripping unit (not shown) prior to entering adewaxing unit 40. throughsampling ports 44n which are connected tosampling lines 46n interrupted byvalves 48n. - The dewaxed
raffinates exiting unit 40 throughlines 42n may be used as lubricating oils (following removal of dewaxing aid). Typical examples of such lube oils are known as light neutrals, heavy neutrals, bright stocks and the like. These lube oils may be sampled for product quality throughsampling ports 44n connected tosampling lines 46n interrupted byvalves 48n. These lube oils may optionally be subjected to a hydrofinishing step in ahydrofiner unit 50. Hydrofiners use catalysts and conditions well known in the art. The hydrofinished products exit hydrofiner 50 throughlines 52m where m represents the number of lube oils subjected to hydrofinishing. The hydrofinished oils may be sampled throughsampling ports 54m connected to samplinglines 56m interrupted byvalves 58m. - Each of
lines sampling manifold 60.Sampling manifold 60 also includes an optional provision for at-line operation wherein aremote location 70 is connected to thesampling manifold 60 throughline 62 interrupted byvalve 66 andsampling port 64.Sampling manifold 60 is a central location where all samples to be analyzed are gathered prior to GC/MS analysis.Manifold 60 can be purged by sample to be analyzed to remove contaminants and purged material recycled throughline 72 interrupted byvalve 74. - Sample to be analyzed is fed through
line 76 to sampleinjection valve 80.Injection valve 80 can likewise be purged by sample to be analyzed throughline 82 interrupted byvalve 84. Oncesample manifold 60 andsample injection valve 80 are purged, sample to be analyzed is injected into GC/MS analyzer. Samples from off-line operation can be directly injected throughvalve 80. Off-line samples are those collected at remote locations and brought to a central facility for analysis. The raw data generated by GC/MS analyzer 90 is fed tocomputer 100. Spent sample and purging materials are sent to recycle throughline 92 interrupted byvalve 94.Computer 100 mathematically treats raw GC/MS data. Output fromcomputer 100 is then fed as an electronic signal throughline 102 to controlcomputer 110.Control computer 110 is connected throughline 112 tounits units product exiting unit 40 and/or 50. - The operation of the GC/
MS analyzer 90 andcomputer 100 is described in further detail as follows. The feedstock, distillate cuts and lubricating oil products are all complex hydrocarbon mixtures involving thousands of individual chemical species. The use of GC/MS to analyze such complex mixtures for chemical and physical properties involves the generation of large amounts of collinear data. Multiple regression analysis may be employed for treating normal linear data. However, this type of analysis cannot be used for collinear data. - The process according to the invention involves a means for predicting chemical, performance, perceptual and physical properties of feedstock, distillates, raffinates and lubricating oils by quantitative identification of components using a combination of retention times from a GC analysis coupled with target fragment and/or molecular ions produced by the MS. The MS information is compared against a set of known properties from reference samples which form a training set. By mathematically comparing the experimental data with that of the training set, one may predict the desired properties of other feedstocks, distillates, raffinates and lubricating oils.
- GC/MS utilizes a gas chromatograph interfaced with a mass spectrometer. While a chromatographic method such as supercritical fluid chromatography, liquid chromatography or size exclusion chromatography may be used to separate the mixture into components or mixtures of components, gas chromatography, especially capillary gas chromatography is the preferred means for interfacing with a mass spectrometer. Both GC and MS use computer software for instrument control, data acquisition and data reduction. The computer platform should be capable of acquiring at least 2000 mass spectra in about 7 minutes.
- The sample mixture to be analyzed is first injected into a GC where the mixture components are separated as a function of retention time, often on the basis of boiling points. Only partial chromatographic resolution of mixture components is necessary. The GC oven temperature is usually programmed for samples with a wide boiling range. Separated components may also be identified by a detector such as a flame ionization detector, atomic emission detector, thermal conductivity detector or electron capture detector.
- The separated or partially separated components are then transferred to the mass spectrometer under dynamic flow conditions. Since a GC operates under atmospheric pressure and a MS under vacuum condition (about 10-3kPa), the instrument interface requires a coupling device such as a molecular separator (e.g., jet, membrane, etc.), open split coupler or capillary direct interface to efficiently transfer sample while minimizing carrier gas effects.
- Depending on the nature of the sample, the mixture may be introduced directly into a MS using a direct insertion probe without a prior GC separation step. Other thermal separation techniques not involving a GC may be used to introduce the sample into the mass spectrometer.
- In the MS, sample molecules are bombarded with high energy electrons thereby creating molecular ions which fragment in a pattern characteristic of the molecular species involved. A continuous series of mass spectra are obtained over a scan range of at least 10 to at least 800 daltons. The mass spectral data may also be acquired under selected ion monitoring (SIM) mode. In the selected ion mode, care must be taken to select ions representative of the components of interest and to operate under repeatable conditions. A variety of MS instruments may be used including low resolution, high resolution, MS/MS (hybrid, triple quadrupole, etc.), ion cyclotron resonance and time of flight. Any ionization technique may be used, such as electron ionization, chemical ionization, multiphoton ionization, field desorption, field ionization, etc., provided that the technique provides either molecular or fragment ions which are suitable for use in the analysis procedure.
- The results of sample analysis are a series of ℓ mass spectra. The mass spectra are divided into n time intervals where n is an integer from 1 to ℓ. At least one diagnostic ion is chosen from each of m time intervals where m is an integer from 1 to n. The term "diagnostic ion" refers to an ion which is representative of a compound, a chemical class or a performance, perceptual or physical property correlated thereto. Regardless of whether mass spectra are obtained in the scan or selected ion monitoring mode, it is important that the mass spectra be obtained under repeatable conditions.
- If the mass spectral data are acquired in the scan mode, the mass range covered during acquisition should be sufficient to provide acquisition of all of the ions which could be used as diagnostic ions during mathematical treatment of each mass spectral scan. If the mass spectral data are acquired in the selected ion monitoring mode, then care must be taken that the ions selected for monitoring are suitable for use in measuring the components of interest.
- The sample mass spectral data are then compared to mass spectral data from a series of reference samples with known performance, perceptual, physical and/or chemical properties. In order to compare reference mass spectral data with sample mass spectral data, it may be desirable to time align the sample data to help ensure the integrity of the comparison. There are commercially available computer programs for such data alignment, for example, Hewlett-Packard GC/MS software G 1034C version C.01.05.
- The reference mass spectral data, and associated properties data, are arranged in matrix form for mathematical treatment as described below. In the case of chemical composition information, one matrix is formed of reference sample ion intensities at given masses and the other matrix contains known ion intensities for molecular fragment ions of known components. The training set for chemical composition data is thus made up of mass spectral data for different components characteristic of compounds or molecular series expected to be found in the sample mixtures. Similar training sets can be formed for other chemical or perceptual or performance or physical properties of interest. These training sets form one block or matrix of data (Y-block or properties matrix). The actual sample mass spectral data (which may have been time aligned) form the other block (X-block) or matrix of data. These two matrices are subjected to mathematical treatments known as Partial Least Squares (PLS), or Principal Component Regression (PCR), or Ridge Regression (RR) to obtain a mathematically describable relationship between the properties data and mass spectral data, known as a model. Coefficients provided by this model are mathematically combined with the suitably treated mass spectral data from samples with unknown desired properties to:
- a) predict desired properties
- b) assess the suitability of the model for such predictions, and
- c) diagnose the stability and general correctness of the process that yielded the mass spectral data
-
- PLS/PCR/RR are described in the literature, e.g., Wold S., A. Ruhe, H. Wold, and W. J. Dunn, "The Collinearity Problem in Linear Regression. The Partial Least Squares (PLS) Approach to Generalized Inverses", SIAM J. Sci. Stat. Comput., 1984 5(3), 735-743, or Geladi P., and B. R. Kowalki, "Partial Least Squares Regression: A Tutorial", Anal. Chem. Acta, 1986, 185, 1-17, or Hökuldsson A., "PLS Regression Methods", J. Chemometrics, 1988, 2, 211-228, or in many other articles in journals such as the Journal of Chemometrics or Intelligent Laboratory Systems; Frank, I., and J. Friedman, "A Statistical View of Some Chemometrics Regression Tools", Technometrics, 1993, Vol. 35, No. 2; Jackson, J. E., "A User's Guide to Principal Components", Wiley-Interscience, New York, 1991; Montogomery, D.C. and E. A. Peck, "Introduction To Linear Regression Analysis", Wiley-Interscience, New York, 1990; and Martens, H., and T. Naes, "Multivariable Calibration", Wiley-Interscience, New York, 1989.
- When dealing with a complex mixture, it is necessary to select appropriate masses or groups of masses at specific retention times for a particular compound or classes of compounds. The selection of such masses is the basis for a set a rules which then forms the data for the training set. There are no set procedures for such a selection process. The researcher must select appropriate masses for compounds of interest. For example, feed stocks and lube oils contain a wide range of compound types such as paraffins, cycloparaffins, aromatics, and olefins. It is known that paraffinic hydrocarbons yield fragment ions at masses 43, 57, 71, 85,...daltons, and these masses may be used as diagnostic of this class of compounds. Moreover, when coupled with retention time data, it is possible to identify concentrations of specific compounds within this class of compounds. In a similar manner, training sets for other chemical, performance, perceptual or physical properties may be developed by correlating compositional data with other properties of interest, e.g., distillation characteristics, viscosities and viscosity index, volatility, refractive index and the like. The result of a mathematical treatment such as PLS/PCR/RR of the training set is a set of coefficients for the properties of interest.
- These coefficients are then multiplied by the data matrix for the sample. The result is a prediction of the desired property or properties which information can be used to control operating conditions in the distillation unit, extraction unit, dewaxing unit and/or hydrofiner as well as control lube oil quality. Moreover, variances in properties serve to promptly alert operators of upsets/changes in operating conditions which could influence product quality. The method of the invention is further illustrated by the following examples.
- The method for predicting the physical or chemical properties of a complex hydrocarbon mixture is demonstrated in this example using density at 15°C as the specific property for purposes of illustration. The method is generally applicable to a range of other physical properties as well as performance or perceptual or chemical properties of such mixtures.
- The initial consideration is to establish a set of standard GC/MS operating parameters so that the GC/MS analytical data used for predicting properties is obtained under consistent operating conditions. The GC/MS instrument used in this example is a Hewlett-Packard 5972 Mass Selective Detector interfaced to a Hewlett Packard 5890 Series II Gas Chromatograph fitted for use with microbore columns.
- The GC/MS operating conditions are summarized in Table 1.
GC Conditions Column Phenyl Silicone (such as HP-5) 10m x 0.1 mm, 17 micron film thickness Temperature Program Initial Temperature (°C) 180 Initial Time (minutes) 0 Program Rate (°C/min) 15 Final Temperature (°C) 310 Final Time (minutes) 5.33 Pressure Program Initial Pressure (psi) 30 Initial Time (minutes) 0 Program Rate (psi/minute) 4 Final Pressure (psi) 80 Final Time (minutes) 10 Carrier Gas Helium Linear Velocity 25.6 Injection Port Temperature (°C) 300 Injection Volume µL 0.5 Split Ratio 500:1 Column Head Press, kPa Approx. 260 Interface Temperature (°C) 310 Mass Spectrometer Conditions Ionization Mode Electron Ionization, 70 eV nominal Cycle Time (minutes) 0.003 - In order to predict properties (density in this example) of an unknown hydrocarbon mixture, it is first necessary to select reference samples having known values of the property or properties of interest. A series of twenty-seven (27) samples of 150N grade waxy raffinates from various crude oils were prepared and used in this example. These reference samples were used to form both training and test sets as described below.
- A data treatment method should be selected prior to obtaining raw GC/MS data. Two types of data treatments which may be used are either Chemist's Rules or Hydrocarbon Compound Type Analysis as described, for example, in Robinson, C.J., "Low Resolution Mass Spectrometric Determination of Aromatics and Saturates in Petroleum Fractions", Analytical Chemistry, 1971, 43(11), pp. 1425-1434.
- Chemist's Rules involve two separate sections: (1) a calibration section to correct retention times, i.e., the time between zero and the time when a given peak occurs; and (2) the actual Rules which are based on a selected series of masses corresponding to prominent compounds or molecular series expected for the type of hydrocarbon mixture under investigation. These compounds or compound types are selected on the basis that they have prominent molecular and/or fragment ions unique to that compound or molecular series. A portion of the Chemist's Rules are shown in Table 2. A full set of Chemist's Rules are shown in its entirety following Example 4.
COMPLETE CHEMIST'S RULES FOR LUBES Rule Material Masses Retention Time Starting Ending 1 nC16 43 57 71 85 99 113 1.00 1.89 2 1/2 ring 69 83 97 109 123 137 1.00 2.30 3 3/4 ring 149 163 177 189 203 217 1.00 2.30 4 4/5 ring 229 243 257 269 283 297 1.00 2.30 5 6 ring 309 223 337 1.00 2.30 6 -6 91 105 119 133 147 161 1.00 2.30 7 -6.1 92 106 120 134 148 162 1.00 2.30 8 -8/-10 115 117 129 131 143 145 1.00 2.30 9 -12 128 141 142 155 156 169 1.00 2.30 10 -14/-16 151 153 165 167 179 181 1.00 2.30 11 -18 178 191 192 205 206 219 1.00 2.30 12 -20 202 215 226 239 228 241 1.00 2.30 13 nC17 43 57 71 85 99 113 1.89 1.98 13 nC17 43 57 71 85 99 113 1.89 1.98 14 isoPara 43 57 71 85 99 113 1.98 2.30 15 nC18 43 57 71 85 99 113 2.30 2.40 16 isoPara 43 57 71 85 99 113 1.980 2.300 17 1/2 ring 69 83 97 109 123 137 2.400 3.220 18 3/4 ring 149 163 177 189 203 217 2.400 3.220 19 4/5 ring 229 243 257 269 283 297 2.400 3.220 . . . . . . . . . . . . . . . . . . . . . . . . . . . . . . 172 -8/-10 115 117 129 131 143 145 12.07 14.00 173 -12 128 141 142 155 156 169 12.07 14.00 174 -14/-16 151 153 165 167 179 181 12.07 14.00 175 -18 178 191 192 205 206 219 12.07 14.00 176 -20 202 215 226 239 228 241 12.07 14.00 177 nC39 43 57 71 85 99 113 12.83 12.87 178 isoPara 43 57 71 85 99 113 12.88 14.00 - A reference retention time is then determined for each mass spectral ion grouping selected for use in the Chemist's Rules for each of the selected molecular types or molecules identified in Table 2. Such corrections are necessary due to slight shifts in retention times which may result from column degradation, column head pressure fluctuations, changes in column carrier gas linear velocity, or minor fluctuations in the GC column oven temperatures or other causes. The calibration step generates a series of correction factors for the entire GC/MS data file. There are commercially available programs which will perform retention time corrections. The results of applying such corrections are shown in Table 3.
REFERENCE CALIBRATION MASS TIME TYPE LIMIT TIMEe CORRCTION 268 2.800 P 0.15 2.794 -0.006 282 3.276 P 0.15 3.272 -0.004 366 6.260 P 0.15 6.266 0.006 422 7.953 P 0.15 7.953 0.000 57 10.556 P 0.15 10.591 0.035 - Once the correction coefficients are determined, the actual Rules are then determined. In the case of density preduction, a total of 178 Rules is used based on compound or compound series identification. For each Rule, a set of characteristic mass numbers are determined. These characteristic mass numbers can range from 1 to n, where n is an integer representing the entire mass range scanned or the number of selected ions being monitored. In this case, six characteristic mass numbers are illustrated. The ion intensities of the masses for each Rule are summed within the upper and lower retention time limits for that rule. The results are shown for a sampling of the 178 Rules in Table 4 for this demonstration analysis. A full set of rules is shown in its entirety following Example 4.


- The analysis summarized in Table 4 is done for each reference sample. The results from these respective analyses form a training set which is subjected to mathematical treatment. The goal is develop a model that can be used to predict the unknown properties of future samples using their mass spectral data only. The mathematical treatments are described by multivariate correlation techniques such as Projection to Latent Structures (PLS) or otherwise known as Partial Least Squares (PLS), Principal Component Regression (PCR), arid Ridge Regression (RR). These techniques are superior to ordinary multiple linear regression in their ability to treat collinearity amongst variables in the X-block or GC/MS data matrix (and Y-block or properties matrix for PLS), and in their ability to handle the quantity of data generated by the Chemist's Rules. Ordinary Multiple Linear Regression cannot be used to treat collinear variables.
- PLS/PCR/RR are numerical analysis techniques for detecting and formulating a mathematical structure (model) within a data set comprising observations associated with multiple objects. Each object has associated without observations for multiple variables, the latter being common to all objects. These multiple variables are assigned into two categories, known as X-block and Y-block (GC/MS data in this case). Observations associated with all variables in the X-block are realized from a common process. Observations associated with variables in the Y-block (known properties in this case) are realized from processes that may be different for each variable. The data set used to construct this mathematical model is referred to as the model calibration data set.
- The common use of PLS/PCR/RR is to apply the model developed from the calibration data set to X-block observations realized for new objects (not in the calibration data set) to predict values for the corresponding variables in the Y-block for these new objects, without having to execute the Y-block processes used in the calibration data set. Using diagnostics that are simultaneously generated by the PLS/PCR/RR model, assessment of whether the new objects can be adequately described by the model, and whether the model is used in an extrapolation mode versus interpolation mode can be performed.
- PLS/PCR addresses the collinearity features in the X-block and Y-block, by suitably reducing the dimensionality in both X- and Y-blocks (for PLS), and X-block only (for PCR) to form the model. Collinearity is a term referring to the existence of relationships between variables within the block itself. In the PLS modeling algorithm a number of independent dimensions in the X- and Y- blocks are identified by forming pseudo-variables known as principal components or latent vectors through different sets of linear combinations of original variables in each block. Each set of such combinations constitutes an independent dimension. It comprises a set of coefficients that each value associated with each variable in the block is to be weighted by to arrive at the new value for this dimension. The values for the new, reduced dimensions in the Y-block are regressed onto their counterparts in the new, reduced dimensions of the X-block to arrive at the most parsimonious dimension size (number of latent vectors) and their associated weights, with the final goal of one linear equation generated to permit prediction of Y-block variables using X-block variables. The number of dimensions used to construct the model is determined through optimization of a criterion known as PRESS (Prediction Error Sum of Squares), cumulated by a Cross Validation (CV) technique using the training data set, and, following the general model parsimony principle.
- For PCR, the number of independent dimensions in the X-block are first selected and identified in a similar fashion as in PLS by forming principal components. Then, for each variable in the Y-block, a model is obtained by performing ordinary multiple linear regression using the Principal Components as "Prediction Variables".
- For Ridge Regression, the collinearity problem is dealt with in a different manner than PLS/PCR. Here a diagonal matrix known as the Lambda Matrix is added to the Covariance Matrix of the X-block with the net effect of stabilizing the numerical computation needed to obtain the model coefficients. The selection of Lambda values is through optimization of PRESS criterion using cross validation of the training set.
- Thus, the Chemist's Rule data for the various reference samples derived from GC/MS analysis form the X-block variables. PLS/PCR/RR treatment may require preliminary reorganization of the X-block data, such as transposition and removal of redundant data and constants or mathematical transformations. The Y-block variables are the property (or properties) to be predicted, and may also require mathematical transformations such as logarithmic or geometric, as well as reorganization. The data blocks may be represented by:

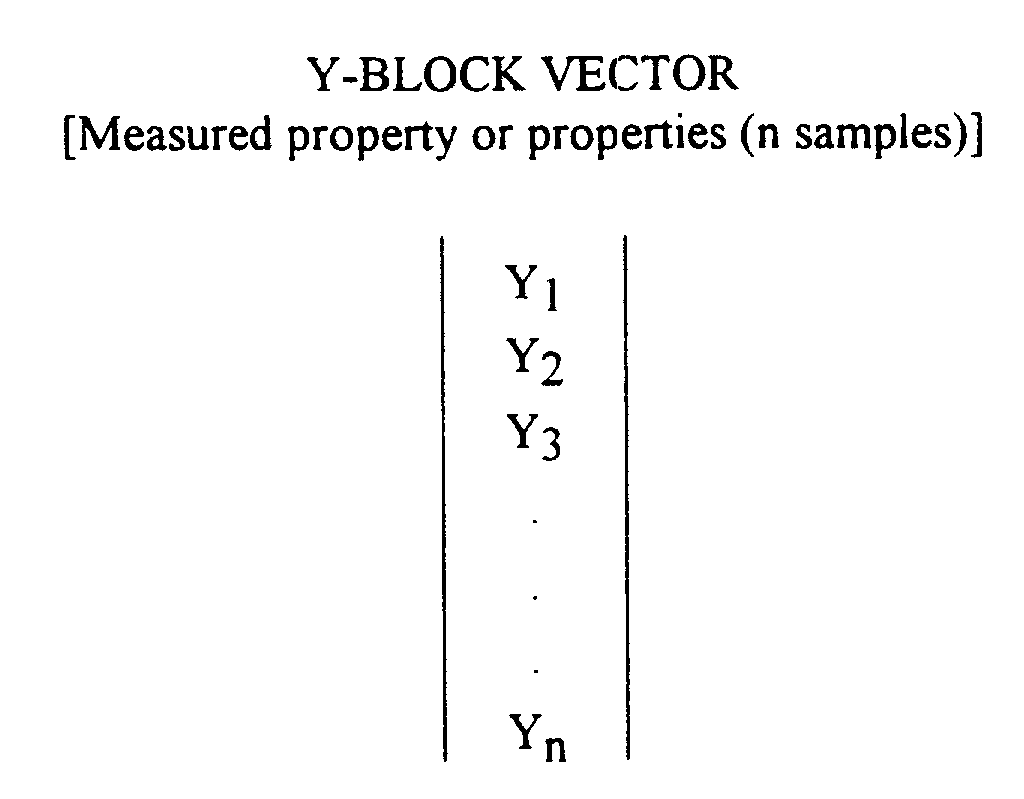
- The Y-block may be a single observation per set of Chemist's Rules as shown above, or it may be a n x m matrix of observations where there are m different properties to be predicted.
- The results of PLS treatment of the training set data are a series of coefficients. Raw GC/MS data from an unknown sample (or samples) are then treated by the Chemist's Rules first to correct the retention times and then to form the ion summations. Each value for the Chemist's Rule ion summation result is then multiplied by the training set coefficients and summed to generate the prediction of the desired property. Table 5 illustrates the quality of the predicted density values for both the training set and the unknown test set for density at 15°C.
Predicted vs. Measured Waxy Raffinate Density Values @ 15°C (g/ml). Measured Predicted Training Set 1 0.8478 0.8481 2 0.8597 0.8608 3 0.8642 0.8649 4 0.8614 0.8645 5 0.8657 0.8690 6 0.8616 0.8610 7 0.8680 0.8665 8 0.8596 0.8593 9 0.8596 0.8609 10 0.8640 0.8637 11 0.8645 0.8661 12 0.8762 0.8772 13 0.8849 0.8863 14 0.8607 0.8589 15 0.8675 0.8652 16 0.8622 0.8635 17 0.8699 0.8691 18 0.8749 0.8743 19 0.8636 0.8636 20 0.8636 0.8632 21 0.8794 0.8771 22 0.8724 0.8722 23 0.8600 0.8613 Test Set 24 0.8695 0.8691 25 0.8664 0.8644 26 0.8665 0.8645 27 0.8768 0.8758 - The procedure of Example 1 was repeated for predicting refractive index @ 75°C for the suite of 150N grade waxy raffinates. The same 22 samples were used for the training set, while the remaining five samples were used as a test set. The results for the refractive index at 75°C are summarized in Table 6.
Predicted vs. Measured Refractive Index @ 75°C Measured Predicted Training Set 1 1.4441 1.4434 2 1.4505 1.4504 3 1.4534 1.4527 4 1.4509 1.4526 5 1.4540 1.4551 6 1.4509 1.4507 7 1.4550 1.4540 8 1.4504 1.4499 9 1.4495 1.4500 10 1.4523 1.4514 11 1.4525 1.4532 12 1.4573 1.4577 13 1.4628 1.4626 14 1.4506 1.4500 15 1.4542 1.4535 16 1.4528 1.4538 17 1.4575 1.4571 18 1.4581 1.4575 19 1.4505 1.4519 20 1.4512 1.4519 21 1.4616 1.4609 22 1.4576 1.4582 Test Set 23 1.4497 1.4503 24 1.4546 1.4546 25 1.4525 1.4522 26 1.4530 1.4526 27 1.4582 1.4579 - The procedure of Example 1 was repeated for predicting viscosity at 100°C for 150N grade waxy raffinates. The same 22 samples were used for the training set, while the remaining five samples were used as a test set. The results for density prediction are summarized in Table 7.
Predicted vs. Measured Viscosity @ 100°C (cSt) Measured Predicted Training Set 1 5.38 5.37 2 4.72 4.74 3 4.79 4.79 4 4.68 4.74 5 4.74 4.79 6 4.48 4.48 7 4.49 4.42 8 4.35 4.27 9 4.38 4.34 10 4.44 4.38 11 4.41 4.53 12 4.61 4.66 13 4.76 4.84 14 4.49 4.45 15 4.59 4.56 16 4.84 4.88 17 4.96 5.00 18 4.74 4.62 19 4.16 4.39 20 4.91 4.88 21 5.19 5.14 Test Set 22 5.07 5.07 23 4.35 4.45 24 4.67 4.51 25 4.39 4.41 26 5.00 4.90 27 4.81 4.79 - The procedure of Example 1 was repeated for predicting weight percent wax content for 150N grade waxy raffinates. The same 22 samples were used for the training set, while the remaining five samples were used as a test set. The results for density prediction are summarized in Table 8.
Predicted vs. Measured Wax Content (Wt%) Measured Predicted Training Set 1 21.8 22.0 2 25.7 23.5 3 20.0 21.5 4 20.6 20.0 5 19.1 17.8 6 29.6 29.5 7 17.5 18.6 8 20.0 21.4 9 20.8 19.9 10 19.4 18.8 11 18.8 19.8 12 3.6 3.6 13 2.4 0.9 14 18.4 20.8 15 16.9 18.0 16 16.2 16.5 17 14.6 14.4 18 6.7 7.5 19 20.2 17.4 20 21.2 21.1 Test Set 21 10.4 10.4 22 11.6 12.3 23 23.5 22.5 24 7.6 9.4 25 18.1 17.5 26 20.4 20.2 27 8.6 8.4 - Other properties of various grades of lubricating intermediate streams or finished products, such as, cloud point, flash point, viscosity index, pour point, basic nitrogen content, distillation and volatility characteristics, viscosity at 40°C, aniline point, sulfur content, etc., could be predicted using the method according to the invention.
- The subject method can also be applied for predicting properties of other types of complex hydrocarbon mixtures in similar boiling ranges, such as catalytic cracker feedstock quality, feed to extraction or dewaxing units, feedstocks to distillation or stripping towers, and to blending considerations.
COMPLETE CHEMIST'S RULES FOR LUBES Retention Time Rule Material Masses Starting Ending 1 nC16 43 57 71 85 99 113 1.00 1.89 2 1/2 ring 69 83 97 109 123 137 1.00 2.30 3 3/4 ring 149 163 177 189 203 217 1.00 2.30 4 4/5 ring 229 243 257 269 283 297 1.00 2.30 5 6 ring 309 223 337 1.00 2.30 6 -6 91 105 119 133 147 161 1.00 2.30 7 -6.1 92 106 120 134 148 162 1.00 2.30 8 -8/-10 115 117 129 131 143 145 1.00 2.30 9 -12 128 141 142 155 156 169 1.00 2.30 10 -14/-16 151 153 165 167 179 181 1.00 2.30 11 -18 178 191 192 205 206 219 1.00 2.30 12 -20 202 215 226 239 228 241 1.00 2.30 13 nC17 43 57 71 85 99 113 1.89 1.98 14 isoPara 43 57 71 85 99 113 1.98 2.30 15 nC18 43 57 71 85 99 113 2.30 2.40 16 isoPara 43 57 71 85 99 113 2.40 3.22 17 1/2 ring 69 83 97 109 123 137 2.40 3.22 18 3/4 ring 149 163 177 189 203 217 2.40 3.22 19 4/5 ring 229 243 257 269 283 297 2.40 3.22 20 6 ring 309 223 337 2.40 3.22 21 -6 91 105 119 133 147 161 2.40 3.22 22 -6.1 92 106 120 134 148 162 2.40 3.22 23 -8/-10 115 117 129 131 143 145 2.40 3.22 24 -12 128 141 142 155 156 169 2.40 3.22 25 -14/-16 151 153 165 167 179 181 2.40 3.22 26 -18 178 191 192 205 206 219 2.40 3.22 27 nC19 43 57 71 85 99 113 2.70 2.85 28 isoPara 43 57 71 85 99 113 2.85 3.22 29 nC20 43 57 71 85 99 113 3.22 3.34 30 isoPara 43 57 71 85 99 113 3.34 3.70 31 1/2 ring 69 83 97 109 123 137 3.34 4.20 32 3/4 ring 149 163 177 189 203 217 3.34 4.20 33 4/5 ring 229 243 257 269 283 297 3.34 4.20 34 6 ring 309 223 337 3.34 4.20 35 -6 91 105 119 133 147 161 3.34 4.20 36 -6.1 92 106 120 134 148 162 3.34 4.20 37 -8/-10 115 117 129 131 143 145 3.34 4.20 38 -12 128 141 142 155 156 169 3.34 4.20 39 -14/-16 151 153 165 167 179 181 3.34 4.20 40 -18 178 191 192 205 206 219 3.34 4.20 41 -20 202 215 226 239 228 241 3.34 4.20 42 nC21 43 57 71 85 99 113 3.70 3.83 43 isoPara 43 57 71 85 99 113 3.84 4.20 44 nC22 43 57 71 85 99 113 4.20 4.33 45 isoPara 43 57 71 85 99 113 4.33 4.72 46 1/2 ring 69 83 97 109 123 137 4.33 5.20 47 3/4 ring 149 163 177 189 203 217 4.33 5.20 48 4/5 ring 229 243 257 269 283 297 4.33 5.20 49 6 ring 309 223 337 4.33 5.20 50 -6 91 105 119 133 147 161 4.33 5.20 51 -6.1 92 106 120 134 148 162 4.33 5.20 52 -8/-10 115 117 129 131 143 145 4.33 5.20 53 -12 128 141 142 155 156 169 4.33 5.20 54 -14/-16 151 153 165 167 179 181 4.33 5.20 55 -18 178 191 192 205 206 219 4.33 5.20 56 -20 202 215 226 239 228 241 4.33 5.20 57 nC23 43 57 71 85 99 113 4.72 4.83 58 isoPara 43 57 71 85 99 113 4.83 5.20 59 nC24 43 57 71 85 99 113 5.20 5.37 60 isoPara 43 57 71 85 99 113 5.38 5.64 61 1/2 ring 69 83 97 109 123 137 5.38 6.15 62 3/4 ring 149 163 177 189 203 217 5.38 6.15 63 4/5 ring 229 243 257 269 283 297 5.38 6.15 64 6 ring 309 223 337 5.38 6.15 65 -6 91 105 119 133 147 161 5.38 6.15 66 -6.1 92 106 120 134 148 162 5.38 6.15 67 -8/-10 115 117 129 131 143 145 5.38 6.15 68 -12 128 141 142 155 156 169 5.38 6.15 69 -14/-16 151 153 165 167 179 181 5.38 6.15 70 -18 178 191 192 205 206 219 5.38 6.15 71 -20 202 215 226 239 228 241 5.38 6.15 72 nC25 43 57 71 85 99 113 5.65 5.85 73 isoPara 43 57 71 85 99 113 5.85 6.15 74 nC26 43 57 71 85 99 113 6.15 6.32 75 isoPara 43 57 71 85 99 113 6.33 6.64 76 1/2 ring 69 83 97 109 123 137 6.33 7.04 77 3/4 ring 149 163 177 189 203 217 6.33 7.04 78 4/5 ring 229 243 257 269 283 297 6.33 7.04 79 6 ring 309 223 337 6.33 7.04 80 -6 91 105 119 133 147 161 6.33 7.04 81 -6.1 92 106 120 134 148 162 6.33 7.04 82 -8/-10 115 117 129 131 143 145 6.33 7.04 83 -12 128 141 142 155 156 169 6.33 7.04 84 -14/-16 151 153 165 167 179 181 6.33 7.04 85 -18 178 191 192 205 206 219 6.33 7.04 86 -20 202 215 226 239 228 241 6.33 7.04 87 nC27 43 57 71 85 99 113 6.65 6.75 88 isoPara 43 57 71 85 99 113 6.76 7.04 89 nC28 43 57 71 85 99 113 7.05 7.20 90 isoPara 43 57 71 85 99 113 7.21 7.45 91 1/2 ring 69 83 97 109 123 137 7.21 7.85 92 3/4 ring 149 163 177 189 203 217 7.21 7.85 93 4/5 ring 229 243 257 269 283 297 7.21 7.85 94 6 ring 309 223 337 7.21 7.85 95 -6 91 105 119 133 147 161 7.21 7.85 96 -6.1 92 106 120 134 148 162 7.21 7.85 97 -8/-10 115 117 129 131 143 145 7.21 7.85 98 -12 128 141 142 155 156 169 7.21 7.85 99 -14/-16 151 153 165 167 179 181 7.21 7.85 100 -18 178 191 192 205 206 219 7.21 7.85 101 -20 202 215 226 239 228 241 7.21 7.85 102 nC29 43 57 71 85 99 113 7.46 7.65 103 isoPara 43 57 71 85 99 113 7.66 7.85 104 nC30 43 57 71 85 99 113 7.85 8.00 105 isoPara 43 57 71 85 99 113 8.01 8.30 106 1/2 ring 69 83 97 109 123 137 8.01 8.65 107 3/4 ring 149 163 177 189 203 217 8.01 8.65 108 4/5 ring 229 243 257 269 283 297 8.01 8.65 109 6 ring 309 223 337 8.01 8.65 110 -6 91 105 119 133 147 161 8.01 8.65 111 -6.1 92 106 120 134 148 162 8.01 8.65. 112 -8/-10 115 117 129 131 143 145 8.01 8.65 113 -12 128 141 142 155 156 169 8.01 8.65 114 -14/-16 151 153 165 167 179 181 8.01 8.65 115 -18 178 191 192 205 206 219 8.01 8.65 116 -20 202 215 226 239 228 241 8.01 8.25 117 nC31 43 57 71 85 99 113 8.30 8.37 118 isoPara 43 57 71 85 99 113 8.38 8.65 119 nC32 43 57 71 85 99 113 8.66 8.79 120 isoPara 43 57 71 85 99 113 8.77 8.99 121 1/2 ring 69 83 97 109 123 137 8.77 9.45 122 3/4 ring 149 163 177 189 203 217 8.77 9.45 123 4/5 ring 229 243 257 269 283 297 8.77 9.45 124 6 ring 309 223 337 8.77 9.45 125 -6 91 105 119 133 147 161 8.77 9.45 126 -6.1 92 106 120 134 148 162 8.77 9.45 127 -8/-10 115 117 129 131 143 145 8.77 9.45 128 -12 128 141 142 155 156 169 8.77 9.45 129 -14/-16 151 153 165 167 179 181 8.77 9.45 130 -18 178 191 192 205 206 219 8.77 9.45 131 -20 202 215 226 239 228 241 8.77 9.45 132 nC33 43 57 71 85 99 113 8.95 9.11 133 isoPara 43 57 71 85 99 113 9.11 9.50 134 nC34 43 57 71 85 99 113 9.50 9.56 135 isoPara 43 57 71 85 99 113 9.56 9.92 136 1/2 ring 69 83 97 109 123 137 9.56 10.51 137 3/4 ring 149 163 177 189 203 217 9.56 10.51 138 4/5 ring 229 243 257 269 283 297 9.56 10.51 139 6 ring 309 223 337 9.56 10.51 140 -6 91 105 119 133 147 161 9.56 10.51 141 -6.1 92 106 120 134 148 162 9.56 10.51 142 -8/-10 115 117 129 131 143 145 9.56 10.51 143 -12 128 141 142 155 156 169 9.56 10.51 144 -14/-16 151 153 165 167 179 181 9.56 10.51 145 -18 178 191 192 205 206 219 9.56 10.51 146 -20 202 215 226 239 228 241 9.56 10.51 147 nC35 43 57 71 85 99 113 9.93 10.04 148 isoPara 43 57 71 85 99 113 10.04 10.51 149 nC36 43 57 71 85 99 113 10.51 10.67 150 isoPara 43 57 71 85 99 113 10.67 11.16 151 1/2 ring 69 83 97 109 123 137 10.67 11.93 152 3/4 ring 149 163 177 189 203 217 10.67 11.93 153 4/5 ring 229 243 257 269 283 297 10.67 11.93 154 6 ring 309 223 337 10.67 11.93 155 -6 91 105 119 133 147 161 10.67 11.93 156 -6.1 92 106 120 134 148 162 10.67 11.93 157 -8/-10 115 117 129 131 143 145 10.67 11.93 158 -12 128 141 142 155 156 169 10.67 11.93 159 -14/-16 151 153 165 167 179 181 10.67 11.93 160 -18 178 191 192 205 206 219 10.67 11.93 161 -20 202 215 226 239 228 241 10.67 11.93 162 nC37 43 57 71 85 99 113 11.17 11.28 163 isoPara 43 57 71 85 99 113 11.29 11.93 164 nC38 43 57 71 85 99 113 11.94 12.06 165 isoPara 43 57 71 85 99 113 12.07 12.83 166 1/2 ring 69 83 97 109 123 137 12.07 14.00 167 3/4 ring 149 163 177 189 203 217 12.07 14.00 168 4/5 ring 229 243 257 269 283 297 12.07 14.00 169 6 ring 309 223 337 12.07 14.00 170 -6 91 105 119 133 147 161 12.07 14.00 171 -6.1 92 106 120 134 148 162 12.07 14.00 172 -8/-10 115 117 129 131 143 145 12.07 14.00 173 -12 128 141 142 155 156 169 12.07 14.00 174 -14/-16 151 153 165 167 179 181 12.07 14.00 175 -18 178 191 192 205 206 219 12.07 14.00 176 -20 202 215 226 239 228 241 12.07 14.00 177 nC39 43 57 71 85 99 113 12.83 12.87 178 isoPara 43 57 71 85 99 113 12.88 14.00 




Claims (11)
- A process for controlling the manufacture of lubricating oils from a feed having a boiling point of about 350°C or greater by the steps of introducing the feed into a distillation unit, separating the feed into light, medium and heavy distillates, introducing the distillates into an extraction unit, extracting the distillates to produce raffinates, introducing the raffinates into a dewaxing unit and dewaxing the raffinates to produce lubricating oils, said process comprising:(a) obtaining samples of at least one lubricating oil, feed, distillate and raffinate;(b) selecting at least one physical, chemical, perceptual or performance properties of at least one of lubricating oil, feed, distillate and raffinate;(c) selecting reference samples, said reference samples containing characteristic compound types present in the at least one lubricating oil, feed, distillate and raffinate and which have known values for the property or properties selected in step (b);(d) producing a training set by the steps of:(1) injecting each reference sample into a gas chromatograph which is interfaced to a mass spectrometer thereby causing at least a partial separation of the hydrocarbon mixture into constituent chemical components;(2) introducing the constituent chemical components of each reference sample into the mass spectrometer, under dynamic flow conditions:(3) obtaining for each reference sample a series of time resolved mass chromatograms;(4) calibrating the mass chromatograms to correct retention times;(5) selecting a series of corrected retention time windows;(6) selecting within each retention time window a series of molecular and/or fragment ions, said ions being representative of characteristic compounds or compound classes expected within the retention time window:(7) recording the total amount of each characteristic compound or compound group selected in step d(6);(8) forming the data from steps d(6) and d(7) into a X-block matrix in the order of the selected retention time windows from d(5) to yield for each selected reference sample a row in the training set X-block matrix:(9) forming the property data selected in (b) for reference samples selected in (c) into a Y-block matrix;(10) analyzing the data from steps d(8) and d(9) by multivariate correlation techniques such as Partial Least Squares. Principal Component Regression or Ridge Regression to produce a series of coefficients:(e) subjecting at least one unknown sample of at least one of lubricating oil, feed. distillate and raffinate to the steps d(1) and d(3) in the same manner as the reference samples to produce a series of time resolved mass chromatograms:(f) repeating steps d(4) and d(8) for each mass chromatogram from step (e):(g) multiplying the matrix from step (f) by the coefficients from step d(10) to produce a predicted value for the property or properties for the at least one lubricating oil, feed, distillate and raffinate sample or samples: and(h) using the predicted values of the property of properties of the at least one lubricating oil, feed, distillate and raffinate sample or samples to control operation of at least one of the distillation unit, extraction unit and dewaxing unit.
- A method for controlling or monitoring chemical or refinery processes which utilize feedstocks and/or product products having boiling points greater than about 350°C which comprises:(a) obtaining at least one sample of a refinery or chemical feedstock or product;(b) selecting at least one physical, chemical, perceptual or performance property of at least one refinery or chemical process feedstock or product:(c) selecting reference samples, said reference samples containing characteristic compound types present in the at least one refinery or chemical process feedstock or products and which have known values for the property or properties selected in step (b);(d) producing a training set by the steps of:(1) injecting each reference sample into a gas chromatograph which is interfaced to a mass spectrometer thereby causing at least a partial separation of the hydrocarbon mixture into constituent chemical components:(2) introducing the constituent chemical components of each reference sample into the mass spectrometer, under dynamic flow conditions:(3) obtaining for each reference sample a series of time resolved mass chromatograms;(4) calibrating the mass chromatograms to correct retention times:(5) selecting a series of corrected retention time windows:(6) selecting within each retention time window a series of molecular and/or fragment ions, said ions being representative of characteristic compounds or compound classes expected within the retention time window;(7) recording the total amount of each characteristic compound or compound group selected in step d(6);(8) forming the data from steps d(6) and d(7) into a X-block matrix in the order of the selected retention time windows from d(5) to yield for each selected reference sample a row in the training set X-block matrix;(9) forming the property data selected in (b) for reference samples selected in (c) into a Y-block matrix:(10) analyzing the data from steps d(8) and d(9) by a multivariate correlation technique, for example Partial Least Squares, Principal Component Regression or Ridge Regression, to produce a series of coefficients;(e) subjecting at least one unknown refinery or chemical process feedstock or process sample to steps d(1) and d(3) in the same manner as the reference samples to produce a series of time resolved mass chromatograms;(f) repeating steps d(4) and d(8) for each mass chromatogram from step (e);(g) multiplying the matrix from step (f) by the coefficients from step d(10) to produce a predicted value for the property or properties for the refinery or chemical process feedstocks or products sample or samples; and(h) using the predicted values of the property or properties of the refinery or chemical feed stocks or products sample or samples to control the refinery or chemical process.
- The method of claims 1 or 2 wherein the gas chomatograph is a capillary gas chromatograph.
- The method of any preceding claim, wherein the mass spectrometer is a quadrupole mass spectrometer.
- The method of any preceding claim, wherein the gas chromatograph and mass spectrometer are operated under repeatable conditions.
- The method of any preceding claim, wherein the selection of a series of molecular and/or fragment ions characterisitc of compounds or compound classes is accomplished using Chemist's Rules.
- The method of any one of claims 1 to 5, wherein the selection of a series of molecular and/or fragment ions characteristic of compounds or compound classes is accomplished using Hydrocarbon Type Analysis.
- The method of any preceding claim, wherein data from the gas chromatograph and mass spectrometer are stored in a computer.
- The method of any one of claims 1 to 7, wherein data from steps (c) and (g) are treated in a computer.
- The method of any preceding claim, wherein the data are collinear.
- The method of any preceding claim, wherein the multivariate correlation technique is Partial Least Squares.
Applications Claiming Priority (3)
| Application Number | Priority Date | Filing Date | Title |
|---|---|---|---|
| US494643 | 1995-06-23 | ||
| US08/494,643 US5699270A (en) | 1995-06-23 | 1995-06-23 | Method for preparing lubrication oils (LAW232) |
| PCT/US1996/007174 WO1997000926A1 (en) | 1995-06-23 | 1996-05-17 | Method for preparing lubricating oils |
Publications (2)
| Publication Number | Publication Date |
|---|---|
| EP0833878A1 EP0833878A1 (en) | 1998-04-08 |
| EP0833878B1 true EP0833878B1 (en) | 2001-06-13 |
Family
ID=23965349
Family Applications (1)
| Application Number | Title | Priority Date | Filing Date |
|---|---|---|---|
| EP96916493A Expired - Lifetime EP0833878B1 (en) | 1995-06-23 | 1996-05-17 | Method for preparing lubricating oils |
Country Status (7)
| Country | Link |
|---|---|
| US (1) | US5699270A (en) |
| EP (1) | EP0833878B1 (en) |
| JP (1) | JP3767905B2 (en) |
| AU (1) | AU698197B2 (en) |
| DE (1) | DE69613373T2 (en) |
| NO (1) | NO322581B1 (en) |
| WO (1) | WO1997000926A1 (en) |
Families Citing this family (54)
| Publication number | Priority date | Publication date | Assignee | Title |
|---|---|---|---|---|
| DE19713194C2 (en) * | 1997-03-27 | 1999-04-01 | Hkr Sensorsysteme Gmbh | Method and arrangement for recognizing properties of a sample on the basis of mass spectroscopy |
| US5905192A (en) * | 1997-07-23 | 1999-05-18 | Hewlett-Packard Company | Method for identification of chromatographic peaks |
| US6212488B1 (en) | 1998-07-20 | 2001-04-03 | Phillips Petroleum Company | Riser reactor simulation in catalytic cracking |
| US6442513B1 (en) | 1998-08-24 | 2002-08-27 | Mobil Oil Corporation | Component mapper for use in connection with real-time optimization process |
| WO2000045228A1 (en) * | 1999-01-29 | 2000-08-03 | Mobil Oil Corporation | Method to control a lubricant production |
| US6317654B1 (en) | 1999-01-29 | 2001-11-13 | James William Gleeson | Control of crude refining by a method to predict lubricant base stock's ultimate lubricant preformance |
| US6295485B1 (en) | 1999-01-29 | 2001-09-25 | Mobil Oil Corporation | Control of lubricant production by a method to predict a base stock's ultimate lubricant performance |
| US7097973B1 (en) | 1999-06-14 | 2006-08-29 | Alpha Mos | Method for monitoring molecular species within a medium |
| US6975944B1 (en) | 1999-09-28 | 2005-12-13 | Alpha Mos | Method and apparatus for monitoring materials used in electronics |
| GB0007063D0 (en) * | 2000-03-23 | 2000-05-10 | Simsci Limited | Mulitvariate statistical process monitors |
| US6662116B2 (en) | 2001-11-30 | 2003-12-09 | Exxonmobile Research And Engineering Company | Method for analyzing an unknown material as a blend of known materials calculated so as to match certain analytical data and predicting properties of the unknown based on the calculated blend |
| US7457708B2 (en) * | 2003-03-13 | 2008-11-25 | Agilent Technologies Inc | Methods and devices for identifying related ions from chromatographic mass spectral datasets containing overlapping components |
| US7875458B2 (en) * | 2003-11-25 | 2011-01-25 | Exxonmobil Research And Engineering Company | Application of test for residual wax contamination in basestocks to correlate with the low temperature viscometric properties of fully formulated oils |
| CN104020277A (en) * | 2004-09-15 | 2014-09-03 | 英国石油国际有限公司 | Process for evaluating refinery feedstock |
| BRPI0515276A (en) * | 2004-09-15 | 2008-07-15 | Bp Oil Int | process for the evaluation of a refinery matter |
| US9018148B2 (en) * | 2005-04-28 | 2015-04-28 | Cherron Oronite Company LLC | Method and system for screening lubricating oil compositions |
| US10684239B2 (en) | 2011-02-22 | 2020-06-16 | Saudi Arabian Oil Company | Characterization of crude oil by NMR spectroscopy |
| US10677718B2 (en) | 2011-02-22 | 2020-06-09 | Saudi Arabian Oil Company | Characterization of crude oil by near infrared spectroscopy |
| US11022588B2 (en) | 2011-02-22 | 2021-06-01 | Saudi Arabian Oil Company | Characterization of crude oil by simulated distillation |
| US10571452B2 (en) | 2011-06-28 | 2020-02-25 | Saudi Arabian Oil Company | Characterization of crude oil by high pressure liquid chromatography |
| US10725013B2 (en) | 2011-06-29 | 2020-07-28 | Saudi Arabian Oil Company | Characterization of crude oil by Fourier transform ion cyclotron resonance mass spectrometry |
| US9244052B2 (en) | 2011-12-22 | 2016-01-26 | Exxonmobil Research And Engineering Company | Global crude oil quality monitoring using direct measurement and advanced analytic techniques for raw material valuation |
| JP2018509594A (en) | 2015-01-05 | 2018-04-05 | サウジ アラビアン オイル カンパニー | Relative evaluation method of naphtha flow |
| US10401344B2 (en) | 2015-01-05 | 2019-09-03 | Saudi Arabian Oil Company | Characterization of crude oil and its fractions by thermogravimetric analysis |
| KR20170118714A (en) | 2015-01-05 | 2017-10-25 | 사우디 아라비안 오일 컴퍼니 | Characterization of crude oil by ultraviolet visible light spectroscopy |
| EP3243067B1 (en) | 2015-01-05 | 2020-04-08 | Saudi Arabian Oil Company | Characterization of crude oil by near infrared spectroscopy |
| US9709545B2 (en) * | 2015-07-23 | 2017-07-18 | Tesoro Refining & Marketing Company LLC | Methods and apparatuses for spectral qualification of fuel properties |
| EP3387426B1 (en) | 2015-12-10 | 2021-11-03 | ExxonMobil Research and Engineering Company | Rapid estimation of oil feedstock potential for lubricant base oil formation |
| EP3285190B1 (en) | 2016-05-23 | 2025-07-23 | Thermo Finnigan LLC | Systems and methods for sample comparison and classification |
| US10696906B2 (en) | 2017-09-29 | 2020-06-30 | Marathon Petroleum Company Lp | Tower bottoms coke catching device |
| US12000720B2 (en) | 2018-09-10 | 2024-06-04 | Marathon Petroleum Company Lp | Product inventory monitoring |
| SG10201900755WA (en) * | 2019-01-28 | 2020-08-28 | Wilmar International Ltd | Methods and system for processing lipid contents of at least one oil sample and simulating at least one training sample, and for predicting a blending formula, amongst others |
| US12031676B2 (en) | 2019-03-25 | 2024-07-09 | Marathon Petroleum Company Lp | Insulation securement system and associated methods |
| US11975316B2 (en) | 2019-05-09 | 2024-05-07 | Marathon Petroleum Company Lp | Methods and reforming systems for re-dispersing platinum on reforming catalyst |
| CA3212048A1 (en) | 2019-05-30 | 2020-11-30 | Marathon Petroleum Company Lp | Methods and systems for minimizing nox and co emissions in natural draft heaters |
| KR102814913B1 (en) * | 2019-10-02 | 2025-05-30 | 삼성전자주식회사 | Response inference method and apparatus |
| CA3109606C (en) | 2020-02-19 | 2022-12-06 | Marathon Petroleum Company Lp | Low sulfur fuel oil blends for paraffinic resid stability and associated methods |
| US20250012744A1 (en) | 2021-02-25 | 2025-01-09 | Marathon Petroleum Company Lp | Methods and assemblies for enhancing control of refining processes using spectroscopic analyzers |
| US11898109B2 (en) | 2021-02-25 | 2024-02-13 | Marathon Petroleum Company Lp | Assemblies and methods for enhancing control of hydrotreating and fluid catalytic cracking (FCC) processes using spectroscopic analyzers |
| US12461022B2 (en) | 2021-02-25 | 2025-11-04 | Marathon Petroleum Company Lp | Methods and assemblies for determining and using standardized spectral responses for calibration of spectroscopic analyzers |
| US11905468B2 (en) | 2021-02-25 | 2024-02-20 | Marathon Petroleum Company Lp | Assemblies and methods for enhancing control of fluid catalytic cracking (FCC) processes using spectroscopic analyzers |
| US12473500B2 (en) | 2021-02-25 | 2025-11-18 | Marathon Petroleum Company Lp | Assemblies and methods for enhancing control of fluid catalytic cracking (FCC) processes using spectroscopic analyzers |
| US11702600B2 (en) | 2021-02-25 | 2023-07-18 | Marathon Petroleum Company Lp | Assemblies and methods for enhancing fluid catalytic cracking (FCC) processes during the FCC process using spectroscopic analyzers |
| US11692141B2 (en) | 2021-10-10 | 2023-07-04 | Marathon Petroleum Company Lp | Methods and systems for enhancing processing of hydrocarbons in a fluid catalytic cracking unit using a renewable additive |
| US11802257B2 (en) | 2022-01-31 | 2023-10-31 | Marathon Petroleum Company Lp | Systems and methods for reducing rendered fats pour point |
| US12354712B2 (en) | 2022-02-28 | 2025-07-08 | Saudi Arabian Oil Company | Method to prepare virtual assay using nuclear magnetic resonance spectroscopy |
| US11781988B2 (en) | 2022-02-28 | 2023-10-10 | Saudi Arabian Oil Company | Method to prepare virtual assay using fluorescence spectroscopy |
| US11913332B2 (en) | 2022-02-28 | 2024-02-27 | Saudi Arabian Oil Company | Method to prepare virtual assay using fourier transform infrared spectroscopy |
| US12243627B2 (en) | 2022-02-28 | 2025-03-04 | Saudi Arabian Oil Company | Method to prepare virtual assay using Fourier transform ion cyclotron resonance mass spectroscopy |
| US12311305B2 (en) | 2022-12-08 | 2025-05-27 | Marathon Petroleum Company Lp | Removable flue gas strainer and associated methods |
| CA3238046A1 (en) | 2023-05-12 | 2025-07-07 | Marathon Petroleum Company Lp | Systems, apparatuses, and methods for sample cylinder inspection, pressurization, and sample disposal |
| US12533615B2 (en) | 2023-06-02 | 2026-01-27 | Marathon Petroleum Company Lp | Methods and systems for reducing contaminants in a feed stream |
| US12415962B2 (en) | 2023-11-10 | 2025-09-16 | Marathon Petroleum Company Lp | Systems and methods for producing aviation fuel |
| US12599848B2 (en) | 2024-06-03 | 2026-04-14 | Marathon Petroleum Company Lp | Systems, analyzers, controllers, and associated methods to enhance fluid separation for distillation operations |
Family Cites Families (11)
| Publication number | Priority date | Publication date | Assignee | Title |
|---|---|---|---|---|
| CA1219631A (en) * | 1985-06-14 | 1987-03-24 | Marc-Andre Poirier | Process for the separation of sulphur compounds in bitumen, heavy oil and synthetic fuel distillates |
| US4800279A (en) * | 1985-09-13 | 1989-01-24 | Indiana University Foundation | Methods and devices for near-infrared evaluation of physical properties of samples |
| DE3855720T2 (en) * | 1987-08-18 | 1997-05-22 | Bp Oil Int | Method for the direct determination of the physical properties of hydrocarbon products |
| US5119315A (en) * | 1989-04-28 | 1992-06-02 | Amoco Corporation | Method of correlating a record of sample data with a record of reference data |
| JPH0750101B2 (en) * | 1989-09-13 | 1995-05-31 | 株式会社コスモ総合研究所 | Method and apparatus for measuring cetane number or cetane index |
| US5218529A (en) * | 1990-07-30 | 1993-06-08 | University Of Georgia Research Foundation, Inc. | Neural network system and methods for analysis of organic materials and structures using spectral data |
| US5121337A (en) * | 1990-10-15 | 1992-06-09 | Exxon Research And Engineering Company | Method for correcting spectral data for data due to the spectral measurement process itself and estimating unknown property and/or composition data of a sample using such method |
| MY107650A (en) * | 1990-10-12 | 1996-05-30 | Exxon Res & Engineering Company | Method of estimating property and / or composition data of a test sample |
| US5412581A (en) * | 1992-11-05 | 1995-05-02 | Marathon Oil Company | Method for measuring physical properties of hydrocarbons |
| US5424959A (en) * | 1993-07-19 | 1995-06-13 | Texaco Inc. | Interpretation of fluorescence fingerprints of crude oils and other hydrocarbon mixtures using neural networks |
| US5360972A (en) * | 1993-08-17 | 1994-11-01 | Western Atlas International, Inc. | Method for improving chemometric estimations of properties of materials |
-
1995
- 1995-06-23 US US08/494,643 patent/US5699270A/en not_active Expired - Lifetime
-
1996
- 1996-05-17 AU AU59222/96A patent/AU698197B2/en not_active Expired
- 1996-05-17 WO PCT/US1996/007174 patent/WO1997000926A1/en not_active Ceased
- 1996-05-17 JP JP50383597A patent/JP3767905B2/en not_active Expired - Lifetime
- 1996-05-17 EP EP96916493A patent/EP0833878B1/en not_active Expired - Lifetime
- 1996-05-17 DE DE69613373T patent/DE69613373T2/en not_active Expired - Lifetime
-
1997
- 1997-12-19 NO NO19976005A patent/NO322581B1/en not_active IP Right Cessation
Also Published As
| Publication number | Publication date |
|---|---|
| US5699270A (en) | 1997-12-16 |
| DE69613373D1 (en) | 2001-07-19 |
| NO976005D0 (en) | 1997-12-19 |
| WO1997000926A1 (en) | 1997-01-09 |
| AU5922296A (en) | 1997-01-22 |
| NO322581B1 (en) | 2006-10-30 |
| NO976005L (en) | 1998-02-20 |
| EP0833878A1 (en) | 1998-04-08 |
| JP3767905B2 (en) | 2006-04-19 |
| AU698197B2 (en) | 1998-10-29 |
| DE69613373T2 (en) | 2002-04-25 |
| JPH11508298A (en) | 1999-07-21 |
Similar Documents
| Publication | Publication Date | Title |
|---|---|---|
| AU698197B2 (en) | Method for preparing lubrication oils (Law232) | |
| EP0871976B1 (en) | Method for preparing blend products | |
| EP0834071B1 (en) | Method for predicting chemical or physical properties of crude oils | |
| EP0871936B1 (en) | Method for predicting chemical or physical properties of complex mixtures | |
| DE69623513T2 (en) | Method for characterizing hydrocarbons using infrared spectroscopy | |
| DE69107467T3 (en) | Device and method for the analysis of hydrocarbons by spectroscopy in the near infrared range. | |
| DE3855720T2 (en) | Method for the direct determination of the physical properties of hydrocarbon products | |
| US5808180A (en) | Direct method for determination of true boiling point distillation profiles of crude oils by gas chromatography/mass spectrometry | |
| EP3861320B1 (en) | Systems and methods for implicit chemical resolution of vacuum gas oils and fit quality determination | |
| US7153694B2 (en) | Quantitative method for hydrocarbon analysis | |
| WO2020257277A1 (en) | System and method for characterizing crude oil and its derivatives by combining total sulfur determination and ft-icr mass spectrometry | |
| CA2220660C (en) | Method for preparing lubricating oils |
Legal Events
| Date | Code | Title | Description |
|---|---|---|---|
| PUAI | Public reference made under article 153(3) epc to a published international application that has entered the european phase |
Free format text: ORIGINAL CODE: 0009012 |
|
| 17P | Request for examination filed |
Effective date: 19980119 |
|
| AK | Designated contracting states |
Kind code of ref document: A1 Designated state(s): BE DE FR GB IT NL |
|
| 17Q | First examination report despatched |
Effective date: 19990305 |
|
| GRAG | Despatch of communication of intention to grant |
Free format text: ORIGINAL CODE: EPIDOS AGRA |
|
| GRAG | Despatch of communication of intention to grant |
Free format text: ORIGINAL CODE: EPIDOS AGRA |
|
| GRAH | Despatch of communication of intention to grant a patent |
Free format text: ORIGINAL CODE: EPIDOS IGRA |
|
| RAP1 | Party data changed (applicant data changed or rights of an application transferred) |
Owner name: EXXONMOBIL RESEARCH AND ENGINEERING COMPANY |
|
| GRAH | Despatch of communication of intention to grant a patent |
Free format text: ORIGINAL CODE: EPIDOS IGRA |
|
| GRAA | (expected) grant |
Free format text: ORIGINAL CODE: 0009210 |
|
| AK | Designated contracting states |
Kind code of ref document: B1 Designated state(s): BE DE FR GB IT NL |
|
| REF | Corresponds to: |
Ref document number: 69613373 Country of ref document: DE Date of ref document: 20010719 |
|
| ITF | It: translation for a ep patent filed | ||
| ET | Fr: translation filed | ||
| REG | Reference to a national code |
Ref country code: GB Ref legal event code: IF02 |
|
| PLBE | No opposition filed within time limit |
Free format text: ORIGINAL CODE: 0009261 |
|
| STAA | Information on the status of an ep patent application or granted ep patent |
Free format text: STATUS: NO OPPOSITION FILED WITHIN TIME LIMIT |
|
| 26N | No opposition filed | ||
| REG | Reference to a national code |
Ref country code: FR Ref legal event code: PLFP Year of fee payment: 20 |
|
| PGFP | Annual fee paid to national office [announced via postgrant information from national office to epo] |
Ref country code: GB Payment date: 20150424 Year of fee payment: 20 Ref country code: DE Payment date: 20150601 Year of fee payment: 20 |
|
| PGFP | Annual fee paid to national office [announced via postgrant information from national office to epo] |
Ref country code: NL Payment date: 20150512 Year of fee payment: 20 Ref country code: FR Payment date: 20150424 Year of fee payment: 20 Ref country code: BE Payment date: 20150511 Year of fee payment: 20 Ref country code: IT Payment date: 20150513 Year of fee payment: 20 |
|
| REG | Reference to a national code |
Ref country code: DE Ref legal event code: R071 Ref document number: 69613373 Country of ref document: DE |
|
| REG | Reference to a national code |
Ref country code: NL Ref legal event code: MK Effective date: 20160516 |
|
| REG | Reference to a national code |
Ref country code: GB Ref legal event code: PE20 Expiry date: 20160516 |
|
| PG25 | Lapsed in a contracting state [announced via postgrant information from national office to epo] |
Ref country code: GB Free format text: LAPSE BECAUSE OF EXPIRATION OF PROTECTION Effective date: 20160516 |