EP0826949A2 - Identification of resonant frequencies of vibration of rotating blades - Google Patents
Identification of resonant frequencies of vibration of rotating blades Download PDFInfo
- Publication number
- EP0826949A2 EP0826949A2 EP97306171A EP97306171A EP0826949A2 EP 0826949 A2 EP0826949 A2 EP 0826949A2 EP 97306171 A EP97306171 A EP 97306171A EP 97306171 A EP97306171 A EP 97306171A EP 0826949 A2 EP0826949 A2 EP 0826949A2
- Authority
- EP
- European Patent Office
- Prior art keywords
- frequency
- measurement
- blade
- vibration
- response
- Prior art date
- Legal status (The legal status is an assumption and is not a legal conclusion. Google has not performed a legal analysis and makes no representation as to the accuracy of the status listed.)
- Granted
Links
Images




Classifications
-
- G—PHYSICS
- G01—MEASURING; TESTING
- G01H—MEASUREMENT OF MECHANICAL VIBRATIONS OR ULTRASONIC, SONIC OR INFRASONIC WAVES
- G01H13/00—Measuring resonant frequency
-
- G—PHYSICS
- G01—MEASURING; TESTING
- G01H—MEASUREMENT OF MECHANICAL VIBRATIONS OR ULTRASONIC, SONIC OR INFRASONIC WAVES
- G01H1/00—Measuring characteristics of vibrations in solids by using direct conduction to the detector
- G01H1/003—Measuring characteristics of vibrations in solids by using direct conduction to the detector of rotating machines
- G01H1/006—Measuring characteristics of vibrations in solids by using direct conduction to the detector of rotating machines of the rotor of turbo machines
Definitions
- the invention relates to a method and apparatus for determining the resonant frequencies of vibration of rotating blades, particularly those in turbo-machines.
- synchronous vibration the synchronous response of the blades.
- the synchronous response can be characterised by its amplitude and its frequency, with the frequency always being equal to the assembly rotation frequency multiplied by an integer known as the order of the response.
- Turbine blades have a tendency to vibrate at large amplitudes at certain natural or resonant frequencies. These resonant frequencies would usually be associated with a particular natural movement of the blade or combination of movements of the blade. For example, one resonant frequency might represent vibration of the blade along the rotational axis of the turbine and another might represent vibration perpendidicular to the rotational axis of the turbine.
- the assembly rotation frequency has harmonics which coincide with any of the resonant frequencies of vibration of the turbine blades, synchronous vibrations will occur at these resonant frequencies. Thus, the amplitudes of the synchronous vibrations will be high.
- the difference between the expected arrival time and the actual arrival time can be multiplied by the turbine blade tip velocity to give the displacement of the blade from its expected position.
- Data from a plurality of sensors can be processed to obtain the amplitudes and frequencies of vibration of the blades.
- the maximum synchronous response amplitude can be derived using measurements taken from a single sensor (Zablotskiy,I. Ye. and Korostelev, Yu. A., "Measurement of Resonance Vibrations of Turbine Blades with the ELURA Device” , Energomashinostroneniye, pp 36-39, 1970). However, no response frequency information can be derived from this single sensor measurement.
- the invention provides a method for determining a resonant frequency of vibration of a rotating blade, the method comprising the steps of: determining the approximate resonance frequency; rotating the blade at each of a plurality of frequencies in a range from below to above the approximate resonance frequency; and at each frequency: taking a first measurement P 1 representative of synchronous vibrational amplitude at a first point, and taking a second measurement P 2 representative of synchronous vibrational amplitude at a second point wherein the first and second points are separated by an angle ⁇ swept by the blade; and wherein the rotating blade undergoes an unknown number x of complete synchronous vibrations between the first and second points; to provide a set of data comprising the plurality of frequencies and for each frequency a measurement P 1 and a measurement P 2 , wherein if a plot of P 1 against P 2 is produced, certain characteristics of the plot depend on x; analysing the set of data to determine a likely value of x; and from x and ⁇ calculating the resonant frequency of vibration.
- the range of frequencies over which the analysis should take place can be determined from a plot of response amplitude at a single measurement point against frequency. This plot shows the range of frequencies over which the resonant vibration is excited
- the analysis of the set of data involves plotting P 1 against P 2 for a range of different blade rotational frequencies and analysing the resulting shape.
- the resulting shape can be approximated to an ellipse (although it is not a true ellipse) whose axis ratio can be related to the measurement point separation, where measurement point separation in radians is equal to 2 ⁇ x (i.e. the measurement point separation in radians is equal to 2 ⁇ multiplied by the number of vibrational wavelengths between the first and second points) .
- the relationship between axis ratio and measurement point separation may have been worked out previously using finite element analysis techniques, or experimental methods.
- response frequency E ⁇ 60 Hz
- ⁇ is the mean rotational speed of the blade, in revolutions per minute, over which the response occurs.
- the invention also provides apparatus for determining a resonant frequency of vibration of a rotating blade, the apparatus comprising: a first sensor for taking a first measurement P 1 representative of synchronous vibrational amplitude of a rotating blade at a first point: a second sensor for taking a second measurement P 2 representative of synchronous vibrational amplitude of the rotating blade at a second point, wherein the first and second points are separated by an angle ⁇ swept by the blade; and wherein there are an unknown number x of synchronous vibration wavelengths between the first and second points; means for storing the measurements from the first and second sensors as a set of data comprising the plurality of frequencies and for each frequency a measurement P 1 and a measurement P 2 , wherein if a plot of P 1 against P 2 is produced, certain characteristics of the plot depend on x; and means for calculating from x and ⁇ the resonant frequency of vibration.
- Blade Tip Response Amplitude, X (A( ⁇ ) sin ( ⁇ t+ ⁇ ( ⁇ )) where A( ⁇ ) is the response amplitude function where A( ⁇ ) is the response amplitude function and and ⁇ ( ⁇ ) is the response phase where K is the response amplitude scaling factor ⁇ o is the single degree of freedom undamped resonance frequency (SDOF) (radians/s) ; ⁇ is the assembly excitation frequency (radians/s) ; and Q is the SDOF resonance Q factor.
- SDOF single degree of freedom undamped resonance frequency
- the blade tip vibration describes a sine wave, with a maximum amplitude of A( ⁇ ).
- the blade tip vibration lags or leads the assembly excitation by an amount ⁇ ( ⁇ ).
- the frequency of vibration of the blade tip is always equal to E times the frequency of rotation of the blade or assembly excitation frequency.
- the path labelled 1 represents a blade tip undergoing no vibration
- the path labelled 2 the blade tip undergoing synchronous vibration of order 4.
- the blade tip is always at the same location on its sine wave. For example, at point (a) in Figure 2, the blade tip will always be at its maximum amplitude of vibration, while at point (b) it will always be much nearer its mid point. Therefore, for a particular assembly excitation frequency the observed blade tip response at point (a) or point (b) does not depend on the time at which it is recorded.
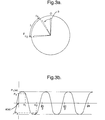
- Figures 3A and 3B represent a blade undergoing an order E vibration, where E is equal to 3. We are considering the response of a single blade 3 as it rotates and undergoes synchronous vibrations.
- the response is not dependent upon time, as explained previously.
- each particular rotational frequency produces a different value of P 1 and P 2 . This is because the blade vibrational amplitude and phase depends upon blade rotation frequency (Equations (2) and (3)).
- each different frequency produces a point on a graph and the points for a range of frequencies around resonance have been found to describe a loop.
- Figure 4 shows plots of P 1 against P 2 obtained from a tip probe arrival time simulator using an assembly response from a finite element model for various probe separations. Each point on the loops represents a reading of P 1 and P 2 at a different assembly excitation frequency. All assembly excitation frequencies on the loop are quite near a resonant frequency; frequencies far from resonance produce dots around the origin.
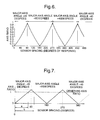
- the two parameter plots obtained using the model for different measurement point separation were analysed as follows. First the major axis and major axis angle were found by considering the straight line distance between all points in the plot. Secondly a linear transformation which placed the mid point of the major axis at the origin in the XY plane and aligned the major axis with the X axis was applied to all points in the plot. The length of the major axis was taken as the difference between the maximum and minimum X values in the transformed plot and the length of the minor axis was taken as the maximum difference between the maximum and minimum Y values at a given X value in the transformed plot. From the resulting minor and major axis lengths the axis ratio was calculated.
- the graph of Figure 6 can be approximated to a straight line graph as shown in Figure 7.
- Axis ratio and major axis angle can be determined from a two parameter plot and, using Figure 7, measurement point separation can then be derived.
- the order of the response, E is a ⁇ .
- E must always be a positive integer greater than or equal to 1. If a number of values of ⁇ satisfy this condition, knowledge of the expected response is necessary to identify the most probable response frequency.
- Measurement point separation px (Axis ratio) 3 +Qx (Axis ratio) 2 +Rx(Axis ratio)+S where the polynomial coefficients for each of the four regions are as follows: Region P Q R S 1 -7.22644 -21.82787 119.08946 -0.16976 2 7.27262 21.84211 -119.16418 180.17559 3 -7.28363 -21.82579 119.15622 179.82559 4 7.21876 21.84879 -119.10273 360.17127
- the synchronous vibrational response of the blades has a frequency which is an integral multiple of the excitation frequency.
- the measurement point separation should not depend upon excitation frequency, although the amplitude measurements P 1 and P 2 change with frequency.
- Peak response amplitude Axis Ratio Major Axis Angle (degrees) Assembly tip radius ( Relative response amplitude) 0.00014 0.7003 45.06 0.0014 0.7019 45.08 0.014 0.718 45.33 0.042 0.759 46.74
- Figures 8A and 8B show the calculated measurement point separation as the assembly excitation frequency is taken from below to above resonance, for a nominal measurement point separation of ⁇ / 2 . It can be seen that when the relative response amplitude is low (0.00014 in Figure 8A) the calculated measurement point separation stays very close to the nominal value. When the relative response amplitude is high (0.042 in Figure 8B), the calculated measurement point separation varies from around 1.5 radians just before resonance to around 1.64 just after resonance.
- the response amplitude can be determined to an accuracy of ⁇ 10% using prior art methods, taking readings from a single sensor. Therefore, the effect of relative response amplitude can be partially corrected.
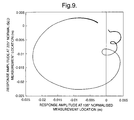
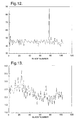
- Figure 10 shows a plot of the two tip timing response measurements for a single blade. The two parameter plots for all blades were analysed and Figures 12 and 13 show the axis angle and response order derived from the plot axis ratio and ratio to angular separation curve of Figure 6.
- Figure 10 illustrates the blade with the largest response amplitude in the experimentally acquired data set. Mistuning results in varying response levels between blades.
- Figure 11 shows the two parameter plot for the lowest response amplitude blade - analysis of this plot will be inaccurate. Practical application of the method will require processing of the plots prior to extracting the axis ratio and angle technique.
Landscapes
- Physics & Mathematics (AREA)
- General Physics & Mathematics (AREA)
- Measurement Of Mechanical Vibrations Or Ultrasonic Waves (AREA)
- Turbine Rotor Nozzle Sealing (AREA)
Abstract
Description
taking a first measurement P1 representative of synchronous vibrational amplitude at a first point, and taking a second measurement P2 representative of synchronous vibrational amplitude at a second point wherein the first and second points are separated by an angle β swept by the blade; and wherein the rotating blade undergoes an unknown number x of complete synchronous vibrations between the first and second points;
to provide a set of data comprising the plurality of frequencies and for each frequency a measurement P1 and a measurement P2, wherein if a plot of P1 against P2 is produced, certain characteristics of the plot depend on x; analysing the set of data to determine a likely value of x; and from x and β calculating the resonant frequency of vibration.
Amplitude,
where A(ω) is the response amplitude function
and


ωo is the single degree of freedom undamped resonance frequency (SDOF) (radians/s) ;
ω is the assembly excitation frequency (radians/s) ; and
Q is the SDOF resonance Q factor.
first point,
second point,
- Major axis:
- line connecting two points on plot separated by the maximum straight line distance;
- Minor axis:
- maximum separation of points on plot, normal to major axis;
- Major axis angle:
- angle between major axis and horizontal response parameter axis, and
- Axis ratio:
- Length of minor axis / Length of major axis
β. For example, if the measurement point separation α were 2π. it would represent precisely one wavelength of the blade tip vibration. If the measurement points were separated by an angle β of 120° on the assembly casing, this would mean that there were three complete blade tip vibrations in any one rotation of the blade assembly. Hence the order E would be 3. This would make the response frequency equal to three times the assembly excitation frequency at which the resonance occurs. This assembly excitation frequency is determined from the mean rotation speed, Ω in rpm, over which the response occurs.
| Region | Measurement Point Separation Range |
| 1 | 0 - 90° |
| 2 | 90° - 180° |
| 3 | 180° to 270° |
| 4 | 270° to 360° |
| Region | P | Q | R | S |
| 1 | -7.22644 | -21.82787 | 119.08946 | -0.16976 |
| 2 | 7.27262 | 21.84211 | -119.16418 | 180.17559 |
| 3 | -7.28363 | -21.82579 | 119.15622 | 179.82559 |
| 4 | 7.21876 | 21.84879 | -119.10273 | 360.17127 |
| Peak response amplitude | Axis Ratio | Major Axis Angle (degrees) |
| Assembly tip radius (=Relative response amplitude) | ||
| 0.00014 | 0.7003 | 45.06 |
| 0.0014 | 0.7019 | 45.08 |
| 0.014 | 0.718 | 45.33 |
| 0.042 | 0.759 | 46.74 |
Claims (9)
- A method for determining a resonant frequency of vibration of a rotating blade, the method comprising the steps of:to provide a set of data comprising the plurality of frequencies and for each frequency a measurement P1 and a measurement P2, wherein if a plot of P1 against P2 is produced, certain characteristics of the plot depend on x; analysing the set of data to determine a likely value of x; and from x and β calculating the resonant frequency of vibration.determining the approximate resonance frequency;rotating the blade at each of a plurality of frequencies in a range from below to above the approximate resonance frequency; and at each frequency:
taking a first measurement P1 representative of synchronous vibrational amplitude at a first point, and taking a second measurement P2 representative of synchronous vibrational amplitude at a second point wherein the first and second points are separated by an angle β swept by the blade; and wherein there are an unknown number x of complete synchronous vibrations between the first and second points; - A method according to claim 1 wherein the analysis of the set of data involves plotting P2 against P1 for a range of different frequencies and analysing the resulting shape.
- A method according to claim 2 wherein the resulting shape can be approximated to an ellipse and the analysis involves a determination of the axis ratio and major axis angle of the shape.
- A method according to claim 3 wherein the analysis involves the use of a graph relating axis ratio to measurement point separation, where measurement point separation in radians is equal to 2πx.
- A method according to claim 4 wherein the graph is prepared using finite element analysis to determine the relationship between axis ratio and measurement point separation.
- A method according to any preceding claim wherein the order of the synchronous vibrations is determined, the order E being equal to 2πx / β
- A method according to claim 6 where the vibrational frequency of the resonance is calculated according to the following equation:
- Apparatus for determining a resonant frequency of vibration of a rotating blade, the apparatus comprising:means for storing the measurements from the first and second sensors as a set of data comprising the plurality of frequencies and for each frequency a measurement P1 and a measurement P2, wherein if a plot of P1 against P2 is produced, certain characteristics of the plot depend on x; anda first sensor for taking a first measurement P1 representative of synchronous vibrational amplitude of a rotating blade at a first point;a second sensor for taking a second measurement P2 representative of synchronous vibrational amplitude of the rotating blade at a second point, wherein the first and second points are separated by an angle β swept by the blade; and wherein there are rotating an unknown number x of synchronous vibration wavelengths between the first and second points;
means for calculating from x and β the resonant frequency of vibration. - Apparatus according to claim 8 for carrying out a method according to any of claims 1 to 7.
Applications Claiming Priority (2)
| Application Number | Priority Date | Filing Date | Title |
|---|---|---|---|
| GBGB9618096.3A GB9618096D0 (en) | 1996-08-29 | 1996-08-29 | Identification of resonant frequencies of vibration of rotating blades |
| GB9618096 | 1996-08-29 |
Publications (3)
| Publication Number | Publication Date |
|---|---|
| EP0826949A2 true EP0826949A2 (en) | 1998-03-04 |
| EP0826949A3 EP0826949A3 (en) | 2000-12-06 |
| EP0826949B1 EP0826949B1 (en) | 2002-11-06 |
Family
ID=10799148
Family Applications (1)
| Application Number | Title | Priority Date | Filing Date |
|---|---|---|---|
| EP97306171A Expired - Lifetime EP0826949B1 (en) | 1996-08-29 | 1997-08-13 | Identification of resonant frequencies of vibration of rotating blades |
Country Status (4)
| Country | Link |
|---|---|
| US (1) | US5974882A (en) |
| EP (1) | EP0826949B1 (en) |
| DE (1) | DE69716843T2 (en) |
| GB (1) | GB9618096D0 (en) |
Cited By (1)
| Publication number | Priority date | Publication date | Assignee | Title |
|---|---|---|---|---|
| WO2009034476A2 (en) | 2007-04-30 | 2009-03-19 | Nuovo Pignone, S.P.A. | Method and system for turbine blade characterization |
Families Citing this family (24)
| Publication number | Priority date | Publication date | Assignee | Title |
|---|---|---|---|---|
| AUPO359096A0 (en) * | 1996-11-13 | 1996-12-05 | Lonsdale, Anthony | Apparatus for tracking resonant frequency |
| US6679121B2 (en) | 2000-07-07 | 2004-01-20 | Test Devices, Inc. | Blade vibration test apparatus and method |
| JP3530474B2 (en) | 2000-09-22 | 2004-05-24 | 三菱重工業株式会社 | Wing vibration measurement method and wing vibration monitoring system using the same |
| US6814543B2 (en) * | 2002-12-30 | 2004-11-09 | General Electric Company | Method and apparatus for bucket natural frequency tuning |
| US7317994B2 (en) * | 2005-08-10 | 2008-01-08 | General Electric Company | Method and apparatus for signal signature analysis for event detection in rotating machinery |
| US7987725B2 (en) * | 2007-09-21 | 2011-08-02 | Siemens Energy, Inc. | Method of matching sensors in a multi-probe turbine blade vibration monitor |
| US7775114B2 (en) * | 2007-09-26 | 2010-08-17 | Siemens Energy, Inc. | Method of on-line turbine blade slope and sensor position verification |
| WO2009097055A2 (en) * | 2007-12-13 | 2009-08-06 | Alliance For Sustainable Energy, Llc | Wind turbine blade testing system using base excitation |
| WO2009135136A2 (en) * | 2008-05-02 | 2009-11-05 | Alliance For Sustainable Energy, Llc | Base excitation testing system using spring elements to pivotally mount wind turbine blades |
| US8676514B2 (en) | 2010-06-29 | 2014-03-18 | General Electric Company | System and method for monitoring health of airfoils |
| US8543341B2 (en) | 2010-06-29 | 2013-09-24 | General Electric Company | System and method for monitoring health of airfoils |
| GB0822859D0 (en) * | 2008-12-16 | 2009-01-21 | Rolls Royce Plc | Timing analysis |
| GB2491632B (en) * | 2011-06-10 | 2013-10-30 | Rolls Royce Plc | Rotating blade analysis |
| US9014460B2 (en) * | 2011-11-07 | 2015-04-21 | Siemens Energy, Inc. | Apparatus to measure blade vibration in a turbine engine based on series of images exposed by an imager in response to a sequence of illumination bursts |
| US9395270B2 (en) | 2012-10-19 | 2016-07-19 | Florida Power & Light Company | Method and system for monitoring rotor blades in combustion turbine engine |
| EP2749740B1 (en) | 2012-11-30 | 2018-10-10 | General Electric Company | System and method for monitoring health of airfoils |
| US9657588B2 (en) | 2013-12-26 | 2017-05-23 | General Electric Company | Methods and systems to monitor health of rotor blades |
| US9869190B2 (en) | 2014-05-30 | 2018-01-16 | General Electric Company | Variable-pitch rotor with remote counterweights |
| US10072510B2 (en) | 2014-11-21 | 2018-09-11 | General Electric Company | Variable pitch fan for gas turbine engine and method of assembling the same |
| US10100653B2 (en) | 2015-10-08 | 2018-10-16 | General Electric Company | Variable pitch fan blade retention system |
| US11674435B2 (en) | 2021-06-29 | 2023-06-13 | General Electric Company | Levered counterweight feathering system |
| US11795964B2 (en) | 2021-07-16 | 2023-10-24 | General Electric Company | Levered counterweight feathering system |
| US12601271B2 (en) | 2022-10-21 | 2026-04-14 | General Electric Company | Variable pitch fan of a gas turbine engine |
| CN116577050A (en) * | 2023-05-11 | 2023-08-11 | 中国航发沈阳发动机研究所 | A test method for dynamic damping ratio of rotor blades of aeroengine compressor |
Family Cites Families (11)
| Publication number | Priority date | Publication date | Assignee | Title |
|---|---|---|---|---|
| DE1120709B (en) * | 1958-06-04 | 1961-12-28 | Daimler Benz Ag | Methods and devices for measuring blade vibrations, in particular in jet engines |
| GB1147737A (en) * | 1968-01-08 | 1969-04-02 | Igor Evgenievich Zablotsky | Device for measuring vibrations of wheel blades of turbine machines and a method ofmeasurement of the parameters of resonance oscillations of the blades |
| FR2485727A1 (en) * | 1980-06-24 | 1981-12-31 | Snecma | DEVICE FOR MEASURING RESONANCE FREQUENCIES OF TURBINE BLADES, COMPRESSORS AND PROPELLER BLADES |
| US4776216A (en) * | 1987-02-24 | 1988-10-11 | Westinghouse Electric Corp. | Programmable jet blade excitation system |
| CA1295018C (en) * | 1987-09-23 | 1992-01-28 | Westinghouse Electric Corporation | Method and apparatus for determining resonant frequency of a turbine blade made of a material not responsive to a magnetic field |
| US4887468A (en) * | 1988-06-03 | 1989-12-19 | Westinghouse Electic Corp. | Nonsynchronous turbine blade vibration monitoring system |
| US4934192A (en) * | 1988-07-11 | 1990-06-19 | Westinghouse Electric Corp. | Turbine blade vibration detection system |
| US5152172A (en) * | 1989-03-23 | 1992-10-06 | Electric Power Research Institute | Operating turbine resonant blade monitor |
| US4996880A (en) * | 1989-03-23 | 1991-03-05 | Electric Power Research Institute, Inc. | Operating turbine resonant blade monitor |
| US5148711A (en) * | 1990-11-01 | 1992-09-22 | Westinghouse Electric Corp. | Apparatus and method for removing common mode vibration data from digital turbine blade vibration data |
| US5206816A (en) * | 1991-01-30 | 1993-04-27 | Westinghouse Electric Corp. | System and method for monitoring synchronous blade vibration |
-
1996
- 1996-08-29 GB GBGB9618096.3A patent/GB9618096D0/en active Pending
-
1997
- 1997-08-13 EP EP97306171A patent/EP0826949B1/en not_active Expired - Lifetime
- 1997-08-13 DE DE69716843T patent/DE69716843T2/en not_active Expired - Lifetime
- 1997-08-15 US US08/912,002 patent/US5974882A/en not_active Expired - Lifetime
Cited By (4)
| Publication number | Priority date | Publication date | Assignee | Title |
|---|---|---|---|---|
| WO2009034476A2 (en) | 2007-04-30 | 2009-03-19 | Nuovo Pignone, S.P.A. | Method and system for turbine blade characterization |
| WO2009034476A3 (en) * | 2007-04-30 | 2010-03-18 | Nuovo Pignone, S.P.A. | Method and system for turbine blade characterization |
| US8353204B2 (en) | 2007-04-30 | 2013-01-15 | Nuovo Pignone, S.P.A. | Method and system for turbine blade characterization |
| CN101849169B (en) * | 2007-04-30 | 2013-05-08 | 新比隆股份公司 | Method and system for turbine blade characterization |
Also Published As
| Publication number | Publication date |
|---|---|
| DE69716843T2 (en) | 2003-02-27 |
| DE69716843D1 (en) | 2002-12-12 |
| GB9618096D0 (en) | 1996-10-09 |
| EP0826949A3 (en) | 2000-12-06 |
| EP0826949B1 (en) | 2002-11-06 |
| US5974882A (en) | 1999-11-02 |
Similar Documents
| Publication | Publication Date | Title |
|---|---|---|
| EP0826949B1 (en) | Identification of resonant frequencies of vibration of rotating blades | |
| US6584849B2 (en) | Analyzing vibration of rotating blades | |
| Dimitriadis et al. | Blade-tip timing measurement of synchronous vibrations of rotating bladed assemblies | |
| Heath et al. | A survey of blade tip-timing measurement techniques for turbomachinery vibration | |
| US5206816A (en) | System and method for monitoring synchronous blade vibration | |
| US6094989A (en) | Method and apparatus for analyzing non-synchronous blade vibrations using unevenly spaced probes | |
| EP0776464B1 (en) | Method for determining resonance information | |
| JP3530474B2 (en) | Wing vibration measurement method and wing vibration monitoring system using the same | |
| KR101718251B1 (en) | Method and system for monitoring rotating blade health | |
| US5686669A (en) | Apparatus and method for analyzing the condition and performance of turbomachines by processing signals representing rotor motion | |
| Joung et al. | Analysis of vibration of the turbine blades using non-intrusive stress measurement system | |
| US9016132B2 (en) | Rotating blade analysis | |
| US6668651B2 (en) | Method for contactless measuring of vibrations of a rotating body | |
| US6697759B2 (en) | Method of determining speed of rotation of a motor and a computer software product to carry out the method | |
| CN110259524A (en) | The device and method for measuring shrouded blade synchronous vibration and pitch diameter | |
| CN106092534B (en) | Blade modal damps measuring method | |
| US5163334A (en) | Circular saw testing technique | |
| CN88101105A (en) | Method to Eliminate Sensor Drift in Vibration Monitoring System | |
| US4078434A (en) | Method and apparatus for determining the parameters of natural vibration of a system | |
| Watkins et al. | Noncontact engine blade vibration measurements and analysis | |
| CN120873405A (en) | Rotor blade asynchronous vibration online identification method based on limited measuring points | |
| Mayo | Loose-part mass and energy estimation | |
| Bouchain et al. | New possibilities for analyzing complex asynchronous blade vibrations from tip-timing data using a sparse spectral analysis method | |
| CA2016216C (en) | Turbine generator shaft torsion monitor | |
| Li et al. | Analysis of blade vibration frequencies from blade tip timing data |
Legal Events
| Date | Code | Title | Description |
|---|---|---|---|
| PUAI | Public reference made under article 153(3) epc to a published international application that has entered the european phase |
Free format text: ORIGINAL CODE: 0009012 |
|
| AK | Designated contracting states |
Kind code of ref document: A2 Designated state(s): DE FR GB |
|
| PUAL | Search report despatched |
Free format text: ORIGINAL CODE: 0009013 |
|
| AK | Designated contracting states |
Kind code of ref document: A3 Designated state(s): AT BE CH DE DK ES FI FR GB GR IE IT LI LU MC NL PT SE |
|
| 17P | Request for examination filed |
Effective date: 20001116 |
|
| 17Q | First examination report despatched |
Effective date: 20010627 |
|
| AKX | Designation fees paid |
Free format text: DE FR GB |
|
| GRAG | Despatch of communication of intention to grant |
Free format text: ORIGINAL CODE: EPIDOS AGRA |
|
| GRAG | Despatch of communication of intention to grant |
Free format text: ORIGINAL CODE: EPIDOS AGRA |
|
| GRAH | Despatch of communication of intention to grant a patent |
Free format text: ORIGINAL CODE: EPIDOS IGRA |
|
| GRAH | Despatch of communication of intention to grant a patent |
Free format text: ORIGINAL CODE: EPIDOS IGRA |
|
| GRAA | (expected) grant |
Free format text: ORIGINAL CODE: 0009210 |
|
| AK | Designated contracting states |
Kind code of ref document: B1 Designated state(s): DE FR GB |
|
| REG | Reference to a national code |
Ref country code: GB Ref legal event code: FG4D |
|
| REF | Corresponds to: |
Ref document number: 69716843 Country of ref document: DE Date of ref document: 20021212 |
|
| ET | Fr: translation filed | ||
| PLBE | No opposition filed within time limit |
Free format text: ORIGINAL CODE: 0009261 |
|
| STAA | Information on the status of an ep patent application or granted ep patent |
Free format text: STATUS: NO OPPOSITION FILED WITHIN TIME LIMIT |
|
| 26N | No opposition filed |
Effective date: 20030807 |
|
| PGFP | Annual fee paid to national office [announced via postgrant information from national office to epo] |
Ref country code: DE Payment date: 20140827 Year of fee payment: 18 |
|
| PGFP | Annual fee paid to national office [announced via postgrant information from national office to epo] |
Ref country code: GB Payment date: 20140827 Year of fee payment: 18 Ref country code: FR Payment date: 20140818 Year of fee payment: 18 |
|
| REG | Reference to a national code |
Ref country code: DE Ref legal event code: R119 Ref document number: 69716843 Country of ref document: DE |
|
| GBPC | Gb: european patent ceased through non-payment of renewal fee |
Effective date: 20150813 |
|
| REG | Reference to a national code |
Ref country code: FR Ref legal event code: ST Effective date: 20160429 |
|
| PG25 | Lapsed in a contracting state [announced via postgrant information from national office to epo] |
Ref country code: GB Free format text: LAPSE BECAUSE OF NON-PAYMENT OF DUE FEES Effective date: 20150813 Ref country code: DE Free format text: LAPSE BECAUSE OF NON-PAYMENT OF DUE FEES Effective date: 20160301 |
|
| PG25 | Lapsed in a contracting state [announced via postgrant information from national office to epo] |
Ref country code: FR Free format text: LAPSE BECAUSE OF NON-PAYMENT OF DUE FEES Effective date: 20150831 |