EP0793155B1 - Method and equipment for determining the performance of a control valve - Google Patents
Method and equipment for determining the performance of a control valve Download PDFInfo
- Publication number
- EP0793155B1 EP0793155B1 EP96660107A EP96660107A EP0793155B1 EP 0793155 B1 EP0793155 B1 EP 0793155B1 EP 96660107 A EP96660107 A EP 96660107A EP 96660107 A EP96660107 A EP 96660107A EP 0793155 B1 EP0793155 B1 EP 0793155B1
- Authority
- EP
- European Patent Office
- Prior art keywords
- valve
- control
- control valve
- loop
- positioner
- Prior art date
- Legal status (The legal status is an assumption and is not a legal conclusion. Google has not performed a legal analysis and makes no representation as to the accuracy of the status listed.)
- Expired - Lifetime
Links
- 238000000034 method Methods 0.000 title claims description 96
- 230000008569 process Effects 0.000 claims description 74
- 238000012360 testing method Methods 0.000 claims description 28
- 238000004088 simulation Methods 0.000 claims description 16
- 230000004044 response Effects 0.000 claims description 12
- 238000004886 process control Methods 0.000 claims description 8
- 238000006243 chemical reaction Methods 0.000 claims description 2
- 238000002156 mixing Methods 0.000 claims description 2
- 238000004148 unit process Methods 0.000 description 7
- 238000005259 measurement Methods 0.000 description 6
- 238000012423 maintenance Methods 0.000 description 4
- 230000003068 static effect Effects 0.000 description 4
- 230000008901 benefit Effects 0.000 description 3
- 230000008859 change Effects 0.000 description 2
- 238000001311 chemical methods and process Methods 0.000 description 2
- 230000001276 controlling effect Effects 0.000 description 2
- 238000010586 diagram Methods 0.000 description 2
- 238000013178 mathematical model Methods 0.000 description 2
- 238000004458 analytical method Methods 0.000 description 1
- 230000003247 decreasing effect Effects 0.000 description 1
- 230000008713 feedback mechanism Effects 0.000 description 1
- 238000009434 installation Methods 0.000 description 1
- 230000010354 integration Effects 0.000 description 1
- 239000007788 liquid Substances 0.000 description 1
- 238000012545 processing Methods 0.000 description 1
- 238000003672 processing method Methods 0.000 description 1
- 230000001105 regulatory effect Effects 0.000 description 1
- 230000035945 sensitivity Effects 0.000 description 1
- 238000004513 sizing Methods 0.000 description 1
- 238000012546 transfer Methods 0.000 description 1
- KZVPFSJPLBOVLO-UHFFFAOYSA-N trimethyl(2-methylprop-1-enoxy)silane Chemical compound CC(C)=CO[Si](C)(C)C KZVPFSJPLBOVLO-UHFFFAOYSA-N 0.000 description 1
Images


Classifications
-
- G—PHYSICS
- G05—CONTROLLING; REGULATING
- G05B—CONTROL OR REGULATING SYSTEMS IN GENERAL; FUNCTIONAL ELEMENTS OF SUCH SYSTEMS; MONITORING OR TESTING ARRANGEMENTS FOR SUCH SYSTEMS OR ELEMENTS
- G05B17/00—Systems involving the use of models or simulators of said systems
- G05B17/02—Systems involving the use of models or simulators of said systems electric
-
- F—MECHANICAL ENGINEERING; LIGHTING; HEATING; WEAPONS; BLASTING
- F16—ENGINEERING ELEMENTS AND UNITS; GENERAL MEASURES FOR PRODUCING AND MAINTAINING EFFECTIVE FUNCTIONING OF MACHINES OR INSTALLATIONS; THERMAL INSULATION IN GENERAL
- F16K—VALVES; TAPS; COCKS; ACTUATING-FLOATS; DEVICES FOR VENTING OR AERATING
- F16K37/00—Special means in or on valves or other cut-off apparatus for indicating or recording operation thereof, or for enabling an alarm to be given
- F16K37/0075—For recording or indicating the functioning of a valve in combination with test equipment
- F16K37/0083—For recording or indicating the functioning of a valve in combination with test equipment by measuring valve parameters
Definitions
- This invention relates to a method for determining the performance of a control valve in a closed control loop by using a simulation model.
- the invention also relates to equipment for testing a control valve.
- a control valve and its operation is known and need not be described here in detail.
- a quarter turn valve can be for instance a ball valve or a butterfly valve. Examples of a ball valve are disclosed for instance in US patent 4 747 578.
- a control valve is actuated by means of an actuator which moves the stem of the closure member between open and closed positions.
- An actuator can be operated by means of a cylinder-piston device which in turn is regulated by means of a valve positioner which operates the actuator in response to a control signal.
- Control valves are often the most critical components in a control loop.
- Control performance of an installed control valve depends primarily on the performance of the control valve but also on process conditions. There are three important factors which have to be taken into account in checking control preformance of an installed valve. They are
- Double acting actuators are stiffer than spring return actuators because of the higher actuator pressure level. Therefore, they are less sensitive to disturbances, like dynamic torque or force, and they also give a fast valve response. It is important that the I/P (current to pressure) conversion of an electropneumatic positioner is inside the position feedback loop to compensate the errors by the feedback mechanism.
- Control valves are often oversized because all the process data are not available and safety margins are used. If a valve is oversized, only a small part of the control range is in use. Many process controllers have still 10 bit D/A converters, which means about 0.1 % resolution for the control signal. The theoretical resolution of input signal is for example 0.5 % if only one fifth of the full control range is used.
- Oversizing means poor control accuracy. For example, if the valve is oversized, then the control valve maximum relative installed gain is about 4 in a typical liquid flow application, and if at the same time absolute position error in valve travel is 0.5 %, then the maximum error in flow is 2.0 %.
- control valve installed flow characteristics and gain affect also strongly control valve dynamics and dead time. If the gain varies strongly within the process operating range, also the operating speed of the control loop varies strongly. Control valve oversizing increases control loop dead time. Gain of an oversized valve is high whereby the controller gain must be reduced to prevent control loop instability. This means that the control valve input signal changes coming from process controller are smaller, which leads to strong increase in control valve dead time. This is a significant drawback in process variability.
- the first two are the most commonly measured nonlinearities of a control valve. They are mainly caused by a backlash and a high actuator load of the valve. Backlash can be removed only by valve maintenance. An actuator load can be decreased by reducing static friction and selecting a large enough actuator.
- Dynamic perfomance of a control valve can be defined, for example, with the following factors
- the first four factors can be measured from a step response curve. Results depend a lot on the step size and the valve initial position, because dynamics of a control valve are strongly nonlinear.
- control valves have to be tested in many operating points.
- US patent publication 5 337 262 discloses an apparatus and method for testing hydraulic/pneumatic apparatus in a computer controlled test equipment.
- publication WO 95 06276 a valve positioner with improved accuracy by using dynamic feedback is disclosed.
- the modeling of chemical processes is described by B. Nilsson in a paper "Object-oriented chemical process modeling in Omola”.
- US patent publication 5 249 117 discloses a control system where an estimator is used to generate a simulation of a process according to the information it receives relating to the status of a real process.
- Other publications relating to valve control systems are US patent publications 5 109 692 and 5 261 437 and Finnish patent publication 53047.
- Different methods and systems for estimating process parameters are disclosed in US patent publications 5 172 312, 4 674 028, 5 195 026, 5 267 139 and 5 357 424.
- Process variability represents the quality of the process output of the controlling system. It can be defined in several ways, such as the maximum variability (difference between the maximum value and the minimum value within a certain measurement range); Integrated Error (IE); Integrated Absolute Error (IAE); etc.
- maximum variability difference between the maximum value and the minimum value within a certain measurement range
- IE Integrated Error
- IAE Integrated Absolute Error
- Process variability is usually measured from sampled process values that are filtered from the real output of a process transmitter.
- the easiest method is to measure the maximum variability of the process output signal.
- the second way is to calculate the control error area or an area factor between the setpoint and measured variable in a certain time scale.
- integration methods in the control literature for example ITAE, ITE, ITSE and ISTE.
- the third way to analyze process variability is to use more complicated signal processing methods.
- the object of the present invention is to provide a method for analyzing an installed control valve performance and for selecting a suitable control valve or control valve tuning for a process so that the process variability can be minimized when it is controlled by the valve.
- the equipment according to the present invention is characterized in that it comprises:
- the method of the present invention helps to determine control performance of a control valve with respect to process variability. It is applied in analyzing the control valve nonlinearities and dynamics in a process control loop. The method also helps to define the most critical nonlinearities when the process loop is known.
- Control valve performance has a strong influence on process variability. This control performance has to be known in optimizing the loop performance.
- a real control valve is connected to a simulated control loop consisting of a process controller, unit process and transmitter.
- the simulation models are selected from a model library.
- the system helps in analyzing the installed control valve performance in a process control loop.
- the process variability testing system estimates the control valve performance with the help of only one parameter: process variability.
- the main advantage of the system is the clear view of control valve performance and condition in a certain control loop.
- the meanings of conventional tests like dead band, dead time, hysteresis, speed of response, repeatability, linearity etc. on loop performance are not well defined. In fact, the system makes the tests and use of these factors unnecessary.
- the parameters of a closed control loop are defined in a case of a known control valve by modelling the process and other members of the closed control loop except the control valve.
- a control valve includes so many nonlinearities that it is not feasible to reliably model each valve of different types and sizes. Because of that, a real valve is used when defining the parameters.
- the algorithms of the models and the I/O card of the computer can be made so fast that the controlling process will be in real time.
- the process variability testing system is a tool for evaluating the loop performance without a real process.
- loop performance can be tested without any real process, it means that the control loop performance can be estimated even before the installation of the valve. It is difficult to know beforehand without simulations or measurements how critical component the control valve actually is in a certain process application.
- the conventional tests like dead band test and the speed of response test, are not adequate in analyzing the performance of an installed control valve, especially when the control loop usually is closed.
- the process variability testing system simulates the closed process loop with a real control valve and it gives easy-to-use acceptance criteria to different applications.
- Control valve performance has a strong influence on process variability.
- the quality of control valve performance is not easy to determine with conventional static and dynamic tests. Factors like installed flow characteristic and gain cannot be taken into account with the conventional tests.
- the new process variability testing system eliminates these drawbacks.
- the main advantage of the new testing system is simplicity because it estimates the control valve performance with the help of only one of the most critical parameters: process variability.
- process variability The clear view of installed control valve performance and condition in certain control loops together with and easy-to-use graphic user interface offer advantages beyond the existing systems.
- the process variability testing system is an effective analyzing tool in control valve maintenance and selection. With the help of the new system, it is also easy to set acceptance criteria for different applications.
- Fig. 1 shows the calculated dead time in seconds as a function of relative input change, and points x show the measured values. It can be seen that small relative input signal changes lead to dramatically longer dead times.
- the system used in the present invention is based on a personnal computer testing system, real control valve and control loop simulator.
- the computer controls a real control valve and measures the valve response, as shown in Fig. 2. Only the position of the valve is measured.
- the system simulates a simple unit process, a process controller, a process transmitter and disturbances. The inherent flow characteristic of the valve and the pipeline behaviour are also modelled in the system.
- unit process models such as tank level loops, flow control loops, pressure control loops, temperature control loops and blending loops, in a model library.
- An operator can compare different process controllers and tuning. Disturbances and noise of the measured signals can be set by the operator.
- the mathematical models can be linear or nonlinear, and for the process, partial process or for measuring sensors.
- the linear models can be for instance differential equation models or models represented by means of transfer functions.
- the nonlinear models can be for instance differential equation models where the nonlinearities of the process or measuring sensors have been taken into account.
- Fig. 3 shows a simple description of a unit process.
- the control loops are presented as schematic drawings. The intent of this level is to describe the control loop structure and the field devices.
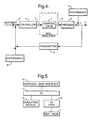
- the second level presents the block diagram for the loop, see Fig. 4. It defines the loop connections and shows what part of the loop is simulated and what are the real measurements. Also, the parameter configuration of the simulation model is made on this level.
- the real area is the one within the broken line, that is only the control valve 1, including a valve, an actuator and a positioner.
- the position of the valve is measured, and it is used in a mathematical model of the valve in process. Because the valve position is the only thing measured, the testing unit can be kept simple.
- the area outside the broken line is simulated.
- the simulated section includes process 2, transmitter 3, setpoint 5 and controller 5.
- Disturbances 6, 6' can be created both before the transmitter and between the transmitter and the controller, and the valve response is measured. If the response is not acceptable, another valve can be selected, or the gain of the positioner can be changed, for instance. In this way, a suitable control valve for a certain process can be found.
- the valve receives valve input signal 7, and the valve position 8 is used in the simulation model.
- Fig. 5 shows the system structure used in the equipment of the present invention.
- a simulation module 9 and a graphical user interface 10 are connected to the personal computer 11.
- a real valve 1 is connected to the PC via an I/O card 12.
- An I/O card is an input/output device, a unit that accepts new data and sends it into the computer for processing, receives the results and translates them into a usable form for the positioner.
- the third level is the process variability window. It shows simulation results of the system, see Fig. 6.
- the upper graph shows the process variability when a conventional positioner is used, and the lower graph shows the same when a smart valve controller is used.
- Fig. 7 is an example of the simulation of a flow control loop and the test results obtained.
- the essential feature in the test results is the simple output, that is the value for the process variability. In this case it is the maximum variability at a defined testing time range.
- Other ways of showing the process variability are for instance Integrated Error, Integrated Absolute Error, etc.
Landscapes
- Engineering & Computer Science (AREA)
- General Engineering & Computer Science (AREA)
- Mechanical Engineering (AREA)
- Physics & Mathematics (AREA)
- General Physics & Mathematics (AREA)
- Automation & Control Theory (AREA)
- Feedback Control In General (AREA)
Description
- This invention relates to a method for determining the performance of a control valve in a closed control loop by using a simulation model. The invention also relates to equipment for testing a control valve.
- A control valve and its operation is known and need not be described here in detail. A quarter turn valve can be for instance a ball valve or a butterfly valve. Examples of a ball valve are disclosed for instance in US patent 4 747 578. A control valve is actuated by means of an actuator which moves the stem of the closure member between open and closed positions. An actuator can be operated by means of a cylinder-piston device which in turn is regulated by means of a valve positioner which operates the actuator in response to a control signal.
- Control valves are often the most critical components in a control loop.
- Control performance of an installed control valve depends primarily on the performance of the control valve but also on process conditions. There are three important factors which have to be taken into account in checking control preformance of an installed valve. They are
- Installed flow characteristics and installed gain
- Static behaviour of a control valve
- Dynamic behaviour of a control valve
- In analyzing loop performance it must be checked that the valve, actuator and positioner are correctly sized and selected. The best performance is usually achieved by a double acting actuator and a two-stage electropneumatic positioner. Double acting actuators are stiffer than spring return actuators because of the higher actuator pressure level. Therefore, they are less sensitive to disturbances, like dynamic torque or force, and they also give a fast valve response. It is important that the I/P (current to pressure) conversion of an electropneumatic positioner is inside the position feedback loop to compensate the errors by the feedback mechanism.
- Control valves are often oversized because all the process data are not available and safety margins are used. If a valve is oversized, only a small part of the control range is in use. Many process controllers have still 10 bit D/A converters, which means about 0.1 % resolution for the control signal. The theoretical resolution of input signal is for example 0.5 % if only one fifth of the full control range is used.
- Oversizing means poor control accuracy. For example, if the valve is oversized, then the control valve maximum relative installed gain is about 4 in a typical liquid flow application, and if at the same time absolute position error in valve travel is 0.5 %, then the maximum error in flow is 2.0 %.
- The control valve installed flow characteristics and gain affect also strongly control valve dynamics and dead time. If the gain varies strongly within the process operating range, also the operating speed of the control loop varies strongly. Control valve oversizing increases control loop dead time. Gain of an oversized valve is high whereby the controller gain must be reduced to prevent control loop instability. This means that the control valve input signal changes coming from process controller are smaller, which leads to strong increase in control valve dead time. This is a significant drawback in process variability.
- Static behaviour of a control valve can be described with many different factors, such as
- Dead band
- Hysteresis plus dead band
- Repeatability
- Conformity/Linearity
- The first two are the most commonly measured nonlinearities of a control valve. They are mainly caused by a backlash and a high actuator load of the valve. Backlash can be removed only by valve maintenance. An actuator load can be decreased by reducing static friction and selecting a large enough actuator.
- Repeatability and linearity of a control valve are usually adequate, because control loops are closed by feedback.
- Dynamic perfomance of a control valve can be defined, for example, with the following factors
- Dead time
- Time constant(s)
- Overshooting
- Settling time
- Stiction
- The first four factors can be measured from a step response curve. Results depend a lot on the step size and the valve initial position, because dynamics of a control valve are strongly nonlinear.
- Analyzing methods and rules that are based on the linear control theory do not apply well to control valves. A frequency response is rarely used. The methods of frequency analysis are defined mainly for linear systems.
- Generally, control valves have to be tested in many operating points.
- US
patent publication 5 337 262 discloses an apparatus and method for testing hydraulic/pneumatic apparatus in a computer controlled test equipment. In publication WO 95 06276 a valve positioner with improved accuracy by using dynamic feedback is disclosed. The modeling of chemical processes is described by B. Nilsson in a paper "Object-oriented chemical process modeling in Omola". - US
patent publication 5 249 117 discloses a control system where an estimator is used to generate a simulation of a process according to the information it receives relating to the status of a real process. Other publications relating to valve control systems are USpatent publications 5 109 692 and 5 261 437 and Finnish patent publication 53047. Different methods and systems for estimating process parameters are disclosed in USpatent publications 5 172 312, 4 674 028, 5 195 026, 5 267 139 and 5 357 424. - Process variability represents the quality of the process output of the controlling system. It can be defined in several ways, such as the maximum variability (difference between the maximum value and the minimum value within a certain measurement range); Integrated Error (IE); Integrated Absolute Error (IAE); etc.
- The reasons for a high process variability are not easy to find without extra measurements. Poor process control can be caused, for example, by
- Lack of control valve maintenance
- Poor control valve sizing and selection
- Poor tuning of the process controller
- Poor process measurements
- Big disturbances
- Process variability is usually measured from sampled process values that are filtered from the real output of a process transmitter.
- There are different criteria for analyzing the process variability. The easiest method is to measure the maximum variability of the process output signal. The second way is to calculate the control error area or an area factor between the setpoint and measured variable in a certain time scale. There are many well known integration methods in the control literature, for example ITAE, ITE, ITSE and ISTE. The third way to analyze process variability is to use more complicated signal processing methods.
- It is usually difficult to estimate the influence of the control valve performance on the process variability. Flow control and tank level control loops have different sensitivity for control valve nonlinearities. In some cases dead time is more significant than dead band and vice versa.
- Advances in control algorithms and measurements have been strong and give new possibilities to enhance control valve performance and testing. New smart control valves offer excellent chances to reach higher control performance.
- The object of the present invention is to provide a method for analyzing an installed control valve performance and for selecting a suitable control valve or control valve tuning for a process so that the process variability can be minimized when it is controlled by the valve.
- The method of the present invention is characterized in
- providing a simulation model of a process control loop, consisting of a unit process including the flow equations of the valve, a process controller and a process transmitter, to simulate a process with disturbances;
- connecting the simulation model to a real control valve, including a valve, an actuator and a positioner;
- supplying actuating energy to the positioner;
- measuring the valve response; and
- determining the process variability during the process.
- The equipment according to the present invention is characterized in that it comprises:
- a control valve, including a valve, an actuator, a positioner and means for supplying actuating energy;
- a computer with an I/O card; and
- a closed control loop simulator for simulating a unit process, a process controller and a process transmitter.
-
- The method of the present invention helps to determine control performance of a control valve with respect to process variability. It is applied in analyzing the control valve nonlinearities and dynamics in a process control loop. The method also helps to define the most critical nonlinearities when the process loop is known.
- Control valve performance has a strong influence on process variability. This control performance has to be known in optimizing the loop performance.
- It is important to find and study the critical control loops. Oversized valves and lack of valve maintenance are the most common reasons for poor control performance. The solution to these problems is the process variability testing system used in the method of the present invention.
- In the system, a real control valve is connected to a simulated control loop consisting of a process controller, unit process and transmitter. The simulation models are selected from a model library.
- The system helps in analyzing the installed control valve performance in a process control loop. The process variability testing system estimates the control valve performance with the help of only one parameter: process variability.
- The main advantage of the system is the clear view of control valve performance and condition in a certain control loop. The meanings of conventional tests like dead band, dead time, hysteresis, speed of response, repeatability, linearity etc. on loop performance are not well defined. In fact, the system makes the tests and use of these factors unnecessary.
- In the method of the present invention, the parameters of a closed control loop are defined in a case of a known control valve by modelling the process and other members of the closed control loop except the control valve.
- A control valve includes so many nonlinearities that it is not feasible to reliably model each valve of different types and sizes. Because of that, a real valve is used when defining the parameters. The algorithms of the models and the I/O card of the computer can be made so fast that the controlling process will be in real time.
- The process variability testing system is a tool for evaluating the loop performance without a real process.
- Because loop performance can be tested without any real process, it means that the control loop performance can be estimated even before the installation of the valve. It is difficult to know beforehand without simulations or measurements how critical component the control valve actually is in a certain process application.
- The conventional tests, like dead band test and the speed of response test, are not adequate in analyzing the performance of an installed control valve, especially when the control loop usually is closed. The process variability testing system simulates the closed process loop with a real control valve and it gives easy-to-use acceptance criteria to different applications.
- Control valve performance has a strong influence on process variability. However, the quality of control valve performance is not easy to determine with conventional static and dynamic tests. Factors like installed flow characteristic and gain cannot be taken into account with the conventional tests. The new process variability testing system eliminates these drawbacks.
- The main advantage of the new testing system is simplicity because it estimates the control valve performance with the help of only one of the most critical parameters: process variability. The clear view of installed control valve performance and condition in certain control loops together with and easy-to-use graphic user interface offer advantages beyond the existing systems.
- The process variability testing system is an effective analyzing tool in control valve maintenance and selection. With the help of the new system, it is also easy to set acceptance criteria for different applications.
- The invention is described in detail in the following, with reference to the enclosed drawings in which
- Fig. 1 shows graphically the relation between relative input change and dead time,
- Fig. 2 shows the testing equipment according to the invention,
- Fig. 3 shows schematically a unit process,
- Fig. 4 is a block diagram of a control loop used in the method of the present invention,
- Fig. 5 shows the system structure used in the method of the present invention,
- Fig. 6 is a process variability comparison between a conventional positioner and a smart valve controller, and
- Fig. Fig. 7 shows an example of a simulation of a flow control loop and of the test results obtained.
-
- As pointed out in the above, small control valve input changes coming from process controller lead to strong increase in control valve dead time. The curve in Fig. 1 shows the calculated dead time in seconds as a function of relative input change, and points x show the measured values. It can be seen that small relative input signal changes lead to dramatically longer dead times.
- The system used in the present invention is based on a personnal computer testing system, real control valve and control loop simulator. The computer controls a real control valve and measures the valve response, as shown in Fig. 2. Only the position of the valve is measured. The system simulates a simple unit process, a process controller, a process transmitter and disturbances. The inherent flow characteristic of the valve and the pipeline behaviour are also modelled in the system.
- There are different unit process models, such as tank level loops, flow control loops, pressure control loops, temperature control loops and blending loops, in a model library. An operator can compare different process controllers and tuning. Disturbances and noise of the measured signals can be set by the operator.
- The mathematical models can be linear or nonlinear, and for the process, partial process or for measuring sensors. The linear models can be for instance differential equation models or models represented by means of transfer functions. The nonlinear models can be for instance differential equation models where the nonlinearities of the process or measuring sensors have been taken into account.
- The operator can study the process loop in many ways. First, the system shows how the selected process loop looks like. Fig. 3 shows a simple description of a unit process. The control loops are presented as schematic drawings. The intent of this level is to describe the control loop structure and the field devices.
- The second level presents the block diagram for the loop, see Fig. 4. It defines the loop connections and shows what part of the loop is simulated and what are the real measurements. Also, the parameter configuration of the simulation model is made on this level.
- In Fig. 4, the real area is the one within the broken line, that is only the
control valve 1, including a valve, an actuator and a positioner. The position of the valve is measured, and it is used in a mathematical model of the valve in process. Because the valve position is the only thing measured, the testing unit can be kept simple. - The area outside the broken line is simulated. The simulated section includes
process 2,transmitter 3,setpoint 5 andcontroller 5.Disturbances 6, 6' can be created both before the transmitter and between the transmitter and the controller, and the valve response is measured. If the response is not acceptable, another valve can be selected, or the gain of the positioner can be changed, for instance. In this way, a suitable control valve for a certain process can be found. The valve receives valve input signal 7, and thevalve position 8 is used in the simulation model. - An important factor when determining the process variability is the disturbances used. It is possible to use a certain general disturbance characteristic to the control loop as a standard test disturbance. However, it is also possible to specify other disturbances or they can be measured from a real control loop in question.
- Fig. 5 shows the system structure used in the equipment of the present invention. A
simulation module 9 and agraphical user interface 10 are connected to thepersonal computer 11. Areal valve 1 is connected to the PC via an I/O card 12. An I/O card is an input/output device, a unit that accepts new data and sends it into the computer for processing, receives the results and translates them into a usable form for the positioner. - The third level is the process variability window. It shows simulation results of the system, see Fig. 6. In Fig. 6, the upper graph shows the process variability when a conventional positioner is used, and the lower graph shows the same when a smart valve controller is used.
- Fig. 7 is an example of the simulation of a flow control loop and the test results obtained. The essential feature in the test results is the simple output, that is the value for the process variability. In this case it is the maximum variability at a defined testing time range. Other ways of showing the process variability are for instance Integrated Error, Integrated Absolute Error, etc.
Claims (8)
- A method for determining the performance of a control valve in a closed control loop by using a simulation model, characterized ina) selecting a simulation model of a process control loop of the type that includes a process variable, flow equations for the valve, a process controller, a transmitter and a device for inserting a disturbance in the loop;b) connecting the simulation model to an actual control valve having a valve member, an actuator and a positioner;c) supplying power to the positioner;d) measuring the valve response; ande) determining any process variability during the process.
- A method according to claim 1, characterized in that the position of the valve is measured to represent the valve response.
- A method according to claim 1 or 2, characterized in providing a model library from which the simulation model is selected.
- A method according to claim 3, characterized in that the model library includes models of at least some of the following models: flow control loops, pressure control loops, temperature control loops, tank level control loops and blending loops.
- A method according to any of claims 1 - 4, characterized in that a general disturbance characteristic to the control loop is used as a standard test disturbance in the simulated process control loop.
- A method according to any of claims 1 - 4, characterized in that disturbances measured from a real process control loop are used in the simulated process control loop.
- Equipment for testing a control valve, characterized in that it comprises:a) a control valve assembly (1) including a valve, an actuator, a positioner and means for supplying actuating energy to the valve;b) a computer (11) with an input and output card; andc) a closed control loop simulator for simulating a process (2), a process controller (4) and a process transmitter (3), said simulator including a computer connected to a control valve.
- Equipment according to claim 7, characterized in that the actuator is a double acting actuator and the positioner is a two-stage electromagnetic positioner with an I/P conversion inside a position feedback loop.
Applications Claiming Priority (2)
| Application Number | Priority Date | Filing Date | Title |
|---|---|---|---|
| US08/596,634 US5992229A (en) | 1996-02-05 | 1996-02-05 | Method and equipment for determining the performance of control valve |
| US596634 | 1996-02-05 |
Publications (3)
| Publication Number | Publication Date |
|---|---|
| EP0793155A2 EP0793155A2 (en) | 1997-09-03 |
| EP0793155A3 EP0793155A3 (en) | 1998-02-11 |
| EP0793155B1 true EP0793155B1 (en) | 2003-04-09 |
Family
ID=24388067
Family Applications (1)
| Application Number | Title | Priority Date | Filing Date |
|---|---|---|---|
| EP96660107A Expired - Lifetime EP0793155B1 (en) | 1996-02-05 | 1996-12-30 | Method and equipment for determining the performance of a control valve |
Country Status (3)
| Country | Link |
|---|---|
| US (1) | US5992229A (en) |
| EP (1) | EP0793155B1 (en) |
| DE (1) | DE69627297T2 (en) |
Families Citing this family (39)
| Publication number | Priority date | Publication date | Assignee | Title |
|---|---|---|---|---|
| RU2171462C2 (en) * | 1995-11-14 | 2001-07-27 | Сименс Акциенгезелльшафт | Procedure testing operational preparedness of valves |
| FI104129B1 (en) * | 1996-06-11 | 1999-11-15 | Neles Jamesbury Oy | Procedure for monitoring the condition of control valve |
| US6272401B1 (en) | 1997-07-23 | 2001-08-07 | Dresser Industries, Inc. | Valve positioner system |
| FI111106B (en) | 1999-02-19 | 2003-05-30 | Neles Controls Oy | Procedure for setting a process control loop in an industrial process |
| US7257523B1 (en) * | 1999-05-06 | 2007-08-14 | Fisher-Rosemount Systems, Inc. | Integrated distributed process control system functionality on a single computer |
| US6155283A (en) * | 1999-09-10 | 2000-12-05 | The Foxboro Company | Intelligent valve positioner tuning |
| DE10003298A1 (en) * | 2000-01-27 | 2001-08-02 | Bosch Gmbh Robert | Pressure regulation method involves modeling pressure regulator and/or actuator to produce at least one signal characterizing disturbing parameters in pressure regulating circuit |
| US7096093B1 (en) | 2000-02-14 | 2006-08-22 | Invensys Systems, Inc. | Intelligent valve flow linearization |
| US6701223B1 (en) * | 2000-09-11 | 2004-03-02 | Advantica, Inc. | Method and apparatus for determining optimal control settings of a pipeline |
| US6463949B2 (en) * | 2000-12-08 | 2002-10-15 | Caterpillar Inc. | Method and apparatus for determining a valve status |
| WO2002073215A2 (en) * | 2001-03-09 | 2002-09-19 | Hamilton Bonaduz Ag | Method and device for evaluating a liquid dosing process |
| US6668644B2 (en) | 2002-01-18 | 2003-12-30 | Uponor Aldyl Co. | Adjustable meter loop assembly |
| WO2004074947A2 (en) * | 2003-02-14 | 2004-09-02 | Dresser, Inc. | Method, system and storage medium for performing online valve diagnostics |
| US20050091021A1 (en) * | 2003-10-27 | 2005-04-28 | Anurag Gupta | Method and apparatus for controlling polyolefin reactor temperature |
| JP5017106B2 (en) * | 2004-07-02 | 2012-09-05 | ユニヴァーシティー オブ アルバータ | Adsorption detection and quantification |
| US8185224B2 (en) | 2005-06-30 | 2012-05-22 | Biomet 3I, Llc | Method for manufacturing dental implant components |
| US8509926B2 (en) * | 2005-12-05 | 2013-08-13 | Fisher-Rosemount Systems, Inc. | Self-diagnostic process control loop for a process plant |
| US7283894B2 (en) | 2006-02-10 | 2007-10-16 | Dresser, Inc. | System and method for fluid regulation |
| SE530380C2 (en) * | 2006-10-03 | 2008-05-20 | Abb Ab | Automatic estimation of glitches |
| DE102007001186B4 (en) * | 2007-01-05 | 2008-10-16 | Forschungsverbund Berlin E.V. | Method and device for online compensation of non-linearities in the transfer behavior of actuators |
| US7539560B2 (en) * | 2007-01-05 | 2009-05-26 | Dresser, Inc. | Control valve and positioner diagnostics |
| US8573241B2 (en) * | 2007-03-30 | 2013-11-05 | Dresser, Inc. | Systems and processes for field-initiated fluid regulation testing |
| EP2225619B1 (en) * | 2007-11-29 | 2013-03-20 | Airbus Operations GmbH | Method and apparatus for testing valve control system |
| DE102007058517B4 (en) * | 2007-12-05 | 2018-07-26 | Abb Ag | Digital positioner |
| DE102008023901B4 (en) * | 2008-05-16 | 2010-05-12 | Festo Ag & Co. Kg | Simulation module and simulation method for a maintenance device arrangement |
| DE102009004569B4 (en) * | 2009-01-14 | 2014-02-13 | Abb Technology Ag | Method and electronic device for compensating the hysteresis of pneumatically driven valves |
| DE102009004571A1 (en) | 2009-01-14 | 2010-07-22 | Abb Technology Ag | Method and electronic device for testing control parameters of an electro-pneumatic valve in a pneumatic actuator |
| DE102009004570B4 (en) * | 2009-01-14 | 2019-11-14 | Abb Schweiz Ag | Method and electronic device for finding the opening point in a controlled electro-pneumatic valve of a pneumatic actuator |
| DE102009004572B4 (en) * | 2009-01-14 | 2010-08-19 | Abb Technology Ag | Method and electronic device for compensating the drift behavior in a pneumatic actuator during operation |
| US20100217443A1 (en) * | 2009-01-17 | 2010-08-26 | Certus Process Solutions | Self-Contained Valve Actuator For Quarter Turn Valve System |
| WO2011104419A1 (en) * | 2010-02-26 | 2011-09-01 | Metso Automation Oy | Performance monitoring of a pump-valve system |
| EP2439602A1 (en) * | 2010-10-05 | 2012-04-11 | Siemens Aktiengesellschaft | Method for designing a process regulator |
| US20120167996A1 (en) * | 2011-01-05 | 2012-07-05 | Fisher Controls International Llc | Valve Controller Automatic Calibration Without User Interface |
| WO2012162533A2 (en) * | 2011-05-25 | 2012-11-29 | Sam Houston State University | Bioremediation reactor systems |
| US8926328B2 (en) | 2012-12-27 | 2015-01-06 | Biomet 3I, Llc | Jigs for placing dental implant analogs in models and methods of doing the same |
| CN107003648B (en) * | 2014-12-17 | 2019-06-11 | 西门子公司 | Inspection method and engineering planning system for functional modules of automation equipment |
| CN109891352B (en) * | 2016-09-21 | 2023-04-28 | 维美德流体控制公司 | Method and controller for an actuator |
| FI128783B (en) * | 2018-09-03 | 2020-12-15 | Metso Flow Control Oy | Valve positioner and diagnostic method |
| US11604459B2 (en) | 2019-07-12 | 2023-03-14 | Emerson Process Management Power & Water Solutions, Inc. | Real-time control using directed predictive simulation within a control system of a process plant |
Family Cites Families (29)
| Publication number | Priority date | Publication date | Assignee | Title |
|---|---|---|---|---|
| US3665945A (en) * | 1971-02-03 | 1972-05-30 | M & J Valve Co | Valve control system and method |
| FI53047C (en) | 1976-04-09 | 1978-01-10 | Kymin Oy Kymmene Ab | |
| US4294109A (en) * | 1979-12-19 | 1981-10-13 | Cummins Engine Company, Inc. | Test apparatus for hydraulic valve |
| US4417312A (en) * | 1981-06-08 | 1983-11-22 | Worcester Controls Corporation | Electronic controller for valve actuators |
| JPH07104715B2 (en) | 1984-01-18 | 1995-11-13 | 株式会社日立製作所 | How to identify parameters |
| FI72584C (en) | 1985-09-04 | 1987-06-08 | Neles Oy | VENTIL. |
| US4891975A (en) * | 1986-04-04 | 1990-01-09 | Movats Incorporated | Method and apparatus for remote monitoring of valves and valve operators |
| US4831873A (en) * | 1986-04-04 | 1989-05-23 | Movats Incorporated | Method and apparatus for remote monitoring of valves and valve operators |
| US4869102A (en) * | 1986-04-04 | 1989-09-26 | Movats Incorporated | Method and apparatus for remote monitoring of valves and valve operators |
| US5000040A (en) * | 1986-04-04 | 1991-03-19 | Movats Incorporated | Method and apparatus for remote monitoring of valves and valve operators |
| KR890007306A (en) * | 1987-10-30 | 1989-06-19 | 제트.엘.더머 | Online valve diagnostic monitoring system |
| US4888996A (en) * | 1987-12-22 | 1989-12-26 | Movats Incorporated | DC motor operated valve remote monitoring system |
| US5109692A (en) | 1988-08-25 | 1992-05-05 | Fisher Controls International Inc. | Diagnostic apparatus and method for fluid control valves |
| JP2755644B2 (en) | 1989-01-20 | 1998-05-20 | 株式会社東芝 | Control system design method and design support device |
| US5249117A (en) | 1989-04-26 | 1993-09-28 | The Secretary Of State For Defence In Her Britannic Majesty's Government Of The United Kingdom Of Great Britain And Northern Ireland | Adaptive control systems |
| DE69030859T2 (en) | 1989-09-12 | 1997-12-18 | Hitachi Ltd | Process and device for computer-controlled non-linear optimization |
| US5257208A (en) * | 1990-04-23 | 1993-10-26 | Fire & Safety Electronics Inc. | Computerized portable testing device for backflow valves |
| US5272647A (en) * | 1991-01-30 | 1993-12-21 | Combustion Engineering, Inc. | Valve diagnostic apparatus and method |
| US5174152A (en) * | 1991-03-06 | 1992-12-29 | Wohld Peter R | Power operated valve stem thrust verification test system |
| US5261437A (en) | 1991-06-10 | 1993-11-16 | Keystone International Holdings Corp. | Method and apparatus for monitoring and analyzing recirculation control system performance |
| US5267139A (en) | 1991-06-25 | 1993-11-30 | Johnson Carroll D | Zee parameter estimator/identifier |
| US5548997A (en) * | 1991-09-03 | 1996-08-27 | Westinghouse Electric Corporation | Apparatus for applying a known axial force to a valve stem |
| US5337262A (en) * | 1991-12-03 | 1994-08-09 | Hr Textron Inc. | Apparatus for and method of testing hydraulic/pneumatic apparatus using computer controlled test equipment |
| JPH05277976A (en) | 1992-03-31 | 1993-10-26 | Nippon Telegr & Teleph Corp <Ntt> | Dynamic model parameter indentifying device |
| US5402367A (en) * | 1993-07-19 | 1995-03-28 | Texas Instruments, Incorporated | Apparatus and method for model based process control |
| US5433245A (en) * | 1993-08-16 | 1995-07-18 | Westinghouse Electric Corporation | Online valve diagnostic monitoring system having diagnostic couplings |
| US5549137A (en) * | 1993-08-25 | 1996-08-27 | Rosemount Inc. | Valve positioner with pressure feedback, dynamic correction and diagnostics |
| US5469737A (en) * | 1993-12-20 | 1995-11-28 | Westinghouse Electric Corporation | Method and apparatus for measuring the axial load and position of a valve stem |
| US5687098A (en) * | 1995-10-30 | 1997-11-11 | Fisher Controls International, Inc. | Device data acquisition |
-
1996
- 1996-02-05 US US08/596,634 patent/US5992229A/en not_active Expired - Fee Related
- 1996-12-30 DE DE69627297T patent/DE69627297T2/en not_active Expired - Fee Related
- 1996-12-30 EP EP96660107A patent/EP0793155B1/en not_active Expired - Lifetime
Also Published As
| Publication number | Publication date |
|---|---|
| DE69627297D1 (en) | 2003-05-15 |
| EP0793155A3 (en) | 1998-02-11 |
| EP0793155A2 (en) | 1997-09-03 |
| US5992229A (en) | 1999-11-30 |
| DE69627297T2 (en) | 2003-10-09 |
Similar Documents
| Publication | Publication Date | Title |
|---|---|---|
| US5992229A (en) | Method and equipment for determining the performance of control valve | |
| EP3847510B1 (en) | Valve positioner and diagnostic method | |
| US11274685B2 (en) | Actuator of a process device having a controller configured to operate in a measured position feedback mode and a simulated position feedback mode | |
| EP0708389A1 (en) | Method and apparatus for detecting a fault of a control valve assembly in a control loop | |
| EP0739503B1 (en) | Valve positioner with pressure feedback, dynamic correction and diagnostics | |
| EP1599712B1 (en) | Method, system and storage medium for performing online valve diagnostics | |
| Karpenko et al. | Fault-tolerant control of a servohydraulic positioning system with crossport leakage | |
| Williams et al. | Numerical modeling of a servohydraulic testing system for structures | |
| Ferreira et al. | Semi-empirical model for a hydraulic servo-solenoid valve | |
| CN119881505B (en) | High temperature torque test system based on adaptive PID control | |
| US20050119865A1 (en) | Method for monitoring a technical system | |
| Barker et al. | Gain-scheduled linear fractional control for active flutter suppression | |
| EP1070282B1 (en) | Method and apparatus for identifying a physical system | |
| NOSKIEVIC et al. | DEVELOPMENT AND APPLICATION OF THE DIGITAL TWIN OF THE HYDRAULIC CONTROL VALVE. | |
| Ghazali et al. | Open-loop and closed-loop recursive identification of an electro-hydraulic actuator system | |
| Carpenter et al. | Mixed Sensitivity H-Infinity control design with frequency domain uncertainty modeling for a pilot operated proportional control valve | |
| Fales | Uncertainty modeling and predicting the probability of stability and performance in the manufacture of dynamic systems | |
| CN101189560A (en) | process control | |
| US12098782B2 (en) | Testing control valves in the field | |
| Boza | Design and validation of an electro-hydraulic pressure-control valve and closed-loop controller | |
| Selomah et al. | Development of Modelling of Couple Tank System CE 105 Using ARX Method | |
| Ferreira et al. | Hybrid models of hydraulic systems for hardware-in-the-loop simulation. Part 2: Experiments | |
| Totz et al. | HAGC systems in cold rolling mills: From concept to automated experiment | |
| Hillenbrand et al. | Hardware-in-the-loop-simulation of pneumatic actuators | |
| KR19990075638A (en) | Multivariable control method and apparatus |
Legal Events
| Date | Code | Title | Description |
|---|---|---|---|
| PUAI | Public reference made under article 153(3) epc to a published international application that has entered the european phase |
Free format text: ORIGINAL CODE: 0009012 |
|
| AK | Designated contracting states |
Kind code of ref document: A2 Designated state(s): DE FR GB IT |
|
| PUAL | Search report despatched |
Free format text: ORIGINAL CODE: 0009013 |
|
| AK | Designated contracting states |
Kind code of ref document: A3 Designated state(s): DE FR GB IT |
|
| 17P | Request for examination filed |
Effective date: 19980806 |
|
| 17Q | First examination report despatched |
Effective date: 20000407 |
|
| GRAG | Despatch of communication of intention to grant |
Free format text: ORIGINAL CODE: EPIDOS AGRA |
|
| GRAG | Despatch of communication of intention to grant |
Free format text: ORIGINAL CODE: EPIDOS AGRA |
|
| GRAH | Despatch of communication of intention to grant a patent |
Free format text: ORIGINAL CODE: EPIDOS IGRA |
|
| RAP1 | Party data changed (applicant data changed or rights of an application transferred) |
Owner name: METSO FIELD SYSTEMS OY |
|
| GRAH | Despatch of communication of intention to grant a patent |
Free format text: ORIGINAL CODE: EPIDOS IGRA |
|
| GRAA | (expected) grant |
Free format text: ORIGINAL CODE: 0009210 |
|
| RAP1 | Party data changed (applicant data changed or rights of an application transferred) |
Owner name: METSO AUTOMATION OY |
|
| AK | Designated contracting states |
Designated state(s): DE FR GB IT |
|
| REG | Reference to a national code |
Ref country code: GB Ref legal event code: FG4D |
|
| ET | Fr: translation filed | ||
| PG25 | Lapsed in a contracting state [announced via postgrant information from national office to epo] |
Ref country code: GB Free format text: LAPSE BECAUSE OF NON-PAYMENT OF DUE FEES Effective date: 20031230 |
|
| PLBE | No opposition filed within time limit |
Free format text: ORIGINAL CODE: 0009261 |
|
| STAA | Information on the status of an ep patent application or granted ep patent |
Free format text: STATUS: NO OPPOSITION FILED WITHIN TIME LIMIT |
|
| 26N | No opposition filed |
Effective date: 20040112 |
|
| PG25 | Lapsed in a contracting state [announced via postgrant information from national office to epo] |
Ref country code: DE Free format text: LAPSE BECAUSE OF NON-PAYMENT OF DUE FEES Effective date: 20040701 |
|
| GBPC | Gb: european patent ceased through non-payment of renewal fee |
Effective date: 20031230 |
|
| PG25 | Lapsed in a contracting state [announced via postgrant information from national office to epo] |
Ref country code: FR Free format text: LAPSE BECAUSE OF NON-PAYMENT OF DUE FEES Effective date: 20040831 |
|
| REG | Reference to a national code |
Ref country code: FR Ref legal event code: ST |
|
| PG25 | Lapsed in a contracting state [announced via postgrant information from national office to epo] |
Ref country code: IT Free format text: LAPSE BECAUSE OF NON-PAYMENT OF DUE FEES;WARNING: LAPSES OF ITALIAN PATENTS WITH EFFECTIVE DATE BEFORE 2007 MAY HAVE OCCURRED AT ANY TIME BEFORE 2007. THE CORRECT EFFECTIVE DATE MAY BE DIFFERENT FROM THE ONE RECORDED. Effective date: 20051230 |