EP0697677A2 - Apparatus and method for determining image quality - Google Patents
Apparatus and method for determining image quality Download PDFInfo
- Publication number
- EP0697677A2 EP0697677A2 EP95112396A EP95112396A EP0697677A2 EP 0697677 A2 EP0697677 A2 EP 0697677A2 EP 95112396 A EP95112396 A EP 95112396A EP 95112396 A EP95112396 A EP 95112396A EP 0697677 A2 EP0697677 A2 EP 0697677A2
- Authority
- EP
- European Patent Office
- Prior art keywords
- computing
- digital image
- image quality
- quality detection
- image
- Prior art date
- Legal status (The legal status is an assumption and is not a legal conclusion. Google has not performed a legal analysis and makes no representation as to the accuracy of the status listed.)
- Withdrawn
Links
Images


Classifications
-
- G—PHYSICS
- G06—COMPUTING; CALCULATING OR COUNTING
- G06T—IMAGE DATA PROCESSING OR GENERATION, IN GENERAL
- G06T7/00—Image analysis
- G06T7/0002—Inspection of images, e.g. flaw detection
- G06T7/0004—Industrial image inspection
-
- G—PHYSICS
- G06—COMPUTING; CALCULATING OR COUNTING
- G06V—IMAGE OR VIDEO RECOGNITION OR UNDERSTANDING
- G06V10/00—Arrangements for image or video recognition or understanding
- G06V10/98—Detection or correction of errors, e.g. by rescanning the pattern or by human intervention; Evaluation of the quality of the acquired patterns
- G06V10/993—Evaluation of the quality of the acquired pattern
-
- G—PHYSICS
- G06—COMPUTING; CALCULATING OR COUNTING
- G06T—IMAGE DATA PROCESSING OR GENERATION, IN GENERAL
- G06T2207/00—Indexing scheme for image analysis or image enhancement
- G06T2207/10—Image acquisition modality
- G06T2207/10004—Still image; Photographic image
- G06T2207/10008—Still image; Photographic image from scanner, fax or copier
-
- G—PHYSICS
- G06—COMPUTING; CALCULATING OR COUNTING
- G06T—IMAGE DATA PROCESSING OR GENERATION, IN GENERAL
- G06T2207/00—Indexing scheme for image analysis or image enhancement
- G06T2207/20—Special algorithmic details
- G06T2207/20048—Transform domain processing
- G06T2207/20056—Discrete and fast Fourier transform, [DFT, FFT]
-
- G—PHYSICS
- G06—COMPUTING; CALCULATING OR COUNTING
- G06T—IMAGE DATA PROCESSING OR GENERATION, IN GENERAL
- G06T2207/00—Indexing scheme for image analysis or image enhancement
- G06T2207/30—Subject of image; Context of image processing
- G06T2207/30176—Document
Definitions
- the present invention relates to a method and apparatus for determining image quality. More particularly, the present invention relates to a method, apparatus and computer program product for determining the quality of images which have been scanned using imaging apparatus, such as a document scanner.
- Image processing has burgeoned in the last several years.
- the advent of powerful, yet relatively low cost, computers have ushered in a variety of image processing applications.
- documents can now be scanned, converted to digital form, and manipulated in a number of ways for various purposes.
- the United States Patent Office's Automated Patent System (APS) stores certain patents in digitized form for search and retrieval purposes.
- Banks routinely process checks and other financial instruments based on information gleaned from a digital image of a document.
- the availability of low cost desktop and handheld scanner devices has also precipitated image processing by individuals and small businesses.
- the quality of an imaging system can be monitored by examining either the system itself or the product of the system (i.e., the digital image produced by the system).
- the system itself can be monitored by examining responses received from control points within the system, such as hardware or software components.
- control points such as hardware or software components.
- a typical technique for determining problems is to present a test target to the scanner and analyze the scanner output. The problem is that this interferes with normal use of the scanner and reduces scanner throughput.
- Some known techniques e.g., histogram analysis
- Some known techniques attempt to overcome this problem by analyzing scanner output to determine if one gray level is more prevalent in the image that any other. Since these techniques make assumptions about the type of document that will be scanned (e.g., multi-shade or color document), they are only useful for certain applications (e.g., diagnostic mode testing). These techniques are also insensitive to isolated pel failures.
- the invented method, apparatus, and computer program product for determining image quality can be employed either during diagnostic mode or at run time of an imaging system.
- One component performs numerical analysis on a digital image.
- Another component accepts or rejects the quality of the digital image based on the results of the numerical analysis.
- the cumulative harmonic content of Fourier component amplitudes of a synthesized scan line exceeds a threshold value, the digital image is rejected as being of inadequate quality; otherwise the digital image is accepted.
- a maximum gradient of a scan line of the digital image is computed. If, for some specified number of occurrences during a scan of a target, the maximum gradient exceeds a ceiling value or falls below a floor value, then the image is rejected.
- One advantage of the present invention is the ability to identify problems that can only be detected by inspection of the image data and to automatically notify the end user of the problem.
- Another advantage of the present invention is the ability to reliably diagnose imaging system hardware problems, including dead pel(s)/segment(s), optical or electronic defocus, and loose cables/connections.
- Yet another advantage of the present invention is the ability to identify defective images, which suggest a hardware/software problem, the first time the problem occurs.
- Another advantage of the present invention is the ability to monitor scanner performance over extended periods of time (e.g., weeks or months).
- FIG. 1 a block diagram provides an overview of the invented method, apparatus, and computer program product.
- the present invention can be employed either during diagnostic mode or at run time of an imaging system.
- 10 refers to a step or means for performing numerical analysis on a digital image.
- 12 refers to a step or means for accepting or rejecting the quality of the digital image based on the results of the numerical analysis.
- accept means to meet some criteria and "reject” means to not meet that criteria.
- other action may occur (e.g., notifying the end user or discarding the image).
- FIG. 2 An illustrative system 14 for collecting a digital image 16 is shown in FIG. 2.
- the system 14 includes a focusing or imaging lens 18 and uses a sensor 20 to capture an electrical representation of each line of a document or other target 22, based on either the black/white or gray characteristics of the target.
- the target 22 to be imaged can be either stationary or transported by a moving track, moving conveyor line, rotating drum, or other transport 24, along a path beneath the imaging lens 18.
- the target 22 is scanned to obtain data corresponding to indicia 26 existing on the target.
- the target 22 is moved in the direction X so that all portions of the target are eventually illuminated by a line of light 28 which is produced by illuminating devices 30 of the system. This line 28 extends across the target 22 in a direction which is perpendicular to direction X.
- Reflections from the indicia 26 illuminated by the line 28 are focused by the imaging lens 18 onto the sensor 20.
- the imaging lens 18 can be a graded index fiber lens or a conventional spherical lens, in which case the sensor could be shorter than the length of the line.
- the sensor 20 is commercially available from various manufacturers and can be, for example, an array of photodiodes, a photoarray, or a charge coupled device (CCD) in which the impinging light on each sensor develops an electrical signal proportional to the amount of light.
- CCD charge coupled device
- Each line of the sensor develops a number of pels (e.g., 1024), with each pel having a particular gray scale value (e.g., a value from 0 to 255), which value represents a portion of the target being scanned.
- the composite of these lines of the target 22 provides a digital image of the target being scanned.
- Data obtained by the sensor 20 is appropriately clocked out of the sensor and transferred to other electronic circuits of the system 14.
- the electrical signals pass on line to an analog-to-digital converter 32, which converts each pel into a digital representation which is then stored in memory 34 for storage and further processing by a computer 36 as desired.
- Memory 34 is preferably a random access memory (RAM) or other high speed electronic memory.
- RAM random access memory
- computer includes a device capable of performing the functions of a Turing Machine, including a microcomputer, minicomputer, or mainframe computer.
- a Turing Machine is a well-known computer science concept and is explained in Encyclopedia of Computer Science, Ed. Anthony Ralston, ISBN 0-88405-321-0, which is specifically incorporated herein by reference.
- For further details of an image capture and processing system see U.S. Pat. No. 4,888,812 to Dinan et al., which is specifically incorporated herein by reference.
- One embodiment of the present invention is a method for determining image quality of a digital image wherein if the cumulative harmonic content of Fourier component amplitudes of a synthesized scan line exceeds a threshold value, the digital image is rejected as being of inadequate quality; otherwise the digital image is accepted. If consecutive targets exhibit the problem, then there is a high likelihood of a scanner problem.
- FIG. 3 is a flow chart of a preferred implementation.
- the first step is to commence collecting a two-dimensional digital image, step 100.
- the digital image comprises an L x W matrix of numbers, D, where L is the number of matrix rows and W is the number of matrix columns.
- Each number in matrix D is referred to herein as a "pel".
- pel Each number in matrix D is referred to herein as a "pel".
- the matrix is referred to herein as the "scan area”.
- Scan line A particular column in the matrix or scan area is referred to herein as a "scan line”.
- the digital image is collected using conventional imaging technology well known to those skilled in the art, and illustratively discussed above in connection with FIG. 2.
- the image can be collected using an IBM 3897 image capture system or an IBM 3119 document scanner, both available from IBM Corporation.
- IBM 3897 image capture system or an IBM 3119 document scanner, both available from IBM Corporation.
- other commercially available imaging apparatus or document scanners can also be employed (e.g, LogiTech handheld scanners, Hewlett-Packard desktop scanners, etc).
- step 102 If the reflectance of the entire target is non-uniform (i.e., more than one shade or color), step 102, then a maximum reflectance vector, v, is computed from the digital image, step 104, otherwise such a vector need not be computed.
- v a maximum reflectance vector
- the latter case typically corresponds to a situation wherein a scan of a target with no printing (e.g., solid white, blue, etc.) is made during diagnostic mode.
- the former case is typical during run-time since it is desirable to collect the scan without requiring the user to present a special target to the scanner.
- the maximum reflectance vector is created by selecting and storing the digital value of the pel representing the highest reflectance within each of the L rows of the image. Typically, although not necessarily, the highest reflectance value is white, represented by zero, and the lowest reflectance value is black, represented by 255.
- the maximum reflectance vector can be computed "on-the-fly" as each scan line is imaged and stored in D, or after the entire scan area has been stored. The following pseudocode is illustrative: initialize all v i to the maximum value (e.g., 255) If the maximum reflectance vector indicates that the target comprises only a portion of the scan area, step 106, then that portion is extracted, step 108. The portion W1 to W2 in FIG.
- v a modified v, where the number of elements in v, denoted w, is less than or equal to W. If w is less than a power of 2, 2 n , step 110, then the vector is expanded to include 2 n pels, step 112, in order to optimize step 114. For example, if the vector contained only 70 pels after step 108, then it would be expanded to the next higher power of 2 (i.e., 128) by interpolation. The values in the vector are then assumed to be the video level of the background of the target and this "synthesized scan line", v, is treated as the scan needed for analysis.
- the synthesized scan line, v is analyzed by calculating Fourier component amplitudes, step 114, assuming the scan to be a periodic function.
- Fourier component amplitudes, A(u) are computed in step 114.
- q ⁇ -1
- N is the number of elements in the synthesized scan line, v.
- step 114 is computed using the Fast Fourier Transform (FFT) algorithm.
- FFT Fast Fourier Transform
- Techniques for implementing FFT are well known to those skilled in the art. The following texts describe techniques for implementing step 114 and are incorporated herein by reference: “Digital Image Processing”, by R. C. Gonzalez, P. Wintz, ISBN 0-201-11026-1, Addison-Wesley Publishing Company (1987); and “Digital Signal Processing”, Ed. by L. R. Rabiner, C. M. Rader, ISBN 0-87942-018-9, IEEE Press (1972).
- Selected Fourier component amplitudes are summed in step 116.
- the fundamental, A(1), and nineteen harmonics amplitudes, A(2) to A(20) can be summed.
- the summation does not contain the average or DC component, A(0), and is therefore independent of the average background reflectance. Also, components which exhibit unusual spikes or other disturbances are excluded.
- step 118 If the summation of the Fourier component amplitudes exceeds a threshold value, step 118, then the digital image is rejected; otherwise it is accepted.
- the threshold value depends on the base quality of the device used to digitize the image and is therefore determined experimentally. The summation shows a distinct correlation to the problems being diagnosed since it exhibits a much higher value as compared to the value calculated from a scan free of such problems. This is an improvement over techniques based on video thresholding, which analyze only background video level.
- FIG. 4a is a graph of a scan illustrating the presence of dust in the illumination system. Dust rarely settles uniformly. Results are evident from the scanned data. This non-uniformity of the image data results in growth of harmonic content of Fourier component amplitudes, as shown in FIG. 4b, which growth is used to identify a quality problem.
- reference curve 1 shows Fourier component amplitude of image data without dust and reference curve 2 shows the associated cumulative summation of the Fourier components amplitude.
- Reference curve 3 shows Fourier component amplitude of image data with dust and reference curve 4 shows the associated cumulative summation of the Fourier components amplitude. Note the difference in the cumulative summation values between reference curves 2 and 4.
- FIG. 4c illustrates video output of a 1024 CCD device having sixteen segments. One segment is shown dead. Every pel in this interleaved segment is shown having a video level of 128. Although a video level of 128 ( ⁇ 255) has been used in the example, a higher value can be used to provide higher detectability. The problem may lie in the CCD analog card or in subsequent signal processing cards.
- the video data corresponding to pels 256, 258, 260 ... 384 (64 pels) in FIG. 4c is set to 128. Remaining pels illustrate normal output.
- FIG. 4d illustrates the corresponding Fourier analysis results. Reference curve 1 shows Fourier component amplitude of image data with a dead segment and reference curve 2 shows the associated cumulative summation of the Fourier components amplitude. The cumulative summation is above the normal sum.
- FIG. 4e illustrates a situation where four consecutive pels are dead (i.e., video level is 255). This condition may occur due to either an electronics failure or due to the presence of a dust particle on the optical viewing window. In this illustration, only one region exhibits the problem, i.e., only pels 257, 258, 259 and 260 have been blocked.
- FIG. 4f shows the corresponding Fourier component amplitudes for the dead pel condition illustrated in FIG. 4e.
- Reference curve 1 shows Fourier component amplitude of image data with four blocked pels and reference curve 2 shows the associated cumulative summation of the Fourier components amplitude. Again, the cumulative summation is above the normal sum.
- FIG. 4g plots the cumulative summation for each of the three abnormal conditions illustrated in FIGs. 4b, 4d, and 4f, along with their associated normal sums.
- an amplitude threshold e.g. 10000
- a maximum gradient of a scan line of the digital image is computed.
- the maximum video gradient value, G computed will fall between a ceiling value, G max , and a floor value, G min .
- G should equal or exceed some G min because the system should always meet some minimum performance criteria. No test target is necessary for gradient analysis and the analysis does not require a lot of computations. Thus it can be performed real time without impacting scanner throughput. If a problem arises, it can be identified on the first image affected and problems as small as a single pel failure can be detected.
- the overall modulation transfer function (MTF) achieved by the system defines the system's ability to resolve fine details in an image. If the MTF is low then the system will produce images with softened edges. The crispness of the edges can be quantified by computing the maximum video gradient present in a scanned image. Soft edges will result in low gradient values. Sharp edges will result in high gradient values.
- MTF modulation transfer function
- FIG. 5 is a flow chart of a preferred implementation at the beginning of each target scan.
- G is computed on at least one column in D.
- the invention can also be applied in a row-wise fashion, or in a column-wise and row-wise fashion concurrently.
- step 150 counters (CTR) G min CTR, G max CTR, and threshold variables T1, T2, and T3, are initialized. Then, in step 152, a line is scanned such that a scan line, is created. If the scan line does not include at least some portion of the target, step 156, then another line is scanned until the target is located, step 156, or the scan is complete, step 154.
- CTR counters
- the maximum pel-to-pel difference (in absolute value terms), G, within the scan line is computed in step 158.
- G can be computed "on-the-fly" as each scan line is imaged and stored in D, or after the entire scan area has been stored.
- G is illustratively computed in pseudocode as follows: If G is greater than G max , step 160, then G max CTR is incremented, step 162. Similarly, if G is less than G min , step 164, then G min CTR is incremented.
- step 168 the digital image is rejected since this indicates that dead video pel(s)/segment(s) were discovered.
- G min CTR is greater than T2
- step 170 the digital image is also rejected since this indicates that the camera is non-responsive (e.g., out of focus); otherwise, the digital image is considered acceptable.
- T1 might be set to 16, whereas T2 might be set to 2. The precise values will vary depending on the characteristics of the scanner and the tolerances chosen by a particular designer.
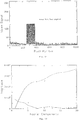
- FIG. 6 illustrates the maximum video gradient computed for 32 scans taken from a scanner that has one dead pixel and a scanner that has no problems.
- the top plot corresponds to dead pixel or dead segment (Avg. 204, 1 sigma 13).
- the bottom plot corresponds to normal focused scanner (Avg. 99, 1 sigma 12).
- the difference between the maximum video gradient computed with and without a dead pixel exceeds 64 for all scans. By choosing an appropriate threshold, a dead pixel is detectable in the system and can be detected on the first document affected.
- T3 is initialized to zero at the beginning of each document scan. Following each scan, if T3 ⁇ G max , then T3 is incremented by one. This process continues until the end of the document scan. Then, T3 is stored in memory, and T3 is reset to zero. For each day, a certain number of T3 values are averaged. The average value reflects the scanner performance. A spline fit through these points over several days/weeks of data provides a measurable parameter that indicates the changes taking place in the scanner performance. When this value falls below a programmable threshold, the user is alerted to take corrective action.
- the numerical analysis and acceptance/rejection elements of the present invention are performed by a computer program, that is, a series of stored program instructions, executing on a computer.
- the computer program comprises a special purpose apparatus for determining image quality.
- the computer program when stored on a computer readable medium such as a flexible diskette, hard disk, CD-ROM, or other similar device, comprises an article of manufacture.
- the invention may be embodied in an electronic device which includes circuitry for performing the functions corresponding to the described numerical analysis and acceptance/rejection elements.
Abstract
Invented method, apparatus, and computer program product for determining image quality can be employed either during diagnostic mode or at run time of an imaging system. One component performs numerical analysis on a digital image. Another component accepts or rejects the quality of the digital image based on the results of the numerical analysis. In one embodiment, if the cumulative harmonic content of Fourier component amplitudes of a synthesized scan line exceeds a threshold value, the digital image is rejected as being of inadequate quality; otherwise the digital image is accepted. In another embodiment, a maximum gradient of a scan line of the digital image is computed. If, for some specified number of occurrences during a scan of a target, the maximum gradient exceeds a ceiling value or falls below a floor value, then the image is rejected.
Description
- The present invention relates to a method and apparatus for determining image quality. More particularly, the present invention relates to a method, apparatus and computer program product for determining the quality of images which have been scanned using imaging apparatus, such as a document scanner.
- Image processing has burgeoned in the last several years. The advent of powerful, yet relatively low cost, computers have ushered in a variety of image processing applications. For example, documents can now be scanned, converted to digital form, and manipulated in a number of ways for various purposes. The United States Patent Office's Automated Patent System (APS) stores certain patents in digitized form for search and retrieval purposes. Banks routinely process checks and other financial instruments based on information gleaned from a digital image of a document. The availability of low cost desktop and handheld scanner devices has also precipitated image processing by individuals and small businesses.
- As users of image processing place more and more reliance on the technology, the need to ensure quality becomes acute. In general, the quality of an imaging system can be monitored by examining either the system itself or the product of the system (i.e., the digital image produced by the system). The system itself can be monitored by examining responses received from control points within the system, such as hardware or software components. Unfortunately, the following types of quality problems may not be detectable by examining system control points:
- * dust accumulation in the illumination and imaging system(s) or other optical or electronic defocus;
- * bad CCD, photo diode element(s), or picture element(s) (pel(s));
- * analog processing failures;
- * loose cables/connections, and defective components;
- * analog/digital conversion failures due to circuit failures or maladjusted reference points; and
- * data path problems due to shorts/opens on printed circuit cards in areas where standard techniques such as parity and checksums are not employed.
- Since these problems may not be detectable by examining the system control points in the system, unacceptable images may not be detected until the problem is discovered visually by an end user. It is important to detect and report these problems as soon as they occur. This is especially true in a high speed scanner application (e.g., image processing of bank checks) since the end user cannot monitor the scanner output quality in real time.
- A typical technique for determining problems is to present a test target to the scanner and analyze the scanner output. The problem is that this interferes with normal use of the scanner and reduces scanner throughput. Some known techniques (e.g., histogram analysis) attempt to overcome this problem by analyzing scanner output to determine if one gray level is more prevalent in the image that any other. Since these techniques make assumptions about the type of document that will be scanned (e.g., multi-shade or color document), they are only useful for certain applications (e.g., diagnostic mode testing). These techniques are also insensitive to isolated pel failures.
- The invented method, apparatus, and computer program product for determining image quality can be employed either during diagnostic mode or at run time of an imaging system. One component performs numerical analysis on a digital image. Another component accepts or rejects the quality of the digital image based on the results of the numerical analysis. In one embodiment, if the cumulative harmonic content of Fourier component amplitudes of a synthesized scan line exceeds a threshold value, the digital image is rejected as being of inadequate quality; otherwise the digital image is accepted. In another embodiment, a maximum gradient of a scan line of the digital image is computed. If, for some specified number of occurrences during a scan of a target, the maximum gradient exceeds a ceiling value or falls below a floor value, then the image is rejected.
- One advantage of the present invention is the ability to identify problems that can only be detected by inspection of the image data and to automatically notify the end user of the problem.
- Another advantage of the present invention is the ability to reliably diagnose imaging system hardware problems, including dead pel(s)/segment(s), optical or electronic defocus, and loose cables/connections.
- Yet another advantage of the present invention is the ability to identify defective images, which suggest a hardware/software problem, the first time the problem occurs.
- Another advantage of the present invention is the ability to monitor scanner performance over extended periods of time (e.g., weeks or months).
- The foregoing and other advantages of the present invention will be apparent to those skilled in the art of imaging technology in view of the accompanying drawings, description of the invention, and appended claims.
-
- FIG. 1
- is a block diagram of the basic elements of the present invention.
- FIG. 2
- is a block diagram of a structural environment in which the present invention can be employed.
- FIG. 3
- is a flow chart of the Fourier analysis embodiment of the present invention.
- FIG. 4
- is a graph diagram of an example maximum reflectance vector data.
- FIG. 4a through 4g
- are graph diagrams which illustrate the quality problems which can be identified by the Fourier Analysis embodiment of the present invention.
- FIG. 5
- is a flow chart of the Gradient Analysis embodiment of the present invention.
- FIG. 6
- is a graph diagram which illustrates a quality problem which can be identified by the Gradient analysis embodiment of the present invention.
- Referring now to FIG. 1, a block diagram provides an overview of the invented method, apparatus, and computer program product. The present invention can be employed either during diagnostic mode or at run time of an imaging system. 10 refers to a step or means for performing numerical analysis on a digital image. 12 refers to a step or means for accepting or rejecting the quality of the digital image based on the results of the numerical analysis. As used herein, "accept" means to meet some criteria and "reject" means to not meet that criteria. Once a digital image is accepted or rejected, other action may occur (e.g., notifying the end user or discarding the image).
- An
illustrative system 14 for collecting adigital image 16 is shown in FIG. 2. Thesystem 14 includes a focusing orimaging lens 18 and uses asensor 20 to capture an electrical representation of each line of a document or other target 22, based on either the black/white or gray characteristics of the target. - The target 22 to be imaged can be either stationary or transported by a moving track, moving conveyor line, rotating drum, or other transport 24, along a path beneath the
imaging lens 18. The target 22 is scanned to obtain data corresponding toindicia 26 existing on the target. The target 22 is moved in the direction X so that all portions of the target are eventually illuminated by a line oflight 28 which is produced by illuminatingdevices 30 of the system. Thisline 28 extends across the target 22 in a direction which is perpendicular to direction X. - Reflections from the
indicia 26 illuminated by theline 28 are focused by theimaging lens 18 onto thesensor 20. Theimaging lens 18 can be a graded index fiber lens or a conventional spherical lens, in which case the sensor could be shorter than the length of the line. Thesensor 20 is commercially available from various manufacturers and can be, for example, an array of photodiodes, a photoarray, or a charge coupled device (CCD) in which the impinging light on each sensor develops an electrical signal proportional to the amount of light. Each line of the sensor develops a number of pels (e.g., 1024), with each pel having a particular gray scale value (e.g., a value from 0 to 255), which value represents a portion of the target being scanned. The composite of these lines of the target 22 provides a digital image of the target being scanned. - Data obtained by the
sensor 20 is appropriately clocked out of the sensor and transferred to other electronic circuits of thesystem 14. The electrical signals pass on line to an analog-to-digital converter 32, which converts each pel into a digital representation which is then stored inmemory 34 for storage and further processing by acomputer 36 as desired.Memory 34 is preferably a random access memory (RAM) or other high speed electronic memory. For purposes herein, "computer" includes a device capable of performing the functions of a Turing Machine, including a microcomputer, minicomputer, or mainframe computer. A Turing Machine is a well-known computer science concept and is explained in Encyclopedia of Computer Science, Ed. Anthony Ralston, ISBN 0-88405-321-0, which is specifically incorporated herein by reference. For further details of an image capture and processing system, see U.S. Pat. No. 4,888,812 to Dinan et al., which is specifically incorporated herein by reference. - With the foregoing overview and background in mind, the following embodiments of the present invention are described.
- One embodiment of the present invention is a method for determining image quality of a digital image wherein if the cumulative harmonic content of Fourier component amplitudes of a synthesized scan line exceeds a threshold value, the digital image is rejected as being of inadequate quality; otherwise the digital image is accepted. If consecutive targets exhibit the problem, then there is a high likelihood of a scanner problem.
- FIG. 3 is a flow chart of a preferred implementation. The first step is to commence collecting a two-dimensional digital image,
step 100. Once collected, the digital image comprises an L x W matrix of numbers, D, where L is the number of matrix rows and W is the number of matrix columns. Each number is a measure of the light intensity (or reflectance) relative to a target and is contained within a cell denoted Dij (where i = 0 to L-1 and j = 0 to W-1). - Each number in matrix D is referred to herein as a "pel". For convenience, the numeric representation of a pel is assumed to be in decimal format herein, although it could also be represented in any one of a number of other formats (e.g., binary, hexadecimal, etc). The matrix is referred to herein as the "scan area". A particular column in the matrix or scan area is referred to herein as a "scan line".
- The digital image is collected using conventional imaging technology well known to those skilled in the art, and illustratively discussed above in connection with FIG. 2. For example, the image can be collected using an IBM 3897 image capture system or an IBM 3119 document scanner, both available from IBM Corporation. Of course, other commercially available imaging apparatus or document scanners can also be employed (e.g, LogiTech handheld scanners, Hewlett-Packard desktop scanners, etc).
- If the reflectance of the entire target is non-uniform (i.e., more than one shade or color),
step 102, then a maximum reflectance vector, v, is computed from the digital image,step 104, otherwise such a vector need not be computed. The latter case typically corresponds to a situation wherein a scan of a target with no printing (e.g., solid white, blue, etc.) is made during diagnostic mode. The former case is typical during run-time since it is desirable to collect the scan without requiring the user to present a special target to the scanner. - The maximum reflectance vector is created by selecting and storing the digital value of the pel representing the highest reflectance within each of the L rows of the image. Typically, although not necessarily, the highest reflectance value is white, represented by zero, and the lowest reflectance value is black, represented by 255. The maximum reflectance vector can be computed "on-the-fly" as each scan line is imaged and stored in D, or after the entire scan area has been stored. The following pseudocode is illustrative:
initialize all vi to the maximum value (e.g., 255)
If the maximum reflectance vector indicates that the target comprises only a portion of the scan area,step 106, then that portion is extracted,step 108. The portion W₁ to W₂ in FIG. 4, for example, would be extracted so as to omit those portions (0 to W₁ and W₂ to W-1) representative of the transport rather than the target. The result is a modified v, where the number of elements in v, denoted w, is less than or equal to W. If w is less than a power of 2, 2n,step 110, then the vector is expanded to include 2n pels,step 112, in order to optimizestep 114. For example, if the vector contained only 70 pels afterstep 108, then it would be expanded to the next higher power of 2 (i.e., 128) by interpolation. The values in the vector are then assumed to be the video level of the background of the target and this "synthesized scan line", v, is treated as the scan needed for analysis. - The synthesized scan line, v, is analyzed by calculating Fourier component amplitudes,
step 114, assuming the scan to be a periodic function. Fourier component amplitudes, A(u), are computed instep 114.
where q = √-1, and N is the number of elements in the synthesized scan line, v. - Preferably,
step 114 is computed using the Fast Fourier Transform (FFT) algorithm. Techniques for implementing FFT are well known to those skilled in the art. The following texts describe techniques for implementingstep 114 and are incorporated herein by reference: "Digital Image Processing", by R. C. Gonzalez, P. Wintz, ISBN 0-201-11026-1, Addison-Wesley Publishing Company (1987); and "Digital Signal Processing", Ed. by L. R. Rabiner, C. M. Rader, ISBN 0-87942-018-9, IEEE Press (1972). - Selected Fourier component amplitudes are summed in
step 116. By way of example, the fundamental, A(1), and nineteen harmonics amplitudes, A(2) to A(20), can be summed. The summation does not contain the average or DC component, A(0), and is therefore independent of the average background reflectance. Also, components which exhibit unusual spikes or other disturbances are excluded. - If the summation of the Fourier component amplitudes exceeds a threshold value,
step 118, then the digital image is rejected; otherwise it is accepted. The threshold value depends on the base quality of the device used to digitize the image and is therefore determined experimentally. The summation shows a distinct correlation to the problems being diagnosed since it exhibits a much higher value as compared to the value calculated from a scan free of such problems. This is an improvement over techniques based on video thresholding, which analyze only background video level. - Figures 4a through 4g graphically illustrate types of quality defects which can be identified using the Fourier Analysis embodiment of the present invention. FIG. 4a is a graph of a scan illustrating the presence of dust in the illumination system. Dust rarely settles uniformly. Results are evident from the scanned data. This non-uniformity of the image data results in growth of harmonic content of Fourier component amplitudes, as shown in FIG. 4b, which growth is used to identify a quality problem.
- In FIG. 4b,
reference curve 1 shows Fourier component amplitude of image data without dust andreference curve 2 shows the associated cumulative summation of the Fourier components amplitude.Reference curve 3 shows Fourier component amplitude of image data with dust andreference curve 4 shows the associated cumulative summation of the Fourier components amplitude. Note the difference in the cumulative summation values betweenreference curves - FIG. 4c illustrates video output of a 1024 CCD device having sixteen segments. One segment is shown dead. Every pel in this interleaved segment is shown having a video level of 128. Although a video level of 128 (< 255) has been used in the example, a higher value can be used to provide higher detectability. The problem may lie in the CCD analog card or in subsequent signal processing cards. The video data corresponding to pels 256, 258, 260 ... 384 (64 pels) in FIG. 4c is set to 128. Remaining pels illustrate normal output. FIG. 4d illustrates the corresponding Fourier analysis results.
Reference curve 1 shows Fourier component amplitude of image data with a dead segment andreference curve 2 shows the associated cumulative summation of the Fourier components amplitude. The cumulative summation is above the normal sum. - FIG. 4e illustrates a situation where four consecutive pels are dead (i.e., video level is 255). This condition may occur due to either an electronics failure or due to the presence of a dust particle on the optical viewing window. In this illustration, only one region exhibits the problem, i.e., only pels 257, 258, 259 and 260 have been blocked. FIG. 4f shows the corresponding Fourier component amplitudes for the dead pel condition illustrated in FIG. 4e.
Reference curve 1 shows Fourier component amplitude of image data with four blocked pels andreference curve 2 shows the associated cumulative summation of the Fourier components amplitude. Again, the cumulative summation is above the normal sum. - FIG. 4g plots the cumulative summation for each of the three abnormal conditions illustrated in FIGs. 4b, 4d, and 4f, along with their associated normal sums. By suitably selecting an amplitude threshold (e.g., 10000), one can distinguish between a normal function (1) and an abnormal function (2, 3, or 4).
- In another embodiment, a maximum gradient of a scan line of the digital image is computed. For a given imaging system, the maximum video gradient value, G, computed will fall between a ceiling value, Gmax, and a floor value, Gmin. Properties inherent in the system design, such as resolution, illumination, and optical quality, limit G to some Gmax. G should equal or exceed some Gmin because the system should always meet some minimum performance criteria. No test target is necessary for gradient analysis and the analysis does not require a lot of computations. Thus it can be performed real time without impacting scanner throughput. If a problem arises, it can be identified on the first image affected and problems as small as a single pel failure can be detected.
- In an imaging system, the overall modulation transfer function (MTF) achieved by the system defines the system's ability to resolve fine details in an image. If the MTF is low then the system will produce images with softened edges. The crispness of the edges can be quantified by computing the maximum video gradient present in a scanned image. Soft edges will result in low gradient values. Sharp edges will result in high gradient values.
- FIG. 5 is a flow chart of a preferred implementation at the beginning of each target scan. The following description assumes that G is computed on at least one column in D. The invention can also be applied in a row-wise fashion, or in a column-wise and row-wise fashion concurrently.
- In
step 150, counters (CTR) Gmin CTR, Gmax CTR, and threshold variables T1, T2, and T3, are initialized. Then, instep 152, a line is scanned such that a scan line, is created. If the scan line does not include at least some portion of the target,step 156, then another line is scanned until the target is located,step 156, or the scan is complete,step 154. - Once the target has been located, the maximum pel-to-pel difference (in absolute value terms), G, within the scan line is computed in
step 158. G can be computed "on-the-fly" as each scan line is imaged and stored in D, or after the entire scan area has been stored. For a given scan line j in matrix D, G is illustratively computed in pseudocode as follows:
If G is greater than Gmax,step 160, then Gmax CTR is incremented,step 162. Similarly, if G is less than Gmin,step 164, then Gmin CTR is incremented. - Once the scan is complete, then the following analysis is made. If Gmax CTR is greater than T1,
step 168, then the digital image is rejected since this indicates that dead video pel(s)/segment(s) were discovered. If Gmin CTR is greater than T2,step 170, then the digital image is also rejected since this indicates that the camera is non-responsive (e.g., out of focus); otherwise, the digital image is considered acceptable. By way of example, T1 might be set to 16, whereas T2 might be set to 2. The precise values will vary depending on the characteristics of the scanner and the tolerances chosen by a particular designer. - Dead pel(s) in the system will cause the maximum video gradient to exceed the possible range. Even a single pel failure will easily be detected. FIG. 6 illustrates the maximum video gradient computed for 32 scans taken from a scanner that has one dead pixel and a scanner that has no problems. The top plot corresponds to dead pixel or dead segment (Avg. 204, 1 sigma 13). The bottom plot corresponds to normal focused scanner (Avg. 99, 1 sigma 12). The difference between the maximum video gradient computed with and without a dead pixel exceeds 64 for all scans. By choosing an appropriate threshold, a dead pixel is detectable in the system and can be detected on the first document affected.
- In order to monitor the longer term quality of an imaging device, an average maximum video gradient can also be advantageously employed. T3 is initialized to zero at the beginning of each document scan. Following each scan, if T3 < Gmax, then T3 is incremented by one. This process continues until the end of the document scan. Then, T3 is stored in memory, and T3 is reset to zero. For each day, a certain number of T3 values are averaged. The average value reflects the scanner performance. A spline fit through these points over several days/weeks of data provides a measurable parameter that indicates the changes taking place in the scanner performance. When this value falls below a programmable threshold, the user is alerted to take corrective action.
- Preferably, the numerical analysis and acceptance/rejection elements of the present invention are performed by a computer program, that is, a series of stored program instructions, executing on a computer. During operation, the computer program comprises a special purpose apparatus for determining image quality. Further, the computer program, when stored on a computer readable medium such as a flexible diskette, hard disk, CD-ROM, or other similar device, comprises an article of manufacture.
- Alternatively, the invention may be embodied in an electronic device which includes circuitry for performing the functions corresponding to the described numerical analysis and acceptance/rejection elements.
- Of course, many modifications and adaptations to the present invention could be made to advantage without departing from the spirit of this invention. Further some features of the present invention could be used without corresponding use of other features. Accordingly, this description should be considered as merely illustrative of the principles of the present invention and not in limitation thereof.
Claims (23)
- A method for determining image quality of a digital image, D, wherein D is represented as an L x W matrix of numbers representative of light intensity contained within cells denoted as Dij, where i = 0 to L-1, j = 0 to W-1, L is the number of matrix rows, and W is the number of matrix columns, comprising the steps of:a) performing numerical analysis on the digital image with a computer to determine a quality measure, wherein said numerical analysis involves more than comparing Dij to one or more threshold values; andb) accepting or rejecting the digital image based on the quality measure.
- The image quality detection method according to claim 1, wherein step (a) includes computing a cumulative harmonic content of Fourier component amplitudes of a synthesized scan line of the digital image to be the quality measure.
- The image quality detection method according to claim 2, wherein computing the cumulative harmonic content of Fourier component amplitudes includes the steps of:a) computing a vector, v, where vi is the minimum of vi and Dij;b) re-computing v to contain only values representative of a target;c) expanding v to contain 2n values if the number of values in v is less than 2n;d) computing Fourier component amplitudes, A(u), aswhere q = √-1, and N is the number of elements in v; and
 e) summing selected A(u).
 - The image quality detection method according to claim 3, wherein said vector computing and re-computing steps are replaced with the step of computing a vector, v, where vi contain only values representative of a target having a uniform background.
- The image quality detection method according to claim 3, wherein Fourier component amplitudes are computing using the Fast Fourier Transform.
- The image quality detection method according to claim 3, wherein accepting or rejecting the digital image is based on whether the summation of the selected Fourier component amplitudes exceeds a predefined threshold.
- The image quality detection method according to claim 1, wherein step (a) includes computing a maximum gradient of at least one scan line of the digital image to be the quality measure.
- The image quality detection method according to claim 7, wherein computing the maximum gradient of at least one scan line includes the steps of:a) processing each scan line in D until a scan line, j, is located which includes data representative of a target;b) computing a vector, g, where gl equals Dlj - Dl+1j, and lequals 0 to L-2;c) computing a maximum gradient, G, where G equals the absolute value of the maximum value in g;d) incrementing a counter, Gmax CTR, if G is greater than a predefined maximum, Gmax; ande) incrementing a counter, Gmin CTR, if G is less than a predefined minimum, Gmin.
- The image quality detection method according to claim 8, wherein accepting or rejecting the digital image is based on whether Gmax CTR exceeds a predefined threshold, T1.
- The image quality detection method according to claim 8, wherein accepting or rejecting the digital image is based on whether Gmin CTR exceeds a predefined threshold, T2.
- The image quality detection apparatus according to claim 7, wherein accepting or rejecting the digital image is based on whether an average of maximum gradient values exceeds a predefined threshold of some predefined time period.
- Apparatus for determining image quality of a digital image, D, wherein D is represented as an L x W matrix of numbers representative of light intensity contained within cells denoted as Dij, where i = 0 to L-1, j = 0 to W-1, L is the number of matrix rows, and W is the number of matrix columns, comprising:a) means for performing numerical analysis on the digital image with a computer to determine a quality measure, wherein said numerical analysis involves more than comparing Dij to one or more threshold values; andb) means for accepting or rejecting the digital image based on the quality measure.
- The image quality detection apparatus according to claim 12, wherein said numerical analysis means includes means for computing a cumulative harmonic content of Fourier component amplitudes of a synthesized scan line of the digital image to be the quality measure.
- The image quality detection apparatus according to claim 13, wherein said means for computing the cumulative harmonic content of Fourier component amplitudes includes:a) means for computing a vector, v, where vi is the minimum of vi and Dij;b) means for re-computing v to contain only values representative of a target;c) means for expanding v to contain 2n values if the number of values in v is less than 2n;d) means for computing Fourier component amplitudes, A(u), aswhere q = √-1, and N is the number of elements in v; and
 e) means for summing selected A(u).
 - The image quality detection apparatus according to claim 14, wherein said vector computing and re-computing means are replaced with means for computing a vector, v, where vi contain only values representative of a target having a uniform background.
- The image quality detection apparatus according to claim 14, wherein said means for computing Fourier component amplitudes is means for performing the Fast Fourier Transform.
- The image quality detection apparatus according to claim 14, wherein said means for accepting or rejecting the digital image is based on whether the summation of the selected Fourier component amplitudes exceeds a predefined threshold.
- The image quality detection apparatus according to claim 12, wherein said numerical analysis means includes means for computing a maximum gradient of at least one scan line of the digital image to be the quality measure.
- The image quality detection apparatus according to claim 18, wherein means for computing the maximum gradient of at least one scan line includes:a) means for processing each scan line in D until a scan line, j, is located which includes data representative of a target;b) computing a vector, g, where gl equals Dlj - Dl+1j, and l equals 0 to L-2;c) means for computing a maximum gradient, G, where G equals the absolute value of the maximum value in g;d) means for incrementing a counter, Gmax CTR, if G is greater than a predefined maximum, Gmax; ande) means for incrementing a counter, Gmin CTR, if G is less than a predefined minimum, Gmin.
- The image quality detection apparatus according to claim 19, wherein said means for accepting or rejecting the digital image is based on whether Gmax CTR exceeds a predefined threshold, T1.
- The image quality detection apparatus according to claim 19, wherein said means for accepting or rejecting the digital image is based on whether Gmin CTR exceeds a predefined threshold, T2.
- The image quality detection apparatus according to claim 19, wherein said means for accepting or rejecting the digital image is based on whether an average of maximum gradient values exceeds a predefined threshold of some predefined time period.
- The image quality detection apparatus according to any one of the above claims 12 to 22, wherein the apparatus is a computer program product having a computer readable medium having computer program logic recorded thereon.
Applications Claiming Priority (2)
| Application Number | Priority Date | Filing Date | Title |
|---|---|---|---|
| US292545 | 1994-08-18 | ||
| US08/292,545 US5692065A (en) | 1994-08-18 | 1994-08-18 | Apparatus and method for determining image quality |
Publications (1)
| Publication Number | Publication Date |
|---|---|
| EP0697677A2 true EP0697677A2 (en) | 1996-02-21 |
Family
ID=23125127
Family Applications (1)
| Application Number | Title | Priority Date | Filing Date |
|---|---|---|---|
| EP95112396A Withdrawn EP0697677A2 (en) | 1994-08-18 | 1995-08-07 | Apparatus and method for determining image quality |
Country Status (3)
| Country | Link |
|---|---|
| US (2) | US5692065A (en) |
| EP (1) | EP0697677A2 (en) |
| JP (1) | JP3137561B2 (en) |
Cited By (4)
| Publication number | Priority date | Publication date | Assignee | Title |
|---|---|---|---|---|
| WO1998009427A1 (en) * | 1996-08-28 | 1998-03-05 | Ralip International Ab | Method and arrangement for ensuring quality during scanning/copying of images/documents |
| EP1349362A2 (en) * | 2002-03-29 | 2003-10-01 | Fuji Photo Film Co. Ltd. | Image processing diagnostic method |
| US20130050485A1 (en) * | 2011-08-23 | 2013-02-28 | Aireyes, Inc. | Automatic detection of image degradation in enhanced vision systems |
| CN111914781A (en) * | 2020-08-10 | 2020-11-10 | 杭州海康威视数字技术股份有限公司 | Method and device for processing face image |
Families Citing this family (40)
| Publication number | Priority date | Publication date | Assignee | Title |
|---|---|---|---|---|
| US5987153A (en) * | 1996-04-29 | 1999-11-16 | Quintet, Inc. | Automated verification and prevention of spoofing for biometric data |
| GB9703191D0 (en) * | 1997-02-15 | 1997-04-02 | Ncr Int Inc | Method and apparatus for screening documents |
| US6330345B1 (en) * | 1997-11-17 | 2001-12-11 | Veridicom, Inc. | Automatic adjustment processing for sensor devices |
| US6243501B1 (en) * | 1998-05-20 | 2001-06-05 | Canon Kabushiki Kaisha | Adaptive recognition of documents using layout attributes |
| US6593961B1 (en) * | 1998-10-30 | 2003-07-15 | Agilent Technologies, Inc. | Test efficient method of classifying image quality of an optical sensor using three categories of pixels |
| US7126631B1 (en) * | 1999-06-30 | 2006-10-24 | Intel Corporation | Sensing with defective cell detection |
| US6639999B1 (en) * | 1999-11-04 | 2003-10-28 | Eastman Kodak Company | Apparatus for assessing overall quality of hardcopy images |
| US6658139B1 (en) * | 1999-11-04 | 2003-12-02 | Eastman Kodak Company | Method for assessing overall quality of digital images |
| US6643416B1 (en) | 1999-11-30 | 2003-11-04 | Eastman Kodak Company | Method for determining necessary resolution for zoom and crop images |
| US6990251B2 (en) * | 2000-02-03 | 2006-01-24 | Eastman Kodak Company | Method, system, and software for signal processing using sheep and shepherd artifacts |
| US6904180B1 (en) * | 2000-10-27 | 2005-06-07 | Eastman Kodak Company | Method for detecting image interpolation |
| US7031026B2 (en) * | 2001-05-21 | 2006-04-18 | International Business Machines Corporation | Defect and maintenance detection for image capture device |
| US7480420B2 (en) * | 2002-09-04 | 2009-01-20 | Transpacific Ip, Ltd. | Method for recognizing abnormal image |
| US7406183B2 (en) * | 2003-04-28 | 2008-07-29 | International Business Machines Corporation | System and method of sorting document images based on image quality |
| US7792335B2 (en) | 2006-02-24 | 2010-09-07 | Fotonation Vision Limited | Method and apparatus for selective disqualification of digital images |
| US7388681B2 (en) | 2003-07-29 | 2008-06-17 | International Business Machines Corporation | Method for scanning maintenance prediction |
| US7257238B2 (en) * | 2003-07-29 | 2007-08-14 | International Business Machines Corporation | System, apparatus, and method for image scanning quality adjustment |
| US7289679B2 (en) * | 2003-08-12 | 2007-10-30 | International Business Machines Corporation | System and method for measuring image quality using compressed image data |
| EP1519314A1 (en) * | 2003-09-25 | 2005-03-30 | Siemens Building Technologies AG | Method and analysis tool for checking functionality of video surveillance devices and measuring system for carrying out the method |
| US7522760B1 (en) | 2003-10-17 | 2009-04-21 | Carreker Corporation | Method for inspecting document images |
| US7602957B2 (en) * | 2003-12-10 | 2009-10-13 | Ncr Corporation | Image-based check processing system and a method of operating an image-based check processing system to test focus of an imaging camera |
| US7283656B2 (en) * | 2004-03-17 | 2007-10-16 | Federal Reserve Bank Of Cleveland | Assessing electronic image quality |
| US8488023B2 (en) | 2009-05-20 | 2013-07-16 | DigitalOptics Corporation Europe Limited | Identifying facial expressions in acquired digital images |
| US7594600B2 (en) * | 2005-02-28 | 2009-09-29 | Federal Reserve Bank Of Atlanta | Expanded mass data sets for electronic check processing |
| US7686209B2 (en) | 2005-02-28 | 2010-03-30 | Federal Reserve Bank Of Dallas | Cash letter print streams with audit data |
| US7254254B2 (en) * | 2005-03-29 | 2007-08-07 | Brother Kogyo Kabushiki Kaisha | Method of evaluating quality of image and use thereof |
| US7802717B2 (en) | 2005-07-07 | 2010-09-28 | Federal Reserve Bank Of Dallas | Electronic image cash letter monitoring |
| US8032462B2 (en) | 2005-07-07 | 2011-10-04 | Federal Reserve Bank Of Kansas City | Electronic image cash letter balancing |
| US7522761B2 (en) * | 2005-09-02 | 2009-04-21 | International Business Machines Corporation | System and method for detecting a streak in a compressed gray scale image |
| US7804983B2 (en) | 2006-02-24 | 2010-09-28 | Fotonation Vision Limited | Digital image acquisition control and correction method and apparatus |
| US7551754B2 (en) * | 2006-02-24 | 2009-06-23 | Fotonation Vision Limited | Method and apparatus for selective rejection of digital images |
| US8387862B2 (en) | 2006-05-17 | 2013-03-05 | Federal Reserve Bank Of Dallas | Electronic image cash letter validation |
| US7831083B1 (en) * | 2006-07-13 | 2010-11-09 | Kla-Tencor Technologies Corporation | Image quality monitoring for substrate inspection |
| US20080162321A1 (en) | 2006-11-07 | 2008-07-03 | Breeden Benjamin T | System and method for processing duplicative electronic check return files |
| US8573498B2 (en) | 2007-11-06 | 2013-11-05 | Federal Reserve Bank Of Kansas City | Identifying duplicate printed paper cash letters |
| US7918386B2 (en) | 2007-11-06 | 2011-04-05 | Federal Reserve Bank Of Kansas City | Cash letter print verification |
| US8750578B2 (en) * | 2008-01-29 | 2014-06-10 | DigitalOptics Corporation Europe Limited | Detecting facial expressions in digital images |
| US8238638B2 (en) | 2008-01-31 | 2012-08-07 | Federal Reserve Bank Of Kansas City | Tag validation for efficiently assessing electronic check image quality |
| US9881354B2 (en) * | 2012-03-15 | 2018-01-30 | Microsoft Technology Licensing, Llc | Image completion including automatic cropping |
| CN111919438B (en) | 2018-02-28 | 2023-11-10 | 铁路视像有限公司 | System and method for built-in testing of optical sensors |
Citations (1)
| Publication number | Priority date | Publication date | Assignee | Title |
|---|---|---|---|---|
| US4888812A (en) | 1987-12-18 | 1989-12-19 | International Business Machines Corporation | Document image processing system |
Family Cites Families (24)
| Publication number | Priority date | Publication date | Assignee | Title |
|---|---|---|---|---|
| DE2244340C2 (en) * | 1972-09-09 | 1986-02-06 | Agfa-Gevaert Ag, 5090 Leverkusen | Method and device for the preliminary examination of master copies |
| DE2654943C2 (en) * | 1976-12-03 | 1985-10-24 | Agfa-Gevaert Ag, 5090 Leverkusen | Method and device for the preliminary examination of master copies combined to form a master tape |
| JPS5868040A (en) * | 1981-10-19 | 1983-04-22 | Konan Camera Kenkyusho:Kk | Measuring device for correcting rate of gradation |
| US4427998A (en) * | 1982-04-15 | 1984-01-24 | Teletype Corporation | Apparatus for adjusting a facsimile document scanner |
| US4519041A (en) * | 1982-05-03 | 1985-05-21 | Honeywell Inc. | Real time automated inspection |
| US4523231A (en) * | 1983-01-26 | 1985-06-11 | Ncr Canada Ltd - Ncr Canada Ltee | Method and system for automatically detecting camera picture element failure |
| JPS59162514A (en) * | 1983-03-08 | 1984-09-13 | Dainippon Screen Mfg Co Ltd | Focus adjusting method of image scanning and recording device |
| DE3408765A1 (en) * | 1984-03-09 | 1985-09-12 | Agfa-Gevaert Ag, 5090 Leverkusen | METHOD AND DEVICE FOR DIFFERENTIATING SHARP COPIES FROM Fuzzy |
| US5255331A (en) * | 1984-06-20 | 1993-10-19 | The Governor And Company Of The Bank Of England | Production of an image model and inspection of a pixel representation of an image |
| GB2164442A (en) * | 1984-09-11 | 1986-03-19 | De La Rue Syst | Sensing the condition of a document |
| US4647981A (en) * | 1984-10-25 | 1987-03-03 | Xerox Corporation | Automatic white level control for a RIS |
| US4724330A (en) * | 1986-09-24 | 1988-02-09 | Xerox Corporation | Self aligning raster input scanner |
| DE3636077C2 (en) * | 1986-10-23 | 1993-10-07 | Broadcast Television Syst | Method for masking errors in a video signal and circuit for carrying out the method |
| US4757389A (en) * | 1987-06-15 | 1988-07-12 | Xerox Corporation | Calibration improvement with dither for a raster input scanner |
| JPS6469159A (en) * | 1987-09-10 | 1989-03-15 | Minolta Camera Kk | Picture reader |
| DE3925457C3 (en) * | 1988-08-01 | 1995-12-07 | Konishiroku Photo Ind | Color image processing apparatus |
| GB8906587D0 (en) * | 1989-03-22 | 1989-05-04 | Philips Electronic Associated | Region/texture coding systems |
| JPH02311083A (en) * | 1989-05-26 | 1990-12-26 | Ricoh Co Ltd | Original reader |
| US5040228A (en) * | 1989-08-28 | 1991-08-13 | At&T Bell Laboratories | Method and apparatus for automatically focusing an image-acquisition device |
| US5144566A (en) * | 1990-06-14 | 1992-09-01 | Comar, Inc. | Method for determining the quality of print using pixel intensity level frequency distributions |
| DE59208384D1 (en) * | 1991-08-12 | 1997-05-28 | Koenig & Bauer Ag | Quality control of an image template e.g. B. a printed pattern |
| US5566245A (en) * | 1993-03-09 | 1996-10-15 | United Parcel Service Of America, Inc. | The performance of a printer or an imaging system using transform-based quality measures |
| US5561532A (en) * | 1993-03-31 | 1996-10-01 | Canon Kabushiki Kaisha | Image reproducing apparatus |
| US5642433A (en) * | 1995-07-31 | 1997-06-24 | Neopath, Inc. | Method and apparatus for image contrast quality evaluation |
-
1994
- 1994-08-18 US US08/292,545 patent/US5692065A/en not_active Expired - Fee Related
-
1995
- 1995-07-18 JP JP07181919A patent/JP3137561B2/en not_active Expired - Fee Related
- 1995-08-07 EP EP95112396A patent/EP0697677A2/en not_active Withdrawn
-
1997
- 1997-04-24 US US08/834,605 patent/US5963654A/en not_active Expired - Fee Related
Patent Citations (1)
| Publication number | Priority date | Publication date | Assignee | Title |
|---|---|---|---|---|
| US4888812A (en) | 1987-12-18 | 1989-12-19 | International Business Machines Corporation | Document image processing system |
Non-Patent Citations (3)
| Title |
|---|
| ANTHONY RALSTON: "Encyclopedia of Computer Science", ISBN: 0-88405-321-0 |
| L.R. RABINER, C.M. RADER: "Digital signal processing", 1972, IEEE PRESS, ISBN: 0-87942-018-9 |
| R.C. GONZALEZ, P. WINTZ: "Digital image processing", 1987, ADDISON-WESLEY PUBLISHING COMPANY, ISBN: 0-201-11026-1 |
Cited By (8)
| Publication number | Priority date | Publication date | Assignee | Title |
|---|---|---|---|---|
| WO1998009427A1 (en) * | 1996-08-28 | 1998-03-05 | Ralip International Ab | Method and arrangement for ensuring quality during scanning/copying of images/documents |
| US6345130B1 (en) | 1996-08-28 | 2002-02-05 | Ralip International Ab | Method and arrangement for ensuring quality during scanning/copying of images/documents |
| EP1349362A2 (en) * | 2002-03-29 | 2003-10-01 | Fuji Photo Film Co. Ltd. | Image processing diagnostic method |
| EP1349362A3 (en) * | 2002-03-29 | 2004-12-22 | Fuji Photo Film Co. Ltd. | Image processing diagnostic method |
| US20130050485A1 (en) * | 2011-08-23 | 2013-02-28 | Aireyes, Inc. | Automatic detection of image degradation in enhanced vision systems |
| US8711220B2 (en) * | 2011-08-23 | 2014-04-29 | Aireyes, Inc. | Automatic detection of image degradation in enhanced vision systems |
| CN111914781A (en) * | 2020-08-10 | 2020-11-10 | 杭州海康威视数字技术股份有限公司 | Method and device for processing face image |
| CN111914781B (en) * | 2020-08-10 | 2024-03-19 | 杭州海康威视数字技术股份有限公司 | Face image processing method and device |
Also Published As
| Publication number | Publication date |
|---|---|
| US5692065A (en) | 1997-11-25 |
| JP3137561B2 (en) | 2001-02-26 |
| JPH0869534A (en) | 1996-03-12 |
| US5963654A (en) | 1999-10-05 |
Similar Documents
| Publication | Publication Date | Title |
|---|---|---|
| US5692065A (en) | Apparatus and method for determining image quality | |
| EP0521662B1 (en) | Improved automatic image segmentation | |
| US8139117B2 (en) | Image quality analysis with test pattern | |
| JP2728235B2 (en) | Image quality analysis method | |
| US6970606B2 (en) | Automatic image quality evaluation and correction technique for digitized and thresholded document images | |
| US4742557A (en) | Adaptive character extraction method and system | |
| EP0179309A2 (en) | Automatic defect detection system | |
| US5029226A (en) | Method and apparatus for effecting spot/void filtering of image data | |
| US5093871A (en) | Method and apparatus for effecting background suppression of image data | |
| US7333656B2 (en) | Image processing method and image processing apparatus | |
| EP0499875A1 (en) | Method of and apparatus for obtaining binary image | |
| US6961476B2 (en) | Autothresholding of noisy images | |
| JP3906221B2 (en) | Image processing method and image processing apparatus | |
| US6795592B2 (en) | Architecture for processing fingerprint images | |
| JP3234636B2 (en) | Defect inspection equipment | |
| JP3202330B2 (en) | Defect inspection equipment | |
| US7623735B2 (en) | Method for differentiating dynamic range of image | |
| JP2984388B2 (en) | Surface inspection method | |
| WO1991006065A2 (en) | Image data processor system | |
| JPH0436643A (en) | Tablet inspection device | |
| JPH06103399A (en) | Image processor | |
| JPH09179979A (en) | Defect detecting device | |
| JPS6346579A (en) | Image processor | |
| Albritton | Image analysis and segmentation based on the circular pipeline video processor | |
| JPH06164931A (en) | Picture signal processor |
Legal Events
| Date | Code | Title | Description |
|---|---|---|---|
| PUAI | Public reference made under article 153(3) epc to a published international application that has entered the european phase |
Free format text: ORIGINAL CODE: 0009012 |
|
| AK | Designated contracting states |
Kind code of ref document: A2 Designated state(s): DE FR GB |
|
| STAA | Information on the status of an ep patent application or granted ep patent |
Free format text: STATUS: THE APPLICATION HAS BEEN WITHDRAWN |
|
| 18W | Application withdrawn |
Withdrawal date: 19960716 |