EP0605662B1 - An infrared attenuation measuring system - Google Patents
An infrared attenuation measuring system Download PDFInfo
- Publication number
- EP0605662B1 EP0605662B1 EP93906314A EP93906314A EP0605662B1 EP 0605662 B1 EP0605662 B1 EP 0605662B1 EP 93906314 A EP93906314 A EP 93906314A EP 93906314 A EP93906314 A EP 93906314A EP 0605662 B1 EP0605662 B1 EP 0605662B1
- Authority
- EP
- European Patent Office
- Prior art keywords
- sample
- fat
- homogenization
- infrared attenuation
- wavebands
- Prior art date
- Legal status (The legal status is an assumption and is not a legal conclusion. Google has not performed a legal analysis and makes no representation as to the accuracy of the status listed.)
- Expired - Lifetime
Links
- 238000000265 homogenisation Methods 0.000 claims abstract description 79
- 238000000034 method Methods 0.000 claims abstract description 23
- 235000013336 milk Nutrition 0.000 claims abstract description 14
- 239000008267 milk Substances 0.000 claims abstract description 14
- 210000004080 milk Anatomy 0.000 claims abstract description 14
- 239000000126 substance Substances 0.000 claims abstract description 11
- 238000013528 artificial neural network Methods 0.000 claims abstract description 5
- 230000003287 optical effect Effects 0.000 claims abstract description 3
- 230000009466 transformation Effects 0.000 claims abstract description 3
- 238000005259 measurement Methods 0.000 claims description 19
- GUBGYTABKSRVRQ-QKKXKWKRSA-N Lactose Natural products OC[C@H]1O[C@@H](O[C@H]2[C@H](O)[C@@H](O)C(O)O[C@@H]2CO)[C@H](O)[C@@H](O)[C@H]1O GUBGYTABKSRVRQ-QKKXKWKRSA-N 0.000 claims description 11
- 239000008101 lactose Substances 0.000 claims description 11
- 235000018102 proteins Nutrition 0.000 claims description 11
- 102000004169 proteins and genes Human genes 0.000 claims description 11
- 108090000623 proteins and genes Proteins 0.000 claims description 11
- KRKNYBCHXYNGOX-UHFFFAOYSA-N citric acid Chemical compound OC(=O)CC(O)(C(O)=O)CC(O)=O KRKNYBCHXYNGOX-UHFFFAOYSA-N 0.000 claims description 9
- 235000020185 raw untreated milk Nutrition 0.000 claims description 9
- 238000004422 calculation algorithm Methods 0.000 claims description 5
- XSQUKJJJFZCRTK-UHFFFAOYSA-N Urea Chemical compound NC(N)=O XSQUKJJJFZCRTK-UHFFFAOYSA-N 0.000 claims description 4
- 239000004202 carbamide Substances 0.000 claims description 3
- 239000003242 anti bacterial agent Substances 0.000 claims description 2
- 229940088710 antibiotic agent Drugs 0.000 claims description 2
- 235000013877 carbamide Nutrition 0.000 claims description 2
- 150000001720 carbohydrates Chemical class 0.000 claims description 2
- 235000014633 carbohydrates Nutrition 0.000 claims description 2
- 239000005018 casein Substances 0.000 claims description 2
- BECPQYXYKAMYBN-UHFFFAOYSA-N casein, tech. Chemical compound NCCCCC(C(O)=O)N=C(O)C(CC(O)=O)N=C(O)C(CCC(O)=N)N=C(O)C(CC(C)C)N=C(O)C(CCC(O)=O)N=C(O)C(CC(O)=O)N=C(O)C(CCC(O)=O)N=C(O)C(C(C)O)N=C(O)C(CCC(O)=N)N=C(O)C(CCC(O)=N)N=C(O)C(CCC(O)=N)N=C(O)C(CCC(O)=O)N=C(O)C(CCC(O)=O)N=C(O)C(COP(O)(O)=O)N=C(O)C(CCC(O)=N)N=C(O)C(N)CC1=CC=CC=C1 BECPQYXYKAMYBN-UHFFFAOYSA-N 0.000 claims description 2
- 235000021240 caseins Nutrition 0.000 claims description 2
- 235000015165 citric acid Nutrition 0.000 claims description 2
- 235000021588 free fatty acids Nutrition 0.000 claims description 2
- 238000012417 linear regression Methods 0.000 claims description 2
- 239000011159 matrix material Substances 0.000 claims description 2
- 238000012628 principal component regression Methods 0.000 claims description 2
- -1 somatic cells Substances 0.000 claims description 2
- 210000001082 somatic cell Anatomy 0.000 claims description 2
- 238000005033 Fourier transform infrared spectroscopy Methods 0.000 abstract description 2
- 239000000523 sample Substances 0.000 description 76
- 235000019197 fats Nutrition 0.000 description 56
- 238000001228 spectrum Methods 0.000 description 13
- 238000009826 distribution Methods 0.000 description 8
- 238000002835 absorbance Methods 0.000 description 7
- 238000004458 analytical method Methods 0.000 description 7
- 238000012360 testing method Methods 0.000 description 5
- 230000007423 decrease Effects 0.000 description 4
- 238000004433 infrared transmission spectrum Methods 0.000 description 4
- 230000003595 spectral effect Effects 0.000 description 4
- 230000009897 systematic effect Effects 0.000 description 4
- 238000004364 calculation method Methods 0.000 description 3
- 238000002790 cross-validation Methods 0.000 description 3
- 230000003247 decreasing effect Effects 0.000 description 3
- 241000283690 Bos taurus Species 0.000 description 2
- 238000000149 argon plasma sintering Methods 0.000 description 2
- 230000005540 biological transmission Effects 0.000 description 2
- 235000019625 fat content Nutrition 0.000 description 2
- 244000144980 herd Species 0.000 description 2
- 238000012544 monitoring process Methods 0.000 description 2
- 238000007430 reference method Methods 0.000 description 2
- 239000007787 solid Substances 0.000 description 2
- GUBGYTABKSRVRQ-XLOQQCSPSA-N Alpha-Lactose Chemical compound O[C@@H]1[C@@H](O)[C@@H](O)[C@@H](CO)O[C@H]1O[C@@H]1[C@@H](CO)O[C@H](O)[C@H](O)[C@H]1O GUBGYTABKSRVRQ-XLOQQCSPSA-N 0.000 description 1
- 238000010521 absorption reaction Methods 0.000 description 1
- 235000014121 butter Nutrition 0.000 description 1
- WUKWITHWXAAZEY-UHFFFAOYSA-L calcium difluoride Chemical compound [F-].[F-].[Ca+2] WUKWITHWXAAZEY-UHFFFAOYSA-L 0.000 description 1
- 229910001634 calcium fluoride Inorganic materials 0.000 description 1
- 235000013351 cheese Nutrition 0.000 description 1
- 239000008367 deionised water Substances 0.000 description 1
- 238000010586 diagram Methods 0.000 description 1
- 230000006872 improvement Effects 0.000 description 1
- 238000002329 infrared spectrum Methods 0.000 description 1
- 230000003993 interaction Effects 0.000 description 1
- 238000011835 investigation Methods 0.000 description 1
- 238000012067 mathematical method Methods 0.000 description 1
- 239000000203 mixture Substances 0.000 description 1
- 238000012545 processing Methods 0.000 description 1
- 238000011160 research Methods 0.000 description 1
- 230000004044 response Effects 0.000 description 1
- 238000013112 stability test Methods 0.000 description 1
- 238000000411 transmission spectrum Methods 0.000 description 1
- 238000010200 validation analysis Methods 0.000 description 1
Images


Classifications
-
- G—PHYSICS
- G01—MEASURING; TESTING
- G01N—INVESTIGATING OR ANALYSING MATERIALS BY DETERMINING THEIR CHEMICAL OR PHYSICAL PROPERTIES
- G01N33/00—Investigating or analysing materials by specific methods not covered by groups G01N1/00 - G01N31/00
- G01N33/02—Food
- G01N33/04—Dairy products
- G01N33/06—Determining fat content, e.g. by butyrometer
-
- G—PHYSICS
- G01—MEASURING; TESTING
- G01N—INVESTIGATING OR ANALYSING MATERIALS BY DETERMINING THEIR CHEMICAL OR PHYSICAL PROPERTIES
- G01N21/00—Investigating or analysing materials by the use of optical means, i.e. using sub-millimetre waves, infrared, visible or ultraviolet light
- G01N21/17—Systems in which incident light is modified in accordance with the properties of the material investigated
- G01N21/25—Colour; Spectral properties, i.e. comparison of effect of material on the light at two or more different wavelengths or wavelength bands
- G01N21/31—Investigating relative effect of material at wavelengths characteristic of specific elements or molecules, e.g. atomic absorption spectrometry
- G01N21/35—Investigating relative effect of material at wavelengths characteristic of specific elements or molecules, e.g. atomic absorption spectrometry using infrared light
- G01N21/3577—Investigating relative effect of material at wavelengths characteristic of specific elements or molecules, e.g. atomic absorption spectrometry using infrared light for analysing liquids, e.g. polluted water
-
- G—PHYSICS
- G01—MEASURING; TESTING
- G01N—INVESTIGATING OR ANALYSING MATERIALS BY DETERMINING THEIR CHEMICAL OR PHYSICAL PROPERTIES
- G01N33/00—Investigating or analysing materials by specific methods not covered by groups G01N1/00 - G01N31/00
- G01N33/02—Food
- G01N33/04—Dairy products
-
- G—PHYSICS
- G01—MEASURING; TESTING
- G01N—INVESTIGATING OR ANALYSING MATERIALS BY DETERMINING THEIR CHEMICAL OR PHYSICAL PROPERTIES
- G01N21/00—Investigating or analysing materials by the use of optical means, i.e. using sub-millimetre waves, infrared, visible or ultraviolet light
- G01N21/17—Systems in which incident light is modified in accordance with the properties of the material investigated
- G01N21/25—Colour; Spectral properties, i.e. comparison of effect of material on the light at two or more different wavelengths or wavelength bands
- G01N21/31—Investigating relative effect of material at wavelengths characteristic of specific elements or molecules, e.g. atomic absorption spectrometry
- G01N21/35—Investigating relative effect of material at wavelengths characteristic of specific elements or molecules, e.g. atomic absorption spectrometry using infrared light
- G01N2021/3595—Investigating relative effect of material at wavelengths characteristic of specific elements or molecules, e.g. atomic absorption spectrometry using infrared light using FTIR
-
- Y—GENERAL TAGGING OF NEW TECHNOLOGICAL DEVELOPMENTS; GENERAL TAGGING OF CROSS-SECTIONAL TECHNOLOGIES SPANNING OVER SEVERAL SECTIONS OF THE IPC; TECHNICAL SUBJECTS COVERED BY FORMER USPC CROSS-REFERENCE ART COLLECTIONS [XRACs] AND DIGESTS
- Y10—TECHNICAL SUBJECTS COVERED BY FORMER USPC
- Y10S—TECHNICAL SUBJECTS COVERED BY FORMER USPC CROSS-REFERENCE ART COLLECTIONS [XRACs] AND DIGESTS
- Y10S250/00—Radiant energy
- Y10S250/91—Food sample analysis using invisible radiant energy source
Definitions
- the present invention relates to an infrared attenuation measuring system for the quantitative determination of the concentration of one or more components in an aqueous fat-containing sample by an infrared attenuation technique.
- infrared attenuation technique is intended to designate a measuring technique where light in the infrared range is transmitted to a sample, and the attenuation of the infrared light (which may be due to light scattering or energy absorption) caused by the sample is measured.
- Systems, or instruments, for the measurement comprise infrared attenuation measuring means for measuring the infrared attenuation of the sample in a number of wavebands and calculating means which are adapted to calculate the concentrations of the components of the fat-containing sample based on the measured infrared attenuation values of the sample.
- the calculation is performed using a set of waveband-related parameters which have normally been established by a factory calibration of the system or instrument.
- suitable calibration and processing of the calibration data made it possible to include, in the parameter set resulting from the calibration, information enabling the calculating means of the systems or instruments to either ensure that the calculated concentrations are substantially independent on the degree of homogenization of the fat-containing sample, and/or to determine the degree of homogenization of the sample, the latter determination being particularly useful in assessing the efficiency of the built-in homogenizer of the systems/instruments.
- the term "degree of homogenization” is intended to indicate the mean diameter, calculated by volume, of the fat globules. It is well known that with increasing homogenization efficiency (increasing degree of homogenization), the mean diameter of the fat globules will decrease, which, on the other hand, means that with decreasing homogenization efficiency (decreasing degree of homogenization), there will be an increase in the mean diameter of the fat globules size, which will cause increased light scattering and thus decrease the accuracy of the measurements of the known art instruments. In practice, the variation around the mean fat globule size will also tend to decrease with decreasing mean diameter (increasing degree of homogenization).
- the term "degree of homogenization” is used in a broad sense and is thus also used to characterize the fat globule size of unhomogenized natural samples (which of course have a low degree of homogenization); the measurement, on samples having a low degree of homogenization, corresponding to the samples being natural unhomogenized samples, with highly reliable results is a beautiful possibility opened up by the present invention.
- the determination of the degree of homogenization can suitably be made by defining a value ascribed to a calibration sample of known fat globule size distribution and calculating, in connection with the measurement on a particular sample, the corresponding value in relation to the sample of the known fat globule size distribution. This determination can be performed in the presence of varying concentrations of the components of the sample, see Example 2.
- the compensation resulting in virtual independence of the performance of the built-in homogenizer of the system is suitably obtained by using data from calibrations to establish parameter sets which, when used in connection with the measured attenuations, will result in predicted values in which deviations in the degree of homogenization are compensated for.
- the parameter set normally contains parameters which are related to wavebands containing a high degree of information about the homogenization degree of the sample. This may be wavebands containing little information about the chemical components of the sample, and/or wavebands containing a substantial amount of information about the chemical components of the sample. As explained in the following and illustrated in the examples, certain mathematical methods are extremely useful for establishing, based on suitable calibration data, a parameter set which will be especially suitable for the purpose of the invention.
- the present invention relates to an infrared attenuation measuring system for the quantitative determination of the concentration of one or more components in an aqueous fat-containing sample by an infrared attenuation technique, the system comprising infrared attenuation measuring means for measuring the infrared attenuation of the sample in a number of wavebands and calculating means which are adapted to calculate the concentrations of the components of the fat-containing sample from the measured infrared attenuation values of the sample using a set of waveband-related parameters, the parameter set being derived from a calibration with aqueous fat-containing samples having different degrees of homogenization, thereby enabling the calculating means to ensure that the calculated concentrations are substantially independent of the degree of homogenization of the sample, and/or to determine the degree of homogenization of the sample.
- system designates any system capable of performing the measurement and the calculation, irrespective of whether the system is integrated in one instrument or consists of several units such as a measuring unit and a separate calculating unit such as a microcomputer.
- the parameter set mentioned above contains parameters which are related to wavebands containing a high degree of information about the homogenization degree of the sample.
- waveband is intended to designate a wavenumber range in the infrared spectrum.
- the width of a waveband will be selected in dependency of the system used, the information in the spectrum, etc.
- One example of a waveband width is the 20 cm -1 used in the examples, but waveband widths useful for the purpose of the present invention may vary over a broad range, such as up to 100 cm -1 , depending, i.a., on the location in the spectrum, such as whether in the long wave or the short wave end of the spectrum.
- the calculating means may, e.g., be a microprocessor calculating the concentrations using, e.g. a linear combination of attenuation values and/or functions of attenuation values, the waveband-related parameters being coefficients in the linear combination.
- the parameters may be stored in the system in any suitable storage, such as a hard disc, a ROM, a RAM, a PROM, a CD, a chip, a tape, etc.
- the calculating means may be a neural network defined by the waveband-related parameters. In one embodiment, the results of the linear combination are further processed in the neural network.
- the waveband-related parameters are not values directly corresponding to physical or chemical properties, but are rather parameters determined empirically and/or statistically in the calibration of the system.
- the parameters are waveband-related, that is, the parameters are used by the calculating means when treating the measured attenuation values in the waveband in question, and are determined as a result of the calibration of the system on the basis of values from the waveband in question.
- the parameter set may contain parameters which are related to wavebands containing a high degree of information about the homogenization degree of the sample.
- the wavebands containing a high degree of information about the homogenization degree of the sample comprise wavebands containing little information about the chemical components of the sample, and/or wavebands containing a substantial amount of information about the chemical components of the sample. In connection with the discussion of Figs. 1 and 2 below, such types of wavebands containing a high degree of information about the degree of homogenization are discussed.
- the parameter set will contain information related to wavebands over a relatively broad range, including, e.g. a parameter related to wavebands above 3400 cm -1 , a parameter related to a waveband in the range between 3400 cm -1 and 4000 cm -1 , a parameter related to wavebands in the range of 2600-3400 cm -1 , a parameter related to wavebands in the range of 2700-3100 cm -1 , a parameter related to wavebands in the range of 2000-2600 cm -1 , a parameter related to wavebands in the range of 800-2000 cm -1 a parameter related to wavebands in the range of 900-1700 cm -1 , a parameter related to wavebands in the range of 1000-1600 cm -1 , and/or a parameter related to wavebands in the range of 1600-1800 cm -1 .
- a parameter related to wavebands above 3400 cm -1 e.g. a parameter related to a waveband in the range between 3400 cm -1 and 4000 cm
- the attenuation values may be determined in wavebands defined by optical filters, or they may be determined in wavebands defined by stationary grating and movable and/or multiple detectors, or by movable grating and one or several stationary or movable detectors.
- the attenuation values are determined over a broad spectrum range using an interferometer, and the data obtained from the interferometer are processed using Fourier transformation.
- An example of such as system is illustrated in Examples 1 and 2.
- the crucial parameters used according to the invention are normally established by calibration of the system with aqueous fat-containing samples with different homogenization degrees.
- the systematic calibration of the system with samples with different homogenization degrees is believed to be a completely novel concept utilizing the finding that in this manner, information latently present in the spectrum can be rendered available for the important establishment of measurements substantially free from influence from the homogenization degree, or for the monitoring of the quality of a homogenizer, such as a homogenizer built into a measuring system of the present type.
- an infrared attenuation measuring system may comprise a built-in homogenizer which is by-passable so as to permit calibration with pre-prepared aqueous fat-containing samples with different homogenization degrees, or the homogenizer, alternatively, may be adjustable to deliver different levels of homogenization useful for such calibration.
- the calibration according to the invention (see below) to establish the system according to the invention is performed at the factory only once in the lifetime of the system, with the possibility of validation upon replacement of vital parts of the system.
- a system according to the invention may be characterized as an infrared attenuation measuring system which, when measuring fat on an unhomogenized raw milk sample containing 2-4% of fat and a sample of the same raw milk homogenized to a mean fat globule diameter of volume of 1 ⁇ m, respectively, measures fat contents which show a relative deviation from each other of at the most 4%, preferably at the most 3%, and more preferably at the most 2%.
- the invention also relates to a method for the quantitative determination of the concentrations of one or more components in a aqueous fat-containing sample, comprising measuring the infrared attenuation of a sample in a number of wavebands and calculating the concentrations of the components of the fat-containing sample from the measured infrared attenuation values of the sample using a set of waveband-related parameters, characterized in that the parameter set is derived from a calibration with aqueous fat-containing samples having different degrees of homogenization, thereby enabling the calculating means to ensure that the calculated concentrations are substantially independent of the degree of homogenization of the sample, and/or to determine the degree of homogenization of the sample.
- the calibration may be performed by measuring, at different wavebands including, at least, for each component to be measured, a waveband at which the component in question influences the infrared attenuation, and a waveband at which the attenuation has a relatively high dependency on the degree of homogenization, and a relatively low dependency on the concentration of the individual components, attenuation on either
- the establishment of the calibration parameter set is advantageously performed using a partial least square algorithm, or it may be performed using a principal component regression algorithm, such as by a multiple linear regression.
- the number of samples used in the calibration normally corresponds to at least the number of wavebands, and the results of the measurements are normally arranged in a set of linear equations which are solved by matrix algebra to calculate the parameters. In most cases, a larger number of samples is used, depending on the number of components to be estimated and their respective interaction.
- the quality of the calibration will normally be checked using a test set which has been kept out of the calibration set to ensure the stability of the system with respect to random variables.
- the samples to be measured are often milk samples, and the components to be determined are often selected from the group consisting of fat, protein, lactose, other carbohydrates, citric acid, urea, free fatty acids, antibiotics, somatic cells, and casein.
- milk-like samples such as samples prepared from cheese, butter, and other milk products are prominent sample types which can be measured in the system according to the invention.
- Fig. 1 shows infrared transmission spectra of two milk samples A and B, sample A containing approximately 3% fat and the fat globules having a mean diameter of volume (d volume ) of 0.9 ⁇ m with 1% of the fat globules having a diameter larger than 2.5 ⁇ m, and Sample B being the unhomogenized equivalent of sample A and the fat globules having a mean diameter of volume of 4 ⁇ m with 1% of the fat having a globule diameter larger than 12 ⁇ m.
- Sample A was obtained by homogenizing sample B through a 2-stage ball valve homogenizer with a total pressure drop of 200 bar, the pressure drop of each stage being 100 bar.
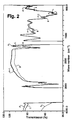
- Fig. 2 shows infrared transmission spectra of three aqueous fat-containing samples A, B and C.
- Samples A and B correspond to samples A and B, respectively, in Fig. 1, and sample C is sample B following homogenization through a 2-stage ball valve homogenizer with a total pressure drop of 100 bar, the pressure drop of each stage being 50 bar.
- the fat globules of sample C had a mean diameter of volume (d volume ) of 1.9 ⁇ m with 1% of the fat globules having a diameter larger than 4 ⁇ m.
- Fig. 3 shows a bar diagram as described in Example 2.
- the solid bars are the results of the entire data set obtained whereas the open bars are the results from test set models.
- the largest difference in the spectra of the two different sample is obtained by measuring the infrared transmission at a wavenumber in this region giving rise to the assumption that measurement above 3700 cm -1 followed by proper calculations could establish a parameter for use in determining the degree of homogenization.
- information collected at a wavenumber above 3700 cm -1 seems to be useful in order to establish a parameter for use in determination of the concentration of one or more components in the sample taken the degree of homogenization of the sample into account.
- Fig. 2 is shown infrared transmission spectra from three sample having different degrees of homogenization as described above. Like in Fig. 1, the influence of the degree of homogenization is most evident for measurements performed at wavenumbers above about 3700 cm -1 and the curve relating to sample C is found to be placed between the curves of the two other samples, thus, indicating that a relationship between measurements at such wavenumbers and the degree of homogenization is present.
- the sample material was prepared from a starting sample collection consisting of 40 raw milk samples, 10 of which were herd samples (i.e. mixtures of the milk from an entire cow herd) and the rest were obtained from individual cows, the purpose being to provide a sufficient variation in the contents of the major milk components (fat, protein, lactose).
- herd samples i.e. mixtures of the milk from an entire cow herd
- the rest were obtained from individual cows, the purpose being to provide a sufficient variation in the contents of the major milk components (fat, protein, lactose).
- the homogenized sample portions constituted the sample sets for calibration as follows: One sample set (A), for the calibration according to the invention, consisted of 40 portions homogenized at 100 bar and 40 portions homogenized at 200 bar. The other sample set (B), for a reference calibration, consisted of 40 portions homogenized at 200 bar.
- the unhomogenized sample had a mean diameter of volume (d volume ) of 4 ⁇ m with 1% of the fat having a globule diameter larger than 12 ⁇ m.
- the sample homogenized at 100 bar had a d volume of 1.9 ⁇ m with 1% of the fat globules having a diameter larger than 4 ⁇ m, whereas the sample homogenized at 200 bar had a d volume of 0.9 ⁇ m with 1% of the fat globules having a diameter larger than 2.5 ⁇ m.
- the spectra were collected in digitized form for later numerical analysis. 24 hours after the recordal of the first 80 spectra, another series of spectra of the 40 (A) samples homogenised at 200 bar were recorded. Thus, the total number of digitized spectra were 120.
- the set of regression equations for each component consisted of a set of terms comprising a regression coefficient (B-coefficient) and the corresponding absorbance value at each of the 12 spectral windows listed above and a constant term.
- B-coefficient regression coefficient
- Determination quality (predictability) of the system according to the invention The standard errors of prediction resulting from the above calibration were 1.4% of mean value for fat, 1.1% for protein, and 2.2% for lactose.
- Reference calibration The same procedure as explained above was repeated using the sample set (B) homogenized at 200 bar. The result was that the number of factors suggested by cross validation was 2 for the estimation of fat, 5 for the estimation of protein, and 6 for the estimation of lactose.
- Reference determination The standard errors of prediction resulting from the reference calibration were 1.5% of mean value for fat, 1.1% for protein, and 2.2% for lactose.
- the stability of the system according to the invention was demonstrated by subdividing all the samples ((A) and (B) together) into 4 groups at random and then in turn establishing a calibration model based on the data from three of the sample groups and using the fourth group as a test group calculating the standard error of prediction.
- the standard errors of prediction obtained did not differ significantly from those obtained in the first and second predictive models described above. This shows that the system according to the invention is stable.
- Example 2 The same absorbance value data obtained in Example 1 was analyzed with regard to the ability of the data from the individual spectral windows to predict whether the individual sample had been homogenized at 100 or at 200 bar. This was done by assigning to each sample an arbitrary homogenization index (0 for 200 bar and 1 for 100 bar) and subjecting the absorbance values and homogenization indexes to Partial Least Square Analysis.
- the model was able to assign all samples correctly.
- the resulting B-coefficients using 3 factors as suggested from cross validation are shown on Figure 3.
- the solid bars are the results of the entire set of data whereas the open bars are the results from test set models calculated in the same manner as in Example 1, i.e. by generating a model using three quarters of the data and testing the model on the remaining quarter of the data.
- the results on Figure 3 firstly show that the model was stable in that the open bars are of the same size and, secondly, that the major response to variations in homogenization efficiency is found in the spectral window at around 3800 cm -1 .
Landscapes
- Physics & Mathematics (AREA)
- Health & Medical Sciences (AREA)
- Life Sciences & Earth Sciences (AREA)
- Chemical & Material Sciences (AREA)
- Food Science & Technology (AREA)
- Engineering & Computer Science (AREA)
- Biochemistry (AREA)
- Analytical Chemistry (AREA)
- General Health & Medical Sciences (AREA)
- General Physics & Mathematics (AREA)
- Immunology (AREA)
- Pathology (AREA)
- Medicinal Chemistry (AREA)
- Spectroscopy & Molecular Physics (AREA)
- Investigating Or Analysing Materials By Optical Means (AREA)
- Photometry And Measurement Of Optical Pulse Characteristics (AREA)
- Optical Communication System (AREA)
- Spectrometry And Color Measurement (AREA)
Abstract
Description
Based on the discoveries of the present invention, it now becomes possible not only to determine the degree of homogenization of the samples on which the measurements are made, the determination being made as part of the normal measurement, but also to retain the accuracy which previously required a built-in homogenizer of top performance by using the information derivable from the spectrum, associated with suitable calibration principles, for automatically compensating for differences in degree of homogenization.
| Spectral | B-coefficient | |||
| Window | | Protein | Lactose | |
| 3800 cm-1 | 3.3046 | .1886 | -.5000 | |
| 2925 cm-1 | 10.9571 | 2.0270 | .6475 | |
| 1583 cm-1 | -2.1820 | 1.7892 | -14.5792 | |
| 1543 cm-1 | -1.7250 | 16.9867 | -4.9432 | |
| 1478 cm-1 | -1.2840 | -1.1404 | 6.2963 | |
| 1460 cm-1 | .6523 | 4.2474 | 7.2961 | |
| 1391 cm-1 | -.8554 | -12.2288 | 26.6697 | |
| 1283 cm-1 | -.3156 | -1.8824 | -.8149 | |
| 1213 cm-1 | .0854 | 2.7227 | 5.2450 | |
| 1165 cm-1 | 2.4827 | -.2974 | -20.3297 | |
| 1155 cm-1 | 2.0327 | 1.1259 | 9.6517 | |
| 1034 cm-1 | -2.4676 | 1.1120 | 7.5539 | |
| Constant | -.7444 | .5296 | .7499 |
Claims (30)
- An infrared attenuation measuring system for the quantitative determination of the concentration of one or more components in an aqueous fat-containing sample by an infrared attenuation technique, the system comprising infrared attenuation measuring means for measuring the infrared attenuation of the sample in a number of wavebands and calculating means which are adapted to calculate the concentrations of the components of the fat-containing sample from the measured infrared attenuation values of the sample using a set of waveband-related parameters, characterized in that the parameter set is derived from a calibration with aqueous fat-containing samples having different degrees of homogenization, thereby enabling the calculating means to ensure that the calculated concentrations are substantially independent on the degree of homogenization of the sample, and/or to determine the degree of homogenization of the sample.
- An infrared attenuation measuring system according to claim 1, wherein the parameter set contains a parameter related to wavebands above 3400 cm-1.
- An infrared attenuation measuring system according to claim 2, wherein the parameter related to wavebands above 3400 cm-1 is a parameter related to a waveband in the range between 3400 cm-1 and 4000 cm-1.
- An infrared attenuation measuring system according to claim 1, wherein the parameter set contains a parameter related to wavebands in the range of 2600-3400 cm-1.
- An infrared attenuation measuring system according to claim 4, wherein the parameter set contains a parameter related to wavebands in the range of 2700-3100 cm-1.
- An infrared attenuation measuring system according to claim 1, wherein the parameter set contains a parameter related to wavebands in the range of 2000-2600 cm-1.
- An infrared attenuation measuring system according to claim 1, wherein the parameter set contains a parameter related to wavebands in the range of 800-2000 cm-1.
- An infrared attenuation measuring system according to claim 7, wherein the parameter set contains a parameter related to wavebands in the range of 900-1700 cm-1.
- An infrared attenuation measuring system according to claim 7, wherein the parameter set contains a parameter related to wavebands in the range of 1000-1600 cm-1.
- An infrared attenuation measuring system according to claim 7, wherein the parameter set contains a parameter related to wavebands in the range of 1600-1800 cm-1.
- An infrared attenuation measuring system according to any of the preceding claims, wherein the calculating means is a microprocessor calculating the concentrations using a linear combination of attenuation values and/or functions of attenuation values, the parameters being coefficients in the linear combination.
- A system according to any of claims 1-10, wherein the calculating means is a neural network defined by the parameters.
- An infrared attenuation measuring system according to claim 11 or 12, wherein the results of the linear combination are further processed in the neural network.
- An infrared attenuation measuring system according to any of the preceding claims, wherein the attenuation values are determined in wavebands defined by optical filters.
- An infrared attenuation measuring system according to any of claims 1-13, wherein the attenuation values are determined in wavebands defined by stationary grating and movable and/or multiple detectors, or by movable grating and one or several stationary or movable detectors.
- An infrared attenuation measuring system according to any of claims 1-13, wherein the attenuation values are determined over a broad spectrum range using an interferometer and the data obtained from the interferometer are processed using Fourier transformation.
- An infrared attenuation measuring system according to any of the preceding claims and comprising a built-in homogenizer, wherein the built-in homogenizer is by-passable so as to permit calibration with pre-prepared aqueous fatcontaining samples with different homogenization degrees, or the homogenizer, alternatively, is adjustable to deliver different levels of homogenization.
- An infrared attenuation measuring system according to any of the preceding claims, wherein a comparison between the measured fat content of an unhomogenized raw milk sample containing 2-4% of fat with the measured fat content of a sample of the same raw milk homogenized to a mean fat globule diameter of volume of 1 µm, shows a relative deviation of at the most 4%.
- An infrared attenuation measuring system according to any of the preceding claims, wherein a comparison between the measured fat content of an unhomogenized raw milk sample containing 2-4% of fat and the measured fat content of a sample of the same raw milk homogenized to a mean fat globule diameter of volume of 1 µm, shows a relative deviation of at the most 3%.
- An infrared attenuation measuring system according to any of the preceding claims, wherein a comparison between the measured fat content of an unhomogenized raw milk sample containing 2-4% of fat and the measured fat content of a sample of the same raw milk homogenized to a mean fat globule diameter of volume of 1 µm, shows a relative deviation of at the most 2%.
- An infrared attenuation measuring method for the quantitative determination of the concentrations of one or more components in a aqueous fat-containing sample, comprising measuring the infrared attenuation of a sample in a number of wavebands and calculating the concentrations of the components of the fat-containing sample from the measured infrared attenuation values of the sample using a set of waveband-related parameters, characterized in that the parameter set is derived from a calibration with aqueous fat-containing samples having different degrees of homogenization, thereby enabling the calculating means to ensure that the calculated concentrations are substantially independent of the degree of homogenization of the sample, and/or to determine the degree of homogenization of the sample.
- A method according to claim 21, wherein the calibration has been performed by measuring, at different wavebands including, at least, for each component to be measured, a waveband at which the component in question influences the infrared attenuation, and a waveband at which the attenuation has a relatively high dependency on the degree of homogenization, and a relatively low dependency on the concentration of the individual components, attenuation on eitherand, on the basis of the resulting data sets, establishing a calibration parameter set.1) a set of samples each of which, for each component to be measured, contains a known concentration of the component, at least two of the samples containing fat of different degrees of homogenization, or2) at least two samples containing the same concentration of fat, but of different degrees of homogenization, the system having, in advance, been calibrated with respect to the chemical components to be measured,
- A method according to claim 21 or 22, wherein the samples are milk samples.
- A method of calibrating a system for the quantitative determination of the concentration of one or more components in an aqueous fat-containing sample by an infrared attenuation technique, the system comprising infrared attenuation measuring means for measuring the infrared attenuation of the sample in a number of wavebands and calculating means which are adapted to calculate the concentrations of the components of the fat-containing sample from the measured infrared attenuation values of the sample using a set of waveband-related parameters, using aqueous fat-containing samples, the method being characterized in that the samples have different degrees of homogenization so as to establish a calibration parameter set containing information enabling the calculating means to ensure that the calculated concentrations are substantially independent of the degree of homogenization of the fat-containing sample, and/or to determine the degree of homogenization of the sample.
- A method according to claim 24, wherein the calibration has been performed by measuring, at different wavebands including, at least, for each component to be measured, a waveband at which the component in question influences the infrared attenuation, and a waveband at which the attenuation has a relatively high dependency on the degree of homogenization, and a relatively low dependency on the concentration of the individual components, attenuation on eitherand, on the basis of the resulting data sets, establishing a calibration parameter set.1) a set of samples each of which, for each component to be measured, contains a known concentration of the component, at least two of the samples containing fat of different degrees of homogenization, or2) at least two samples containing the same concentration of fat, but of different degrees of homogenization, the system having, in advance, been calibrated with respect to the chemical components to be measured,
- A method according to claim 24 or 25, wherein the establishment of the calibration parameter set is performed using a partial least square algorithm.
- A method according to claim 24, or 25, wherein the establishment of the calibration parameter set is performed using a principal component regression algorithm.
- A method according to claim 26, wherein the establishment of the partial least square algorithm is a multiple linear regression.
- A method according to claim 24 or 25, wherein the number of samples corresponds to the number of wavebands, and the results of the measurements are arranged in a set of linear equations which are solved by matrix algebra to calculate the parameters.
- A method according to any of claims 24-29, characterized in that the samples to be measured are milk samples, and the components to be determined are selected from the group consisting of fat, protein, lactose, other carbohydrates, citric acid, urea, free fatty acids, antibiotics, somatic cells, and casein.
Applications Claiming Priority (4)
| Application Number | Priority Date | Filing Date | Title |
|---|---|---|---|
| DK165391 | 1991-09-27 | ||
| DK911653A DK165391D0 (en) | 1991-09-27 | 1991-09-27 | IR measurement system |
| DK1653/91 | 1991-09-27 | ||
| PCT/DK1992/000283 WO1993006460A1 (en) | 1991-09-27 | 1992-09-25 | An infrared attenuation measuring system |
Publications (2)
| Publication Number | Publication Date |
|---|---|
| EP0605662A1 EP0605662A1 (en) | 1994-07-13 |
| EP0605662B1 true EP0605662B1 (en) | 1998-06-10 |
Family
ID=8106926
Family Applications (1)
| Application Number | Title | Priority Date | Filing Date |
|---|---|---|---|
| EP93906314A Expired - Lifetime EP0605662B1 (en) | 1991-09-27 | 1992-09-25 | An infrared attenuation measuring system |
Country Status (7)
| Country | Link |
|---|---|
| US (1) | US5343044A (en) |
| EP (1) | EP0605662B1 (en) |
| JP (1) | JPH07503535A (en) |
| AT (1) | ATE167295T1 (en) |
| DE (1) | DE69225901D1 (en) |
| DK (1) | DK165391D0 (en) |
| WO (1) | WO1993006460A1 (en) |
Cited By (1)
| Publication number | Priority date | Publication date | Assignee | Title |
|---|---|---|---|---|
| CN104076010A (en) * | 2013-03-27 | 2014-10-01 | 北京中医药大学 | Method for detecting honey quality in refining process |
Families Citing this family (22)
| Publication number | Priority date | Publication date | Assignee | Title |
|---|---|---|---|---|
| JP3395299B2 (en) * | 1993-11-08 | 2003-04-07 | ソニー株式会社 | Semiconductor device wiring structure and wiring forming method |
| DK138593D0 (en) * | 1993-12-10 | 1993-12-10 | Foss Electric As | IMPROVED MEASUREMENT METHOD |
| CA2401553C (en) | 1995-10-09 | 2006-07-11 | Otsuka Pharmaceutical Co., Ltd. | Method for spectrometrically measuring isotopic gas and apparatus thereof |
| GB9624035D0 (en) * | 1996-11-19 | 1997-01-08 | Infrared Eng | Infrared measuring gauge |
| US6147502A (en) * | 1998-04-10 | 2000-11-14 | Bechtel Bwxt Idaho, Llc | Method and apparatus for measuring butterfat and protein content using microwave absorption techniques |
| AU1773900A (en) * | 1998-12-23 | 2000-07-31 | Foss Electric A/S | Method and apparatus for estimation of a cell count in a body fluid |
| AU776883B2 (en) * | 1999-02-19 | 2004-09-23 | Metron Instruments, Inc. | Measurement systems and methods for determining component particle concentrations in a liquid |
| BRPI0014974B1 (en) | 1999-10-21 | 2015-06-23 | Foss Analytical As | "Method and apparatus for determining the properties of a food or feed medium and method for calibrating apparatus" |
| DE60015287T2 (en) * | 2000-02-01 | 2006-02-02 | Apv Homogenisers As | Intelligent quality measurement and monitoring system |
| US6549861B1 (en) | 2000-08-10 | 2003-04-15 | Euro-Celtique, S.A. | Automated system and method for spectroscopic analysis |
| AU2001288292A1 (en) | 2000-08-21 | 2002-03-04 | Euroceltique S.A. | Near infrared blood glucose monitoring system |
| SE0100931D0 (en) | 2001-03-16 | 2001-03-16 | Miris Ab | Mid infra red analysis |
| US6600559B2 (en) | 2001-03-22 | 2003-07-29 | Eastman Kodak Company | On-line method for detecting particle size during a milling process |
| US7400400B2 (en) * | 2001-08-29 | 2008-07-15 | Merck & Co. Inc. | Method for monitoring particle size |
| AU2002358459B2 (en) | 2002-01-10 | 2006-10-05 | Foss Analytical A/S | Method and means for correcting measuring instruments |
| US20050033127A1 (en) * | 2003-01-30 | 2005-02-10 | Euro-Celtique, S.A. | Wireless blood glucose monitoring system |
| PT1682000E (en) | 2003-10-31 | 2009-03-19 | Otsuka Pharma Co Ltd | Gas injection amount determining method in isotope gas analysis, and isotope gas analyzing and measuring method and apparatus |
| KR100859119B1 (en) | 2006-05-04 | 2008-09-25 | 대한민국 | Somatic Cell Counting Method in Milk Using Near-infrared Spectroscopy |
| KR20070107947A (en) * | 2006-05-04 | 2007-11-08 | 대한민국(관리부서:농촌진흥청) | Analysis of Urea Nitrogen in Milk Using Near-infrared Spectroscopy System |
| WO2007141416A1 (en) | 2006-06-07 | 2007-12-13 | Valorex | Method for determining the nutritional quality of milk lipids |
| KR100935703B1 (en) * | 2008-01-14 | 2010-01-07 | 대한민국 | Field milk quality analysis device and method |
| CN101446551B (en) * | 2009-01-09 | 2010-12-22 | 内蒙古蒙牛乳业(集团)股份有限公司 | Testing method for trace elements in liquid milk and dry milk |
Family Cites Families (17)
| Publication number | Priority date | Publication date | Assignee | Title |
|---|---|---|---|---|
| US3161768A (en) * | 1961-01-27 | 1964-12-15 | Nat Res Dev | Method and apparatus for the analysis of emulsions and suspensions |
| US4207469A (en) * | 1975-08-02 | 1980-06-10 | Sir Howard Grubb Parsons and Company Ltd. | Analysis of emulsions and suspensions |
| GB1559792A (en) * | 1975-08-04 | 1980-01-30 | Northern Eng Ind | Analyssis of emulsion and suspensions |
| DK151393C (en) * | 1978-12-06 | 1988-05-16 | Foss Electric As N | PROCEDURE FOR QUANTITATIVE DETERMINATION OF FAT IN A WATER FAT EMULSION |
| US4310763A (en) * | 1979-10-15 | 1982-01-12 | John Shields | Electro-optical analyzer for measuring percentage by weight of fat, protein and lactose in milk |
| US4415809A (en) * | 1979-10-15 | 1983-11-15 | John Shields | Electro-optical analyzer for measuring percentage by weight of fat, protein and lactose in milk |
| JPS5714742A (en) * | 1980-06-30 | 1982-01-26 | Anritsu Corp | Method and apparatus for measuring solid content in cow's milk by infrared ray |
| US4447725A (en) * | 1981-06-15 | 1984-05-08 | Biggs Delmar A | Quantitative measurement of fat, protein and lactose in dairy products |
| EP0122749B1 (en) * | 1983-04-05 | 1988-04-20 | Shields Instruments Limited | Measurement of fat |
| US4746218A (en) * | 1984-06-12 | 1988-05-24 | Syconex Corporation | Gas detectors and gas analyzers utilizing spectral absorption |
| US4749276A (en) * | 1986-01-23 | 1988-06-07 | Mcdonnell Douglas Corporation | Long path absorption cell |
| US4730112A (en) * | 1986-03-07 | 1988-03-08 | Hibshman Corporation | Oxygen measurement using visible radiation |
| US4883963A (en) * | 1986-04-28 | 1989-11-28 | Bran+Luebbe Gmbh | Optical analysis method and apparatus having programmable rapid random wavelength access |
| DE3633931A1 (en) * | 1986-10-04 | 1988-04-07 | Kernforschungsz Karlsruhe | METHOD AND DEVICE FOR CONTINUOUSLY MEASURING THE CONCENTRATION OF A GAS COMPONENT |
| CH673534A5 (en) * | 1987-10-19 | 1990-03-15 | Tecan Ag | |
| US4934816A (en) * | 1988-05-18 | 1990-06-19 | Southwest Sciences, Incorporated | Laser absorption detection enhancing apparatus and method |
| US4937448A (en) * | 1988-05-26 | 1990-06-26 | Spectra-Physics, Inc. | Self-normalizing single-beam laser spectrometer |
-
1991
- 1991-09-27 DK DK911653A patent/DK165391D0/en not_active IP Right Cessation
-
1992
- 1992-09-25 EP EP93906314A patent/EP0605662B1/en not_active Expired - Lifetime
- 1992-09-25 DE DE69225901T patent/DE69225901D1/en not_active Expired - Lifetime
- 1992-09-25 AT AT93906314T patent/ATE167295T1/en not_active IP Right Cessation
- 1992-09-25 JP JP5505709A patent/JPH07503535A/en active Pending
- 1992-09-25 WO PCT/DK1992/000283 patent/WO1993006460A1/en not_active Ceased
-
1993
- 1993-06-11 US US08/075,016 patent/US5343044A/en not_active Expired - Lifetime
Cited By (1)
| Publication number | Priority date | Publication date | Assignee | Title |
|---|---|---|---|---|
| CN104076010A (en) * | 2013-03-27 | 2014-10-01 | 北京中医药大学 | Method for detecting honey quality in refining process |
Also Published As
| Publication number | Publication date |
|---|---|
| DE69225901D1 (en) | 1998-07-16 |
| ATE167295T1 (en) | 1998-06-15 |
| DK165391D0 (en) | 1991-09-27 |
| EP0605662A1 (en) | 1994-07-13 |
| US5343044A (en) | 1994-08-30 |
| JPH07503535A (en) | 1995-04-13 |
| WO1993006460A1 (en) | 1993-04-01 |
Similar Documents
| Publication | Publication Date | Title |
|---|---|---|
| US5343044A (en) | Infrared attenuation measuring system | |
| EP0629290B1 (en) | A method for determining urea in milk | |
| Díaz-Carrillo et al. | Near infrared calibrations for goat's milk components: protein, total casein, αs-, β-and k-caseins, fat and lactose | |
| McGlone et al. | Comparing density and NIR methods for measurement of kiwifruit dry matter and soluble solids content | |
| Tsenkova et al. | Near infrared spectroscopy for biomonitoring: cow milk composition measurement in a spectral region from 1,100 to 2,400 nanometers | |
| Tkachuk | Oil and protein analysis of whole rapeseed kernels by near infrared reflectance spectroscopy | |
| Karoui et al. | Chemical characterisation of European Emmental cheeses by near infrared spectroscopy using chemometric tools | |
| Marten et al. | Quality Prediction of Small Grain Forages by Near Infrared Reflectance Spectroscopy 1 | |
| Chen et al. | Development of calibration with sample cell compensation for determining the fat content of unhomogenised raw milk by a simple near infrared transmittance method | |
| Woo et al. | Development of a new measurement unit (MilkSpec-1) for rapid determination of fat, lactose, and protein in raw milk using near-infrared transmittance spectroscopy | |
| IWEKA et al. | Online milk quality assessment during milking using near-infrared spectroscopic sensing system | |
| Castro-Reigía et al. | Yoghurt standardization using real-time NIR prediction of milk fat and protein content | |
| Sørensen et al. | Accuracy of Fourier transform infrared spectrometry in determination of casein in dairy cows' milk | |
| Yildiz et al. | Monitoring PV in corn and soybean oils by NIR spectroscopy | |
| García-Olmo et al. | The transfer of fatty acid calibration equations using four sets of unsealed liquid standardisation samples | |
| Westerhaus et al. | Interpretation of regression statistics | |
| McKenna | Measuring moisture in cheese by near infrared absorption spectroscopy | |
| Westerhaus | Equation development | |
| EP0734523B1 (en) | Determination of extraneous water in milk samples, or the freezing point depression of milk samples | |
| WO1996030742A1 (en) | Method for oximeter standardization and for reporting results | |
| Park et al. | The development of near infrared reflectance spectroscopy calibrations for undried grass silage and their transfer to another instrument using multiple and single sample standardisation | |
| Adams et al. | Calibration models for determining moisture and fat content of processed cheese using near‐infrared spectrometry | |
| Goula et al. | Estimating the composition of tomato juice products by near infrared spectroscopy | |
| Wehling et al. | Determination of moisture, fat and protein in spray‐dried whole egg by near infrared reflectance spectroscopy | |
| KR100859131B1 (en) | NIR Spectroscopy System for Determination of Freshness of Milk |
Legal Events
| Date | Code | Title | Description |
|---|---|---|---|
| PUAI | Public reference made under article 153(3) epc to a published international application that has entered the european phase |
Free format text: ORIGINAL CODE: 0009012 |
|
| 17P | Request for examination filed |
Effective date: 19940325 |
|
| AK | Designated contracting states |
Kind code of ref document: A1 Designated state(s): AT BE CH DE DK ES FR GB GR IE IT LI LU MC NL SE |
|
| RAP1 | Party data changed (applicant data changed or rights of an application transferred) |
Owner name: FOSS ELECTRIC A/S |
|
| 17Q | First examination report despatched |
Effective date: 19951228 |
|
| GRAG | Despatch of communication of intention to grant |
Free format text: ORIGINAL CODE: EPIDOS AGRA |
|
| GRAG | Despatch of communication of intention to grant |
Free format text: ORIGINAL CODE: EPIDOS AGRA |
|
| GRAG | Despatch of communication of intention to grant |
Free format text: ORIGINAL CODE: EPIDOS AGRA |
|
| GRAH | Despatch of communication of intention to grant a patent |
Free format text: ORIGINAL CODE: EPIDOS IGRA |
|
| GRAH | Despatch of communication of intention to grant a patent |
Free format text: ORIGINAL CODE: EPIDOS IGRA |
|
| GRAA | (expected) grant |
Free format text: ORIGINAL CODE: 0009210 |
|
| AK | Designated contracting states |
Kind code of ref document: B1 Designated state(s): AT BE CH DE DK ES FR GB GR IE IT LI LU MC NL SE |
|
| PG25 | Lapsed in a contracting state [announced via postgrant information from national office to epo] |
Ref country code: NL Free format text: LAPSE BECAUSE OF FAILURE TO SUBMIT A TRANSLATION OF THE DESCRIPTION OR TO PAY THE FEE WITHIN THE PRESCRIBED TIME-LIMIT Effective date: 19980610 Ref country code: LI Free format text: LAPSE BECAUSE OF FAILURE TO SUBMIT A TRANSLATION OF THE DESCRIPTION OR TO PAY THE FEE WITHIN THE PRESCRIBED TIME-LIMIT Effective date: 19980610 Ref country code: IT Free format text: LAPSE BECAUSE OF FAILURE TO SUBMIT A TRANSLATION OF THE DESCRIPTION OR TO PAY THE FEE WITHIN THE PRESCRIBED TIME-LIMIT;WARNING: LAPSES OF ITALIAN PATENTS WITH EFFECTIVE DATE BEFORE 2007 MAY HAVE OCCURRED AT ANY TIME BEFORE 2007. THE CORRECT EFFECTIVE DATE MAY BE DIFFERENT FROM THE ONE RECORDED. Effective date: 19980610 Ref country code: GR Free format text: LAPSE BECAUSE OF FAILURE TO SUBMIT A TRANSLATION OF THE DESCRIPTION OR TO PAY THE FEE WITHIN THE PRESCRIBED TIME-LIMIT Effective date: 19980610 Ref country code: FR Free format text: LAPSE BECAUSE OF FAILURE TO SUBMIT A TRANSLATION OF THE DESCRIPTION OR TO PAY THE FEE WITHIN THE PRESCRIBED TIME-LIMIT Effective date: 19980610 Ref country code: ES Free format text: THE PATENT HAS BEEN ANNULLED BY A DECISION OF A NATIONAL AUTHORITY Effective date: 19980610 Ref country code: CH Free format text: LAPSE BECAUSE OF FAILURE TO SUBMIT A TRANSLATION OF THE DESCRIPTION OR TO PAY THE FEE WITHIN THE PRESCRIBED TIME-LIMIT Effective date: 19980610 Ref country code: BE Free format text: LAPSE BECAUSE OF FAILURE TO SUBMIT A TRANSLATION OF THE DESCRIPTION OR TO PAY THE FEE WITHIN THE PRESCRIBED TIME-LIMIT Effective date: 19980610 Ref country code: AT Free format text: LAPSE BECAUSE OF FAILURE TO SUBMIT A TRANSLATION OF THE DESCRIPTION OR TO PAY THE FEE WITHIN THE PRESCRIBED TIME-LIMIT Effective date: 19980610 |
|
| REF | Corresponds to: |
Ref document number: 167295 Country of ref document: AT Date of ref document: 19980615 Kind code of ref document: T |
|
| REG | Reference to a national code |
Ref country code: CH Ref legal event code: EP |
|
| REF | Corresponds to: |
Ref document number: 69225901 Country of ref document: DE Date of ref document: 19980716 |
|
| PG25 | Lapsed in a contracting state [announced via postgrant information from national office to epo] |
Ref country code: SE Free format text: LAPSE BECAUSE OF FAILURE TO SUBMIT A TRANSLATION OF THE DESCRIPTION OR TO PAY THE FEE WITHIN THE PRESCRIBED TIME-LIMIT Effective date: 19980910 Ref country code: DK Free format text: LAPSE BECAUSE OF FAILURE TO SUBMIT A TRANSLATION OF THE DESCRIPTION OR TO PAY THE FEE WITHIN THE PRESCRIBED TIME-LIMIT Effective date: 19980910 |
|
| PG25 | Lapsed in a contracting state [announced via postgrant information from national office to epo] |
Ref country code: DE Free format text: LAPSE BECAUSE OF FAILURE TO SUBMIT A TRANSLATION OF THE DESCRIPTION OR TO PAY THE FEE WITHIN THE PRESCRIBED TIME-LIMIT Effective date: 19980911 |
|
| REG | Reference to a national code |
Ref country code: IE Ref legal event code: FG4D |
|
| PG25 | Lapsed in a contracting state [announced via postgrant information from national office to epo] |
Ref country code: LU Free format text: LAPSE BECAUSE OF NON-PAYMENT OF DUE FEES Effective date: 19980925 Ref country code: IE Free format text: LAPSE BECAUSE OF NON-PAYMENT OF DUE FEES Effective date: 19980925 Ref country code: GB Free format text: LAPSE BECAUSE OF NON-PAYMENT OF DUE FEES Effective date: 19980925 |
|
| NLV1 | Nl: lapsed or annulled due to failure to fulfill the requirements of art. 29p and 29m of the patents act | ||
| EN | Fr: translation not filed | ||
| REG | Reference to a national code |
Ref country code: CH Ref legal event code: PL |
|
| PG25 | Lapsed in a contracting state [announced via postgrant information from national office to epo] |
Ref country code: MC Free format text: LAPSE BECAUSE OF NON-PAYMENT OF DUE FEES Effective date: 19990331 |
|
| PLBE | No opposition filed within time limit |
Free format text: ORIGINAL CODE: 0009261 |
|
| STAA | Information on the status of an ep patent application or granted ep patent |
Free format text: STATUS: NO OPPOSITION FILED WITHIN TIME LIMIT |
|
| GBPC | Gb: european patent ceased through non-payment of renewal fee |
Effective date: 19980925 |
|
| REG | Reference to a national code |
Ref country code: IE Ref legal event code: MM4A |
|
| 26N | No opposition filed |