EP0423753B2 - Method and apparatus for displaying defects in tubular members - Google Patents
Method and apparatus for displaying defects in tubular members Download PDFInfo
- Publication number
- EP0423753B2 EP0423753B2 EP90119902A EP90119902A EP0423753B2 EP 0423753 B2 EP0423753 B2 EP 0423753B2 EP 90119902 A EP90119902 A EP 90119902A EP 90119902 A EP90119902 A EP 90119902A EP 0423753 B2 EP0423753 B2 EP 0423753B2
- Authority
- EP
- European Patent Office
- Prior art keywords
- defect
- defects
- signal
- tubular member
- displaying
- Prior art date
- Legal status (The legal status is an assumption and is not a legal conclusion. Google has not performed a legal analysis and makes no representation as to the accuracy of the status listed.)
- Expired - Lifetime
Links
- 230000007547 defect Effects 0.000 title claims description 271
- 238000000034 method Methods 0.000 title claims description 54
- 238000007689 inspection Methods 0.000 claims description 73
- 230000005291 magnetic effect Effects 0.000 claims description 16
- 230000004907 flux Effects 0.000 claims description 13
- 230000000007 visual effect Effects 0.000 claims description 12
- 239000007787 solid Substances 0.000 claims description 9
- 238000001514 detection method Methods 0.000 claims description 6
- 230000008569 process Effects 0.000 claims description 6
- 238000013507 mapping Methods 0.000 claims description 4
- 230000001939 inductive effect Effects 0.000 claims description 2
- 238000012544 monitoring process Methods 0.000 claims 2
- 230000000875 corresponding effect Effects 0.000 description 19
- 230000006870 function Effects 0.000 description 19
- 238000004422 calculation algorithm Methods 0.000 description 7
- 238000004590 computer program Methods 0.000 description 7
- 239000000523 sample Substances 0.000 description 6
- 238000004519 manufacturing process Methods 0.000 description 4
- 230000000881 depressing effect Effects 0.000 description 3
- 238000006073 displacement reaction Methods 0.000 description 3
- 229910000831 Steel Inorganic materials 0.000 description 2
- 238000004364 calculation method Methods 0.000 description 2
- 230000008859 change Effects 0.000 description 2
- 239000002131 composite material Substances 0.000 description 2
- 238000010586 diagram Methods 0.000 description 2
- 230000000694 effects Effects 0.000 description 2
- 239000000463 material Substances 0.000 description 2
- 230000005855 radiation Effects 0.000 description 2
- 239000010959 steel Substances 0.000 description 2
- 238000004458 analytical method Methods 0.000 description 1
- 230000004323 axial length Effects 0.000 description 1
- 238000005266 casting Methods 0.000 description 1
- 238000006243 chemical reaction Methods 0.000 description 1
- 230000002596 correlated effect Effects 0.000 description 1
- 230000001186 cumulative effect Effects 0.000 description 1
- 230000007812 deficiency Effects 0.000 description 1
- 230000002950 deficient Effects 0.000 description 1
- 238000005553 drilling Methods 0.000 description 1
- 230000005294 ferromagnetic effect Effects 0.000 description 1
- 238000001914 filtration Methods 0.000 description 1
- 239000000446 fuel Substances 0.000 description 1
- 230000006698 induction Effects 0.000 description 1
- 238000009434 installation Methods 0.000 description 1
- 238000009659 non-destructive testing Methods 0.000 description 1
- 230000001172 regenerating effect Effects 0.000 description 1
- 230000004044 response Effects 0.000 description 1
- 238000005070 sampling Methods 0.000 description 1
- 238000009738 saturating Methods 0.000 description 1
- 238000003860 storage Methods 0.000 description 1
- 238000011179 visual inspection Methods 0.000 description 1
Images








Classifications
-
- G—PHYSICS
- G01—MEASURING; TESTING
- G01N—INVESTIGATING OR ANALYSING MATERIALS BY DETERMINING THEIR CHEMICAL OR PHYSICAL PROPERTIES
- G01N27/00—Investigating or analysing materials by the use of electric, electrochemical, or magnetic means
- G01N27/72—Investigating or analysing materials by the use of electric, electrochemical, or magnetic means by investigating magnetic variables
- G01N27/82—Investigating or analysing materials by the use of electric, electrochemical, or magnetic means by investigating magnetic variables for investigating the presence of flaws
- G01N27/90—Investigating or analysing materials by the use of electric, electrochemical, or magnetic means by investigating magnetic variables for investigating the presence of flaws using eddy currents
- G01N27/9073—Recording measured data
- G01N27/908—Recording measured data synchronously with scanning
-
- G—PHYSICS
- G01—MEASURING; TESTING
- G01N—INVESTIGATING OR ANALYSING MATERIALS BY DETERMINING THEIR CHEMICAL OR PHYSICAL PROPERTIES
- G01N27/00—Investigating or analysing materials by the use of electric, electrochemical, or magnetic means
- G01N27/72—Investigating or analysing materials by the use of electric, electrochemical, or magnetic means by investigating magnetic variables
- G01N27/82—Investigating or analysing materials by the use of electric, electrochemical, or magnetic means by investigating magnetic variables for investigating the presence of flaws
- G01N27/90—Investigating or analysing materials by the use of electric, electrochemical, or magnetic means by investigating magnetic variables for investigating the presence of flaws using eddy currents
- G01N27/9013—Arrangements for scanning
- G01N27/902—Arrangements for scanning by moving the sensors
Definitions
- This invention relates to defect inspection of tubular elements, and more particularly to displaying the results of such defect inspection in a readily usable format.
- Continuous tubular strings formed of connectable tubular sections or elements are used in the drilling, completion and production of subterranean oil and gas wells.
- the individual tubular elements which are typically steel castings, frequently containing manufacturing defects such as seams, laps, inclusions, and gouges which could result in costly failures if undetected prior to installation. Therefore, tubular elements are commonly inspected at the point of manufacture so that any serious defect can be located and repaired, if possible, before the defective tubing is shipped to the well site.
- Tubular elements are also subject to various forms of mechanical damage after being installed within a well. It is therefore advantageous that the individual tubular elements comprising a tubular string be inspected periodically. Typically, the inspection of tubular sections occurs after the individual sections comprising the tubing string have been removed from the well and disengaged. Defect inspections are conventionally performed on a section by section basis.
- Various techniques relating to electromagnetic inspection are well known in the art with a list of examples being set forth in the following U.S. patents:
- any of the above mentioned inspection techniques may be utilized to adequately detect the presence of defects located within the wall of tubular elements.
- the most essential function of existing inspection devices is to generate an electrical signal containing information regarding physical characteristics such as defects and other irregularities in a given segment of a tubular member, and to display such information in a useful manner.
- the display consists of a strip chart generated on a strip recorder, indicating the aforementioned electrical signal in analog form with a graphic indication for each irregularity sensed by the detecting device.
- An inspection crew then utilizes the graph as a guide to visually confirm the existence of serious defects which would result in the rejection of the tubular element being inspected.
- Conventional graphic displays are severely limited in their ability to convey useful information to the inspection crew responsible for visually locating defects.
- a conventional strip chart display provides a very general indication of the existence of a defect and its longitudinal position along the length of a tubular member.
- the existence of a defect is indicated by one or more vertical peaks in the graph, while the longitudinal position roughly corresponds to the location of the peak (or peaks) along the horizontal axis.
- conventional systems do not distinguish between several closely adjacent defects, a single large defect, or several defects at the same longitudinal position but spaced apart circumferentially.
- conventional systems provide virtually no useful information to the inspection crew regarding the circumferential location of any defects.
- conventional displays provide no usable information regarding the shape, size or amplitude of a defect, and only minimal information regarding the location.
- GB-A-2192993 discloses a eddy current surface mapping system in which an eddy current probe is scanned in two dimensions over an object to be mapped. First and second movement signals representing first and second scan directions of the probe are generated. The first and second movement signals are combined in a signal mixer with the the mutually perpendicular drive signals to produce first and second composite signals which vary as a function of the moment of the probe and eddy current signal. The composite signals are applied to a display mean for generating a three dimensional or pseudo-three dimensional image representative of irregularities in the part.
- US-A-4,492,115 discloses a method and apparatus for measuring defects in ferromagnetic tubing wherein a tubing trip tool measures tubing average wall thickness, local defects and axial defects. A saturating magnetic field and a fluctuating magnetic field are applied to the tubing and the magnitude of the induced fields and the changes are measured to quantify defects in the tubing.
- US-A-3,694,740 relates to a system for the magnetic non-destructive testing of materials for long and short defects.
- the system comprises a coil system for detecting short effects as seen in the longitudinal direction of the product and inducing a magnetic field in the product to be tested and a sensing means rotating arround the product and cooperating with said magnetic field for detecting long defects.
- EP-A-0 315 887 discloses an eddy current flaw detecting apparatus and method comprising a pair of detection coils connected in adjoining arms of flaw detecting bridge circuit.
- the planes containing the coils are arranged parallel to each other and inclined at an angle between 75° and 85° to the axis of a fuel clad pipe to be examined.
- EP-A-0 276 550 is also based on an eddy current flaw and discloses a method and apparatus for performing eddy current flaw inspection on workpiece material such as steel bar stock.
- EP-A-0 301 906 discloses an other apparatus and method for providing a combined ultrasonic and eddy current inspection of a tube wherein the method includes correlations of the data generated by the ultrasonic probes with the data generated by the eddy current probe for determining th size, shape and nature of any flaw in the tube walls.
- the present invention as defined in claims 1 and 28 addresses the deficiencies in prior art inspection systems, including those set forth above.
- the method and apparatus disclosed herein are used to determine the extent of defects occurring in a tubular member, such as a section of tubing used in an oil or gas well, and visually display such defects in a greatly improved manner.
- a tubing inspection head detects the physical characteristics of a tubular member and generates an electrical signal corresponding thereto. Included in the physical characteristics are defects, and the corresponding electrical signals indicate the presence, angular orientation, and overall configuration of such defects.
- longitudinal and circumferential position detectors generate signals indicating the longitudinal and circumferential position of the inspection head as it moves from one end of the tubular member to the other.
- a computer receives the signals generated by the inspection head and the longitudinal and circumferential position detectors, correlates the signals to obtain an accurate set of defect data including the size, configuration, orientation, longitudinal position, and circumferential position of every defect within the tubular member. Some or all of the defect data may then be displayed in a two-dimensional format on one or more visual display means.
- the computer program utilized to process the signals and display the defect data provides a great deal of flexibility for the present invention.
- the degree to which the incoming signals are filtered may be selected as desired thus providing for a greater or lesser degree of accuracy as warranted by the situation.
- the computer program also provides the capability of selectively tailoring the visual display such that various kinds of defects may be emphasized or de-emphasized as desired.
- Figures 1 and 2 provide schematic depictions of the preferred system for carrying out principles of the present invention, with Figure 2 emphasizing certain features of the preferred apparatus.
- system 10 which generally consists of inspection head 12, circumferential position detector 14, longitudinal position detector 16, a central processing unit or computer 18, and a variety of visual display devices collectively identified by the numeral 20. While it is preferred that system 10 include a CRT 20a, chart recorder 20b, plotter 20C, and printer 20d, it is only necessary for system 10 to include some form of visual display compatible for use with computer 18. It will be understood by those skilled in the art that any number of conventional visual display devices may be suitable for the purposes of the present invention.
- system 10 may be effectively employed to accurately determine the extent of defects in a tubular member 22, an visually display the defects in great detail on display device 20.
- Tubular member 22 typically consists of a single section or joint of pipe associated with oil and gas wells.
- System 10 may also be incorporated into an on-site inspection facility, wherein an entire tubing string may be conveniently inspected during removal from the well bore. Regardless of whether system 10 is intended for on-site or off-site inspection, the most significant physical requirement is that tubular member 22 and inspection head 12 be movable relative to one another along the longitudinal axis of tubular member 22 to insure complete inspection of tubular member 22 from one end to the other.
- system 10 would include inspection head 12 mounted in a laterally fixed position with tubular member 22 longitudinally movable therethrough by means of a conveyor.
- system 10 would have inspection head 12 vertically fixed above the well bore, and tubular member 22 would be drawn upwardly therethrough during removal from the bore.
- inspection head 12 comprises the means for generating a defect signal 24, which includes a variety of information about the physical characteristics of tubular member 22. Included in this information are the identification and configuration of any and all defects located within the body of tubular member 22. At any given instant during the operation, inspection head 12 is generating a defect signal 24 representing the characteristics of a single discrete solid segment of tubular member 22. By suitably moving inspection head 12 from one end of tubular member 22 to the other, the content of defect signal 24 is broadened to include information regarding the entire solid volume of tubular member 22, the entire solid volume consisting of the aggregate sum of all discrete solid segments.
- circumferential position detector 14 and longitudinal position detector 16 generate circumferential signal 26 and longitudinal signal 28, respectively, which contain information indicating the location of the defects detected by inspection head 12.
- Signals 24, 26, and 28 are then directed into computer 18, which utilizes conventional microprocessor circuitry to correlate the signals, thus obtaining a useful set of data concerning the presence, configuration, angular orientation, and precise location of the defects within tubular member 22.
- This data referred to herein as "defect data” is then displayed either in its entirety or in selected portions on one or more of the visual display devices 20.
- Illustrative examples of the visual display provided by the principles of the present invention are set forth in Figures 4a-4d and Figure 5.
- signals 24, 26, and 28 will be generated as analog signals of varying voltages, and must be converted to corresponding digital signals prior to processing by computer 18. It will also be understood that certain filtering networks may be employed in order to effect such conversions. High pass or low pass filters, however, are not necessary to segregate detect data from non-defect data within defect signal 24 due to the unique signal processing features of the present invention, discussed in greater detail below. Of course, defect signal 24 may be segregated by conventional band pass filters without departing from the scope of the present invention. As used herein, defect data relates to those irregularities which would result in the rejection of tubular member 22, while non-defect data relates to less severe irregularities, which would not result in such a rejection.
- defect signal 24 generally contains an enormous volume of information, only a portion of which relates to actual defects, it is necessary to selectively reduce the volume of information so the memory capacity of computer 18 is not exceeded.
- the present invention includes certain programming steps to enable computer 18 to distinguish defect information from non-defect information. After defect signal 24 has been digitized, the numerical values contained therein are compared by computer 18 to a threshold number selected by the user. The threshold is typically one and one-half times the average numerical value of digitized defect signal 24, but is may be varied as desired depending on the defect tolerances of the user. Computer 18 operates to discard all data having a numerical value less than the threshold, and record the remainder for further processing.
- inspection head 12 is preferably intended to be an electromagnetic detection device, such as that disclosed in U.S. Patent No. 4,710,712, but the teachings of this invention are equally applicable for use with a radiation inspection apparatus, an ultrasonic inspection apparatus, or any other inspection apparatus capable of generating a suitable defect signal 24.
- electromagnetic detection device such as that disclosed in U.S. Patent No. 4,710,712
- teachings of this invention are equally applicable for use with a radiation inspection apparatus, an ultrasonic inspection apparatus, or any other inspection apparatus capable of generating a suitable defect signal 24.
- the interchangeability of various types of inspection heads will be fully appreciated by those skilled in the art.
- defect signal 24 preferably consists of the multiplexed signals from forty-eight separate flux detectors, each of which is generating a signal, at any given instant, indicative of the defects in a separate discrete solid segment of tubular member 22. It is conceivable, however, that any number offlux detectors could be employed for the purposes disclosed herein. It is understood in the art that a large number of relatively small flux detectors effectively divides tubular member 22 into a greater number of discrete solid segments, thus improving the resolution of the visual display appearing on display device 20.
- circumferential position detector 14 is magnetic sensor which detects each rotation of inspection head 12, by means of magnet 30 which is secured thereto as illustrated in Figure 2.
- position detector 14 serves as the sensing means for revolution counter 32, which simply provides computer 18 with a signal 26a indicating the passing of each revolution.
- clock 34 and angle counter 36 provide timing signal 26b which is conventionally combined with signal 26a by computer 18 to calculate the rotational position of inspection head 12 at any given instant.
- Computer 18 then correlates this information with the defect data transmitted by defect signal 24 and the longitudinal position transmitted by longitudinal signal 28 and displays the results on display devices 20 as set forth herein.
- revolution counter signal 26a and angle counter signal 26b are cumulatively referred to as circumferential signal 26.
- circumferential position detector 14 may consist of any suitable apparatus for determining the circumferential position of the defect detector and generating a corresponding circumferential signal 26. It is expected that with certain "fixed-head" defect detectors, the circumferential position of defects will be indicated by the defect detector itself, and a separate circumferential position detector 14 may be eliminated altogether.
- Longitudinal position detector 16 preferably consists of a wheel rotatably secured to a rigid support member such that its outer edge surface bears against the outer surface of tubular member 22. As the wheel of position detector 16 rolls longitudinally along the entire length of tubular member 22, a transducer connected to the wheel generates longitudinal signal 28 which generally corresponds to the distance traveled by the wheel, thus providing computer 18 with sufficient information to determine the longitudinal position of inspection head 12 and any defects detected thereby. To best illustrate the features and advantages of the present invention, it is helpful to start with a typical visual display as provided by the prior art.
- Figure 3 is a reproduction of such a display, as trip chart produced on a chart recorder by an electromagnetic inspection system utilizing two detector head segments in a rotating detector apparatus, each head segment generating a separate line on the graphic display.
- Horizontal axes 38 and 40 each contain a graphic indication of the signal generated by each of the two head segments, with the distance between points A and B corresponding generally to the length of the tubular member inspected.
- Vertical elements 42 indicate irregularities located within the body ofthe tubular member, with the longer elements such as peaks 42a, indicating the most likely presence of a defect.
- the location of peaks 42a along the horizontal axes 38 and 40 indicate the general longitudinal location of the defects, but the size, configuration, and angular orientation of the defects must be determined by visual inspection.
- Figures 4a-d represent examples of the highly informative graphic displays made possible by the teachings of the present invention.
- the examples shown may either be observed on a CRT screen, or reproduced on a printer, plotter, or chart recorder.
- map 44 includes a horizontal axis 46 corresponding generally to the longitudinal length of tubular member 22, and vertical axis 48 corresponding to the circumference of tubular member 22, with the graduation marks along vertical axis 48 signifying degrees of rotation from a preselected 12 o'clock position.
- Defect identifiers 50a-f indicate the presence, configuration, longitudinal position, and circumferential position of each defect located throughout tubular member 22. When viewed on a CRT screen, defect identifiers 50a-f constitute groups of one or more pixels.
- defect identifiers 50a, b and c indicate the presence of short defects
- 50d indicates the presence of a long defect
- 50e and f indicate the presence of defects having angular orientations, or angle defects.
- the designations "short,” “long,” and “angle” are relative terms as used herein, and do not correspond to any particular absolute dimensions of size. The significance of these terms will become apparent in light of the additional features of the preferred embodiment as discussed below.
- graph 52 Positioned immediately beneath map 44 is graph 52, indicating a graphical representation of the signals received from the two head segments 13 of inspection head 12. Rather than indicating the analog signal as with prior art devices, graph 52 depicts the digitized version of defect signal 24 after processing by computer 18. As such, graph 52 is a much more accurate representation of the actual state of defects within tubular member 22.
- the far right-hand side of the display contains certain information regarding the parameters of the procedure and the physical characteristics of the tubing being inspected.
- this section indicates the threshold value for the display, the rotational velocity (in RPM's) of the inspection head 12, the percentage of coverage provided by the inspection head 12, and the outside diameter, wall thickness, and grade of tubular member 22.
- RPM's rotational velocity
- this section of the display may be altered as desired without departing from the principles of this invention.
- graph 52 includes threshold line 54 which may be set or altered according to the particular needs of the customer.
- the threshold value represented by line 54 serves as a computer generated high pass filter which only allows those values greater than the threshold to appear as defect identifiers on map 44.
- the threshold value setting is indicated with the information shown to the right of map 44 and graph 52.
- Figure 4a represents a display in the inspection mode
- Figure 4b represents the same display in the set up short mode
- Figure 4c represents the same display in the set up angle mode
- Figure 4d represents the same display in the set up long mode.
- Figure 4a is the cumulative version of Figures 4b, c, and d, in which short defects, long defects, and angle defects are given substantially equal prominence.
- the selection of the set up short mode by the user results in additional processing being performed by computer 18 so that short defects are emphasized, with long and angle defects being omitted or shown in distorted fashion.
- the table of Figure 5 includes four columns of information reflecting the physical characteristics of the defects in tubular member 22.
- the characteristic shown for each defect are the longitudinal position, the circumferential position, longitudinal or axial length, and the angular orientation.
- the presentation of defect data in this manner provides a convenient tool for assisting the inspection crew in visually locating each defect.
- the preferred table also includes a fifth column headed "joint number" for identifying the section or joint of tubing being inspected, and a sixth column headed "comment” in which the inspection crew may record notes as desired.
- the appropriate line of data corresponding to long defect identifier 50d has been highlighted and designated by the numeral 55.
- the inspection crew Upon reading the defect data set forth in line 55, the inspection crew knows that a defect approximately 11.4 inches long may be found, starting at a point 14.91 ft. (or 14 ft. 10 in.) from the leading edge of pipe joint No. 1, located at circumferential position 6:39 and extending essentially parallel to the longitudinal axis of the tubular member.
- the inspection crew can relatively easily locate the defect corresponding to identifier 50d, and determine whether the affected section of tubing should be repaired or replaced.
- the table illustrated in Figure 5 includes a column specifying the angular orientation of each defect identified.
- the angular orientations calculated by computer 18 based upon information contained in defect signal 24, in combination with other known data.
- defect signal 24 indicates the presence of a plurality of discrete points which, when viewed in their entirety, indicate the presence of an angle defect such as those indicated at 50e and f shown in Figures 4a and c. Since an angle defect is, by definition, positioned at an angle with respect to the longitudinal axis of tubular element 22, the detection of two adjacent discrete points on a given angle defect will require slightly more, or slightly less, than one complete revolution of inspection head 12.
- FIG 6a through Figure 12 illustrate a flow chart for the computer program developed to perform the various signal processing functions incorporated into the preferred embodiment of the present invention. While the illustrated flowchart describes the preferred software for carrying out the principles of this invention, it will be understood by those skilled in the art that substantial changes may be made in the computer program without departing from the scope of the invention.
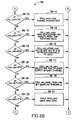
- the flowchart depicting the preferred program consists of a main program illustrated in Figures 6a-c, and six key subroutines illustrated by Figures 7a-d, Figure 8, Figures 9a-e, Figure 10, Figures 11a-b, and Figure 12. A general description of each of these sections is set forth below, followed by a more detailed discussion of the preferred program.
- Figures 6a-c represent the main program which sets up the overall framework work for preforming the processing tasks necessary to receive, process, and display data as discussed herein.
- the main program flowchart 56 illustrates the preferred sequence for identifying the various parameters involved in the procedure, allocating sufficient memory to store the necessary data, and assigning a subroutine or other function to be performed by certain function keys.
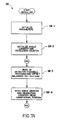
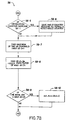
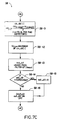
- FIGS 7a-d set forth flowchart 58 which represents a subroutine identified as "demux_adc.”
- the function of the demux_adc program is to enable the computer 18 to receive and store information contained in defect signal 24, circumferential signal 26, and longitudinal signal 28.
- the preferred program set forth in flowchart 58 is designed to accommodate a defect signal 24 comprising 48 separate channels, corresponding to the 48 defect detectors included in the preferred apparatus.
- FIG 8 contains flowchart 60 which represents the "inspl_cmd" (inspection command) subroutine. This subroutine operates to retrieve the defect data from storage and display the data in the inspection mode as illustrated in Figure 4a and discussed above.
- Flowchart 62 disdoses a subroutine labeled "insp_cmd().”
- This portion of the program allows the user of the system to select either short, long, angle, or inspection modes for the two-dimensional display, as discussed above, and also to enhance the display for specified portions when desired.
- the "insp_cmd()" subroutine utilizes the cursor, appearing as the point of intersection between perpendicularx and y axes, to focus on any given point appearing on the two-dimensional display. By selectively moving the x and y axes so that the cursor coincides with a given defect, the user can determine the precise longitudinal and circumferential position of the defect on the two-dimensional map.
- the "insp_cmd()" subroutine identified by flowchart 62 also provides a "screen zooming" feature which yields an enlarged display of a portion of the two-dimensional map, as mentioned above.
- This feature allows the user to view a particular longitudinal section of tubular member 22 in greater detail simply by designating the longitudinal boundaries of the relevant section. For example, if the user desires to see an exploded view of a central portion of tubular member 22 lying between 10 feet and 20 feet, the user can make appropriate designations at the 10 and 20 foot points and the computer program will expand that portion of the display to fill the entire two-dimensional map.
- the subroutine entitled “graph_insp,” identified by flowchart 64 in Figure 10, serves the linking function of correlating the longitudinal position of the defect data with the corresponding position on the two-dimensional map for purposes of carrying out "screen zooming.” Additionally, this subroutine calls a "map_2d” subroutine into play to display the defect data on a CRT screen.
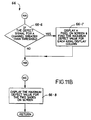
- the "map_2d” subroutine mentioned above is disclosed in flowchart 66 illustrated in Figures 11a and b.
- This subroutine operates to correlate the defect, longitudinal, and circumferential signals to determine the position of each defect, and generate a pixel on the CRT screen to visually display each defect in its proper location.
- this subroutine calls upon the "diff" subroutine which adjusts the display according to the mode (short, long, angle, or inspection) selected by the user.
- Flowchart 66 illustrated in Figure 12 sets forth the framework for the "diff" subroutine mentioned above. This subroutine performs the signal processing functions necessary to distinguish the various types of defects based upon size and angular orientation, thus providing for the different display modes discussed herein.
- the first step is to initialize the parameters governing the process (box 56-1).
- the user establishes the various operating frequencies and threshold values needed for subsequent calculations. Also established at this stage are the pipe speed, detector gain, inspection head rotational velocity, and the length, outside diameter, and wall thickness of the pipe to be inspected.
- a sufficient block of memory is allocated to store the real time data input from signals 24, 25, and 28 (box 56-2).
- the demux_adc subroutine illustrated by flowchart 58 in Figures 7a-d, constitutes the heart of the signal processing features, wherein signals 24, 26, and 28 are received and stored.
- the first step comprises initializing the parameters necessary for performing the operations specified by the remainder of the subroutine (box 58-1).
- the demux_adc subroutine further requires the initialization of the values corresponding to the revolution counter signal 26a and angle counter signal 26b (box 58-2).
- the demux_adc subroutine next directs the computer to read the defects signal 24 for each of the 48 detector channels, with gain and offset balanced (box 58-3), as well as revolution counter signal 26a, angle counter signal 26b, and longitudinal signal 28 (box 58-4).
- the period of rotation for inspection head 12 is then established by determining the angle counter reading corresponding to a single revolution of tool trip head 12 (boxes 58-5 and 58-6).
- the demux_adc subroutine then performs the signal processing functions necessary for the real time screen output and chart recorder output. Initially, the maximum value of the forty-eight channels comprising defect signal 24 is determined (box 58-7) and processed by a digital high pass filter(box 58-8). If the maximum value is less than the pre-set threshold value, the output maximum value (out_max 48 ch) is set at zero (boxes 58-9 and 58-10). The signal difference for each flux detector is then established (boxes 58-111 and 58-12), with the maximum value being processed by a digital band pass filter (box 58-13). If the resulting value (out_dif) is less than a given threshold, the value is set at zero (boxes 58-14 and 58-15).
- out_max 48 ch and out_dif parameters After the out_max 48 ch and out_dif parameters have been determined, the amplitude of out_dif is displayed on the CRT screen in real time (box 58-16), and the values of both parameters are converted into analog signals and sent to a two channel strip chart recorder (box 58-17).
- the computer determines if the raw data should be stored by discarded (boxes 58-18 and 58-19), and the data acquisition sequence is continued, if necessary, with the data record being updated accordingly (boxes 58-20 and 58-21).
- the inspl_cmd subroutine referred to above is identified by flowchart 60 set forth in Figure 8.
- this subroutine serves initially to assign a value of 1 to the insp_mode variable "inspect mode,” and create a flag to signal the acquisition of new data (box 60-1).
- this is a preliminary step essential to the operation of the insp_cmd() subroutine which is called into play by the inspl_cmd (box 60-2) as set forth in more detail below.
- the insp_cmd() identified generally as subroutine 62, requires that additional parameters be initialized before performing the operation specified therein (box 62-1).
- new data is automatically acquired if the insp_mode value equals 1 (boxes 62-2 and 62-3). Regardless of whether or not new data is acquired, the insp_mode is reset to zero and a suitable display record is set up to indicate the length of tubing corresponding to the required data (box 62-4).
- the computer next determines if all the acquired data records ("acq_rec") have been received and, if not, the user is instructed to depress the F1 key to acquire new data (box 62-5). If all data has been received, the graph_insp subroutine is called to generate a two-dimensional map and display the records thereon (box 62-6).
- the next series of operations performed by the insp_cmd() subroutine provide the on screen focusing feature which allows the user to pinpoint the location of the defects appearing on the two-dimensional map.
- the text_insp subroutine is called and the cursor position is shown as the intersection between x and y axes (box 62-7).
- the user is then able to accurately position the cursor by moving the x and y axes by depressing the correct key on the keyboard (box 62-8).
- the "left cursor” key serves to move the x axis left (boxes 62-9 and 62-10), the “right cursor” key moves the x axis right (boxes 62-11 and 62-12), the “up cursor key moves the y axis upwardly (boxes 62-13 and 62-14) and the “down cursor” key moves the y axis downwardly (boxes 62-15 and 62-16).
- the user has the option of regenerating the screen simply by depressing the "HOME” key (boxes 62-17 and 62-18), or exiting the subroutine by depressing the "ESCAPE” key (box 62-19).
- the insp_cmd() subroutine allows the user to vary the display mode between short, long, angle, and inspection modes, and regenerate the two-dimensional map accordingly, as discussed above.
- the program assigns a numerical entry corresponding to each different mode, as follows: if the numeral "1" is entered, the two-dimensional map is regenerated in the angle mode (boxes 62-20 and 62-21); if the numeral "2" is entered, the map is regenerated as the short mode (boxes 62-22 and 62-23); if the numeral "3" is entered, the map is regenerated in the long mode (boxes 62-24 and 62-25); and if the numeral "4" is entered, the map is regenerated in the inspection mode (boxes 62-26 and 62-27).
- This subroutine also assigns functions to various letters of the alphabet to provide additional features which may be helpful to the user of the system. As illustrated, the selection of the letter “R” calls a report_reject subroutine which generates the defect summary shown in Figure 5 (boxes 62-28 and 62-29). Selection of the letters “S”, “F”, or “V” varies the speed of the cursor movement from slow, to fast, to very fast, respectively (boxes 62-30 through 62-35).
- Selection of the letter “P” instructs the computer to pot the two-dimensional display map on an attached plotter (boxes 62-36 and 62-37). If the user desires to change the threshold value to increase or decrease the amount of information being displayed, the letter “T” may be selected (boxes 62-38 and 62-39). Entry of the letter “M”” allows the user to select a completely different analysis algorithm, assign a corresponding channel half width value (ch_half_width), and regenerate the two-dimensional display map in accordance with the new algorithm (boxes 62-40 and 62-41).
- the user of system 10 can quickly check the high pass and low pass filter values for the digital filters included in the chart recorder output by entering either the letter "H” or "L”, respectively (boxes 62-42 through 62-45). Finally, by entering the letter "Z", the user can utilize the screen zooming feature discussed above, wherein the first "Z” entry marks the initial longitudinal boundary and the second "Z” entry marks the final longitudinal boundary for enlarged view (boxes 62-46 and 62-47).
- the insp_cmd() subroutine automatically checks the positions of the x and y axes to insure that both are within the range of the two-dimensional display shown on the screen (box 62-48). In the event that one or more of the previously described functions has been performed, thus temporarily removing the two-dimensional display map, the cursor is then redisplayed as the intersection of x and y axes (box 62-49).
- the graph_insp subroutine referenced at box 62-6 is illustrated as flowchart 64 in Figure 10. Additional parameters must first be initialized (box 64-1) in order for the computer to perform the correlating functions of this subroutine. After the necessary parameters have been established, the axial, or longitudinal, display positions on the CRT screen are correlated to the defect data points contained in the data records for purposes of the screen zooming feature discussed above (box 64-2). After this correlation, or mapping, procedure has begun, the map_2d subroutine is called upon to display the data on the CRT screen (box 64-3) while the correlation continues until completed (box 64-4).
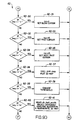
- the map_2d subroutine referred to above is illustrated as flowchart 66 in Figures 11a and b. As with certain other subroutines, this portion of the program requires that new parameters be initialized before any additional processing is performed (box 66-1).
- the processing functions of this subroutine are essentially contained within a logic loop, wherein the computer first determines if all the records are being displayed (box 66-2) and, if so, the maximum defect value for each of the two detector head segments 13 is displayed on the screen (box 66-8).
- the computer determines that all records are not yet being displayed, it proceeds by first obtaining additional position information from the data records (box 66-3).
- the diff subroutine is next called upon to apply suitable algorithms to the raw data, thus generating four sets of distinctive values, with each set corresponding to one of the four display modes, short, long, angle, or inspection (box 66-4).
- the longitudinal and circumferential location for each of the forty-eight detector channels are next determined by correlating signals 24, 26, and 28 (box 66-5).
- the predetermined threshold value for the particular display mode selected is compared to each numerical value comprising defect signal 24 and, if the signal value is greater than the threshold value, a pixel is displayed on the CRT screen for the maximum defect value for each longitudinal position along the length of tubular member 22, as displayed on the two-dimensional map (boxes 66-6 and 66-7). If, on the other hand, the defect signal value is less than the threshold value, the signal value ignored and the logic loop repeated.
- the final key portion of the preferred program for this invention is the diff subroutine identified by flowchart 68 in Figure 12. Since the function of this program is to process all numerical values contained within defect signal 24, it is imperative that the gain setting be matched for each of the forty-eight channel corresponding to the forty-eight separate flux detectors (box 68-1). The computer then performs one of five possible calculations depending upon the channel half width selected by the user.
- the voltages for all channels are calculated for each discrete solid segment of tubular member 22 (boxes 68-2 ad 68-3). If, however, a channel half width of 1, 3, 25, or 26 is selected, the voltage values are processed according to the angle algorithm, short algorithm, long algorithm, or inspection algorithm, respectively, to generate the distinctive values needed to produce the four different display modes discussed above (boxes 68-4 and 68-11).
Landscapes
- Chemical & Material Sciences (AREA)
- Chemical Kinetics & Catalysis (AREA)
- Electrochemistry (AREA)
- Physics & Mathematics (AREA)
- Health & Medical Sciences (AREA)
- Life Sciences & Earth Sciences (AREA)
- Analytical Chemistry (AREA)
- Biochemistry (AREA)
- General Health & Medical Sciences (AREA)
- General Physics & Mathematics (AREA)
- Immunology (AREA)
- Pathology (AREA)
- Investigating Or Analyzing Materials By The Use Of Magnetic Means (AREA)
- Investigating Materials By The Use Of Optical Means Adapted For Particular Applications (AREA)
Description
- This invention relates to defect inspection of tubular elements, and more particularly to displaying the results of such defect inspection in a readily usable format.
- Continuous tubular strings formed of connectable tubular sections or elements, such as production tubing strings, drill pipe strings and casing strings, are used in the drilling, completion and production of subterranean oil and gas wells. The individual tubular elements, which are typically steel castings, frequently containing manufacturing defects such as seams, laps, inclusions, and gouges which could result in costly failures if undetected prior to installation. Therefore, tubular elements are commonly inspected at the point of manufacture so that any serious defect can be located and repaired, if possible, before the defective tubing is shipped to the well site.
- Tubular elements are also subject to various forms of mechanical damage after being installed within a well. It is therefore advantageous that the individual tubular elements comprising a tubular string be inspected periodically. Typically, the inspection of tubular sections occurs after the individual sections comprising the tubing string have been removed from the well and disengaged. Defect inspections are conventionally performed on a section by section basis.
- A number of techniques exist for determining the presence of a defect in a tubing section. For example, the location of internal and external radially extending and three-dimensional defects, including slug indusions, mechanical damage, pitting and fatigue cracks, has been determined by flux leakage techniques in which a longitudinal magnetic field is induced by one or more magnetic induction coils. External flux detectors are located around the tubing and the maximum signal is recorded to locate the defect. Similarly, longitudinal defects may be detected magnetically by the "rotating pole" method, where the magnetic field is applied from the outside by rotating electromagnets, and flux detectors positioned between the poles scan the outside surface of the pipe. Various techniques relating to electromagnetic inspection are well known in the art with a list of examples being set forth in the following U.S. patents:
- 4,492,115 4,636,727
- 4,555,665 4,698,590
- 4,578,642 4,704,580
- 4,611,170 4,710,712
- 4,629,985 4,715,442
- 4,629,991 4,792,756
-
- While electromagnetic inspection systems have become widely accepted in the industry, various other techniques are also available and may even be preferable depending on the circumstances. Such other inspection techniques include the use of radiation as set forth in U.S. patent Nos. 3,835,323 and 3,855,465. Also known in the art, but less frequently utilized, are ultrasonic inspection systems.
- Any of the above mentioned inspection techniques may be utilized to adequately detect the presence of defects located within the wall of tubular elements. The most essential function of existing inspection devices is to generate an electrical signal containing information regarding physical characteristics such as defects and other irregularities in a given segment of a tubular member, and to display such information in a useful manner. Typically, the display consists of a strip chart generated on a strip recorder, indicating the aforementioned electrical signal in analog form with a graphic indication for each irregularity sensed by the detecting device. An inspection crew then utilizes the graph as a guide to visually confirm the existence of serious defects which would result in the rejection of the tubular element being inspected. Conventional graphic displays, however, are severely limited in their ability to convey useful information to the inspection crew responsible for visually locating defects.
- A conventional strip chart display provides a very general indication of the existence of a defect and its longitudinal position along the length of a tubular member. The existence of a defect is indicated by one or more vertical peaks in the graph, while the longitudinal position roughly corresponds to the location of the peak (or peaks) along the horizontal axis. If the display contains a plurality of closely adjacent peaks, conventional systems do not distinguish between several closely adjacent defects, a single large defect, or several defects at the same longitudinal position but spaced apart circumferentially. In fact, with respect to the third situation, conventional systems provide virtually no useful information to the inspection crew regarding the circumferential location of any defects. In short, conventional displays provide no usable information regarding the shape, size or amplitude of a defect, and only minimal information regarding the location.
- The absence of circumferential position indications in conventional graphic displays becomes an even greater problem when the tubing to be inspected contains a longitudinal weld seam. Since a seam is essentially a continuous irregularity extending from one end of the pipe section to the other, it appears on a conventional graphic display as a continuous string of defects indicated by a solid line of peaks. As such, the weld seam indications on the graphic display completely overshadow all other indications, thus making it virtually impossible to distinguish the weld seam from the defects.
- In addition to the imprecise defect locating capabilities of prior art systems, conventional inspection devices typically employ band pass filters to remove extraneous information, such as the presence of certain non-defect irregularities, from the incoming signal. This technique is effective for the intended purpose, but the information filtered out is permanently losL Conventional systems do not allow the user thereof to include all extreme signal values in the display, if so desired.
- GB-A-2192993 discloses a eddy current surface mapping system in which an eddy current probe is scanned in two dimensions over an object to be mapped. First and second movement signals representing first and second scan directions of the probe are generated. The first and second movement signals are combined in a signal mixer with the the mutually perpendicular drive signals to produce first and second composite signals which vary as a function of the moment of the probe and eddy current signal. The composite signals are applied to a display mean for generating a three dimensional or pseudo-three dimensional image representative of irregularities in the part.
- US-A-4,492,115 discloses a method and apparatus for measuring defects in ferromagnetic tubing wherein a tubing trip tool measures tubing average wall thickness, local defects and axial defects. A saturating magnetic field and a fluctuating magnetic field are applied to the tubing and the magnitude of the induced fields and the changes are measured to quantify defects in the tubing.
- US-A-3,694,740 relates to a system for the magnetic non-destructive testing of materials for long and short defects. The system comprises a coil system for detecting short effects as seen in the longitudinal direction of the product and inducing a magnetic field in the product to be tested and a sensing means rotating arround the product and cooperating with said magnetic field for detecting long defects.
- EP-A-0 315 887 discloses an eddy current flaw detecting apparatus and method comprising a pair of detection coils connected in adjoining arms of flaw detecting bridge circuit. The planes containing the coils are arranged parallel to each other and inclined at an angle between 75° and 85° to the axis of a fuel clad pipe to be examined. When a flaw is detected while the pipe is moved relative to the detection coils a characteristic curve between the flaw signal output and the turning angle is obtained to determine the circumferential and axial orientations of the flaw in comparison with characteristic curves between flaw signals and turning angels obtained in advance from standard flaw testing pieces.
- EP-A-0 276 550 is also based on an eddy current flaw and discloses a method and apparatus for performing eddy current flaw inspection on workpiece material such as steel bar stock.
- EP-A-0 301 906 discloses an other apparatus and method for providing a combined ultrasonic and eddy current inspection of a tube wherein the method includes correlations of the data generated by the ultrasonic probes with the data generated by the eddy current probe for determining th size, shape and nature of any flaw in the tube walls.
- The present invention as defined in
claims - The computer program utilized to process the signals and display the defect data provides a great deal of flexibility for the present invention. The degree to which the incoming signals are filtered may be selected as desired thus providing for a greater or lesser degree of accuracy as warranted by the situation. The computer program also provides the capability of selectively tailoring the visual display such that various kinds of defects may be emphasized or de-emphasized as desired.
- Other advantages and features of the present invention will become more readily apparent from the following detailed description, when read in conjunction with the accompanying drawings, in which:
- Figure 1 is a simplified, functional block diagram of the preferred embodiment of the system of the present invention;
- Figure 2 is a simplified, functional, block diagram of the embodiment of Fig. 1, showing additional features of the preferred circumferential position detector;
- Figure 3 is a strip chart representative of the defect displaying capability of prior art inspection systems;
- Figures 4a-4d are examples of the preferred graphical and two-dimensional defect displays produced using principles of the present invention;
- Figure 5 is an example of an alternative defect display in tabular form produced using principles of the present invention; and
- Figures 6a-12 are a simplified flow chart of the main computer program and key subroutines which perform the signal processing functions for the preferred embodiment of the present invention.
-
- Figures 1 and 2 provide schematic depictions of the preferred system for carrying out principles of the present invention, with Figure 2 emphasizing certain features of the preferred apparatus. Referring initially to Figure 1, the principles disclosed herein are preferably embodied in
system 10, which generally consists ofinspection head 12,circumferential position detector 14,longitudinal position detector 16, a central processing unit orcomputer 18, and a variety of visual display devices collectively identified by the numeral 20. While it is preferred thatsystem 10 include a CRT 20a, chart recorder 20b, plotter 20C, and printer 20d, it is only necessary forsystem 10 to include some form of visual display compatible for use withcomputer 18. It will be understood by those skilled in the art that any number of conventional visual display devices may be suitable for the purposes of the present invention. - As illustrated,
system 10 may be effectively employed to accurately determine the extent of defects in atubular member 22, an visually display the defects in great detail ondisplay device 20.Tubular member 22 typically consists of a single section or joint of pipe associated with oil and gas wells.System 10 may also be incorporated into an on-site inspection facility, wherein an entire tubing string may be conveniently inspected during removal from the well bore. Regardless of whethersystem 10 is intended for on-site or off-site inspection, the most significant physical requirement is thattubular member 22 andinspection head 12 be movable relative to one another along the longitudinal axis oftubular member 22 to insure complete inspection oftubular member 22 from one end to the other. Typically, off-site inspection,system 10 would includeinspection head 12 mounted in a laterally fixed position withtubular member 22 longitudinally movable therethrough by means of a conveyor. For on-site inspection, on the other hand,system 10 would haveinspection head 12 vertically fixed above the well bore, andtubular member 22 would be drawn upwardly therethrough during removal from the bore. - During operation of
system 10,inspection head 12 comprises the means for generating adefect signal 24, which includes a variety of information about the physical characteristics oftubular member 22. Included in this information are the identification and configuration of any and all defects located within the body oftubular member 22. At any given instant during the operation,inspection head 12 is generating adefect signal 24 representing the characteristics of a single discrete solid segment oftubular member 22. By suitably movinginspection head 12 from one end oftubular member 22 to the other, the content ofdefect signal 24 is broadened to include information regarding the entire solid volume oftubular member 22, the entire solid volume consisting of the aggregate sum of all discrete solid segments. - As
inspection head 12 moves longitudinally relative totubular member 22,circumferential position detector 14 andlongitudinal position detector 16 generatecircumferential signal 26 andlongitudinal signal 28, respectively, which contain information indicating the location of the defects detected byinspection head 12.Signals computer 18, which utilizes conventional microprocessor circuitry to correlate the signals, thus obtaining a useful set of data concerning the presence, configuration, angular orientation, and precise location of the defects withintubular member 22. This data, referred to herein as "defect data", is then displayed either in its entirety or in selected portions on one or more of thevisual display devices 20. Illustrative examples of the visual display provided by the principles of the present invention are set forth in Figures 4a-4d and Figure 5. - Those skilled in the art will recognize that signals 24, 26, and 28 will be generated as analog signals of varying voltages, and must be converted to corresponding digital signals prior to processing by
computer 18. It will also be understood that certain filtering networks may be employed in order to effect such conversions. High pass or low pass filters, however, are not necessary to segregate detect data from non-defect data withindefect signal 24 due to the unique signal processing features of the present invention, discussed in greater detail below. Of course,defect signal 24 may be segregated by conventional band pass filters without departing from the scope of the present invention. As used herein, defect data relates to those irregularities which would result in the rejection oftubular member 22, while non-defect data relates to less severe irregularities, which would not result in such a rejection. - Since
defect signal 24 generally contains an enormous volume of information, only a portion of which relates to actual defects, it is necessary to selectively reduce the volume of information so the memory capacity ofcomputer 18 is not exceeded. Rather than applying a conventional low-pass filter to screen out the frequencies normally associated with non-defect irregularities, the present invention includes certain programming steps to enablecomputer 18 to distinguish defect information from non-defect information. Afterdefect signal 24 has been digitized, the numerical values contained therein are compared bycomputer 18 to a threshold number selected by the user. The threshold is typically one and one-half times the average numerical value of digitizeddefect signal 24, but is may be varied as desired depending on the defect tolerances of the user.Computer 18 operates to discard all data having a numerical value less than the threshold, and record the remainder for further processing. - The present invention represents a unique combination of
inspection head 12 withcircumferential position detector 14 andlongitudinal position detector 16, and the principles of this invention are intended to apply regardless of the precise embodiment of these components. In particular,inspection head 12 is preferably intended to be an electromagnetic detection device, such as that disclosed in U.S. Patent No. 4,710,712, but the teachings of this invention are equally applicable for use with a radiation inspection apparatus, an ultrasonic inspection apparatus, or any other inspection apparatus capable of generating asuitable defect signal 24. The interchangeability of various types of inspection heads will be fully appreciated by those skilled in the art. - The preferred apparatus for carrying out the principles of this invention includes two
detector head segments 13, each of which contains twenty-four detecting coils and/or probes for detecting magnetic flux leakage. Therefore,defect signal 24 preferably consists of the multiplexed signals from forty-eight separate flux detectors, each of which is generating a signal, at any given instant, indicative of the defects in a separate discrete solid segment oftubular member 22. It is conceivable, however, that any number offlux detectors could be employed for the purposes disclosed herein. It is understood in the art that a large number of relatively small flux detectors effectively dividestubular member 22 into a greater number of discrete solid segments, thus improving the resolution of the visual display appearing ondisplay device 20. - In the preferred embodiment of the present invention,
circumferential position detector 14 is magnetic sensor which detects each rotation ofinspection head 12, by means ofmagnet 30 which is secured thereto as illustrated in Figure 2. As such,position detector 14 serves as the sensing means forrevolution counter 32, which simply providescomputer 18 with asignal 26a indicating the passing of each revolution. To complete the information needed for determining circumferential position,clock 34 and angle counter 36 providetiming signal 26b which is conventionally combined withsignal 26a bycomputer 18 to calculate the rotational position ofinspection head 12 at any given instant.Computer 18 then correlates this information with the defect data transmitted bydefect signal 24 and the longitudinal position transmitted bylongitudinal signal 28 and displays the results ondisplay devices 20 as set forth herein. For convenience and simplicity,revolution counter signal 26a andangle counter signal 26b are cumulatively referred to ascircumferential signal 26. - Alternatively,
circumferential position detector 14 may consist of any suitable apparatus for determining the circumferential position of the defect detector and generating a correspondingcircumferential signal 26. It is expected that with certain "fixed-head" defect detectors, the circumferential position of defects will be indicated by the defect detector itself, and a separatecircumferential position detector 14 may be eliminated altogether. -
Longitudinal position detector 16 preferably consists of a wheel rotatably secured to a rigid support member such that its outer edge surface bears against the outer surface oftubular member 22. As the wheel ofposition detector 16 rolls longitudinally along the entire length oftubular member 22, a transducer connected to the wheel generateslongitudinal signal 28 which generally corresponds to the distance traveled by the wheel, thus providingcomputer 18 with sufficient information to determine the longitudinal position ofinspection head 12 and any defects detected thereby. To best illustrate the features and advantages of the present invention, it is helpful to start with a typical visual display as provided by the prior art. Figure 3 is a reproduction of such a display, as trip chart produced on a chart recorder by an electromagnetic inspection system utilizing two detector head segments in a rotating detector apparatus, each head segment generating a separate line on the graphic display.Horizontal axes Vertical elements 42 indicate irregularities located within the body ofthe tubular member, with the longer elements such as peaks 42a, indicating the most likely presence of a defect. The location of peaks 42a along thehorizontal axes - While most of the tubing presently in use in the oil and gas industry contains no longitudinal seam, there will be occasions from time to time wherein welded tubing containing a longitudinal seam must be inspected. Conventional graphic displays have proven to be inadequate for displaying the results of such inspections, since the presence of the continuous longitudinal seam completely dominates the graphic display to the extent that the display is nothing but a continuous series of peaks which overshadow any indications of defects.
- In stark contrast to the crude printout produced by prior art methods and devices, Figures 4a-d represent examples of the highly informative graphic displays made possible by the teachings of the present invention. The examples shown may either be observed on a CRT screen, or reproduced on a printer, plotter, or chart recorder. Referring initially to Figure 4a, it can be seen that the unique function of the present invention yields a two-
dimensional map 44 of the defects located withintubular member 22. Preferably,map 44 includes ahorizontal axis 46 corresponding generally to the longitudinal length oftubular member 22, andvertical axis 48 corresponding to the circumference oftubular member 22, with the graduation marks alongvertical axis 48 signifying degrees of rotation from a preselected 12 o'clock position. For purposes of calibratingmap 44 withtubular member 22, the twelve o'clock position is noted prior to inspection. Defect identifiers 50a-f indicate the presence, configuration, longitudinal position, and circumferential position of each defect located throughouttubular member 22. When viewed on a CRT screen, defect identifiers 50a-f constitute groups of one or more pixels. - For the sake of convenience and to suit the needs of a particular customer, the defect identifiers may be classified by the relative size of their corresponding defects. Accordingly, defect identifiers 50a, b and c indicate the presence of short defects, 50d indicates the presence of a long defect, and 50e and f indicate the presence of defects having angular orientations, or angle defects. The designations "short," "long," and "angle" are relative terms as used herein, and do not correspond to any particular absolute dimensions of size. The significance of these terms will become apparent in light of the additional features of the preferred embodiment as discussed below.
- Positioned immediately beneath
map 44 isgraph 52, indicating a graphical representation of the signals received from the twohead segments 13 ofinspection head 12. Rather than indicating the analog signal as with prior art devices,graph 52 depicts the digitized version ofdefect signal 24 after processing bycomputer 18. As such,graph 52 is a much more accurate representation of the actual state of defects withintubular member 22. - In the preferred formats shown, the far right-hand side of the display contains certain information regarding the parameters of the procedure and the physical characteristics of the tubing being inspected. In addition to the display mode, this section indicates the threshold value for the display, the rotational velocity (in RPM's) of the
inspection head 12, the percentage of coverage provided by theinspection head 12, and the outside diameter, wall thickness, and grade oftubular member 22. Of course, this section of the display may be altered as desired without departing from the principles of this invention. - In order to selectively filter out false or non-defect indications in
map 44,graph 52 includesthreshold line 54 which may be set or altered according to the particular needs of the customer. The threshold value represented byline 54 serves as a computer generated high pass filter which only allows those values greater than the threshold to appear as defect identifiers onmap 44. In the preferred display shown, the threshold value setting is indicated with the information shown to the right ofmap 44 andgraph 52. - In addition to the threshold value setting, the information shown at the extreme right of Figures 4a-d includes the mode selected for the particular display. For the examples shown, Figure 4a represents a display in the inspection mode, Figure 4b represents the same display in the set up short mode, Figure 4c represents the same display in the set up angle mode, and Figure 4d represents the same display in the set up long mode. Essentially, Figure 4a is the cumulative version of Figures 4b, c, and d, in which short defects, long defects, and angle defects are given substantially equal prominence. In Figure 4b, on the other hand, the selection of the set up short mode by the user results in additional processing being performed by
computer 18 so that short defects are emphasized, with long and angle defects being omitted or shown in distorted fashion. For example, in Figure 4b short defect identifiers 50a, b, and c, appear more clearly than in Figure 4a, whereaslong defect identifier 50d appears in broken form andangle identifiers 50e and f do not appear at all. Similarly, in Figure 4cangle defect identifiers 50e and f are clearly displayed, but short defect identifiers 50a, b and c have disappeared andlong defect identifier 50d appears broken. Finally, Figure 4d reveals howlong defect identifier 50d is emphasized while short defect identifier 50a andangle defect identifiers 50e and f are not shown. The programming steps necessary to isolate the different types of defects and produce the different displays shown in Figures 4a-d provide a higher degree of defect identification than is presently known in the industry. - With the preferred embodiment of this invention, it is also possible to display the defect data in tabular form as shown in Figure 5. The table of Figure 5 includes four columns of information reflecting the physical characteristics of the defects in
tubular member 22. The characteristic shown for each defect are the longitudinal position, the circumferential position, longitudinal or axial length, and the angular orientation. The presentation of defect data in this manner provides a convenient tool for assisting the inspection crew in visually locating each defect. In addition to the four columns of defect data, the preferred table also includes a fifth column headed "joint number" for identifying the section or joint of tubing being inspected, and a sixth column headed "comment" in which the inspection crew may record notes as desired. - To illustrate the convenience of the tabular display set forth in Figure 5, the appropriate line of data corresponding to
long defect identifier 50d has been highlighted and designated by the numeral 55. Upon reading the defect data set forth inline 55, the inspection crew knows that a defect approximately 11.4 inches long may be found, starting at a point 14.91 ft. (or 14 ft. 10 in.) from the leading edge of pipe joint No. 1, located at circumferential position 6:39 and extending essentially parallel to the longitudinal axis of the tubular member. Armed with this knowledge, the inspection crew can relatively easily locate the defect corresponding toidentifier 50d, and determine whether the affected section of tubing should be repaired or replaced. - As noted above, the table illustrated in Figure 5 includes a column specifying the angular orientation of each defect identified. The angular orientations calculated by
computer 18 based upon information contained indefect signal 24, in combination with other known data. Asinspection head 12 rotates aroundtubular member 22 at a constant rotational velocity,defect signal 24 indicates the presence of a plurality of discrete points which, when viewed in their entirety, indicate the presence of an angle defect such as those indicated at 50e and f shown in Figures 4a and c. Since an angle defect is, by definition, positioned at an angle with respect to the longitudinal axis oftubular element 22, the detection of two adjacent discrete points on a given angle defect will require slightly more, or slightly less, than one complete revolution ofinspection head 12. This phenomenon results in a time differential, or time lag, between the detection of adjacent points on an angle defect and the period of rotation ofinspection head 12.Computer 18, being pre-programmed with the rotational and longitudinal velocity ofinspection head 12, can then apply conventional mathematical principles to determine the angular displacement of a first point from a second point on an angle defect, the angular displacement typically being determined with reference to the longitudinal axis oftubular member 22. The angular displacement between two discrete points on the defect is thus displayed in Figure 5 as the angular orientation of the defect. - Figure 6a through Figure 12 illustrate a flow chart for the computer program developed to perform the various signal processing functions incorporated into the preferred embodiment of the present invention. While the illustrated flowchart describes the preferred software for carrying out the principles of this invention, it will be understood by those skilled in the art that substantial changes may be made in the computer program without departing from the scope of the invention.
- As disclosed herein, the flowchart depicting the preferred program consists of a main program illustrated in Figures 6a-c, and six key subroutines illustrated by Figures 7a-d, Figure 8, Figures 9a-e, Figure 10, Figures 11a-b, and Figure 12. A general description of each of these sections is set forth below, followed by a more detailed discussion of the preferred program.
- Figures 6a-c represent the main program which sets up the overall framework work for preforming the processing tasks necessary to receive, process, and display data as discussed herein. The
main program flowchart 56 illustrates the preferred sequence for identifying the various parameters involved in the procedure, allocating sufficient memory to store the necessary data, and assigning a subroutine or other function to be performed by certain function keys. - Figures 7a-d set forth
flowchart 58 which represents a subroutine identified as "demux_adc." The function of the demux_adc program is to enable thecomputer 18 to receive and store information contained indefect signal 24,circumferential signal 26, andlongitudinal signal 28. The preferred program set forth inflowchart 58 is designed to accommodate adefect signal 24 comprising 48 separate channels, corresponding to the 48 defect detectors included in the preferred apparatus. - Figure 8 contains
flowchart 60 which represents the "inspl_cmd" (inspection command) subroutine. This subroutine operates to retrieve the defect data from storage and display the data in the inspection mode as illustrated in Figure 4a and discussed above. -
Flowchart 62, as shown in Figures 9a-e, disdoses a subroutine labeled "insp_cmd()." This portion of the program allows the user of the system to select either short, long, angle, or inspection modes for the two-dimensional display, as discussed above, and also to enhance the display for specified portions when desired. The "insp_cmd()" subroutine utilizes the cursor, appearing as the point of intersection between perpendicularx and y axes, to focus on any given point appearing on the two-dimensional display. By selectively moving the x and y axes so that the cursor coincides with a given defect, the user can determine the precise longitudinal and circumferential position of the defect on the two-dimensional map. - The "insp_cmd()" subroutine identified by
flowchart 62 also provides a "screen zooming" feature which yields an enlarged display of a portion of the two-dimensional map, as mentioned above. This feature allows the user to view a particular longitudinal section oftubular member 22 in greater detail simply by designating the longitudinal boundaries of the relevant section. For example, if the user desires to see an exploded view of a central portion oftubular member 22 lying between 10 feet and 20 feet, the user can make appropriate designations at the 10 and 20 foot points and the computer program will expand that portion of the display to fill the entire two-dimensional map. - The subroutine entitled "graph_insp," identified by
flowchart 64 in Figure 10, serves the linking function of correlating the longitudinal position of the defect data with the corresponding position on the two-dimensional map for purposes of carrying out "screen zooming." Additionally, this subroutine calls a "map_2d" subroutine into play to display the defect data on a CRT screen. - The "map_2d" subroutine mentioned above is disclosed in
flowchart 66 illustrated in Figures 11a and b. This subroutine operates to correlate the defect, longitudinal, and circumferential signals to determine the position of each defect, and generate a pixel on the CRT screen to visually display each defect in its proper location. When creating the visual display, this subroutine calls upon the "diff" subroutine which adjusts the display according to the mode (short, long, angle, or inspection) selected by the user. -
Flowchart 66 illustrated in Figure 12 sets forth the framework for the "diff" subroutine mentioned above. This subroutine performs the signal processing functions necessary to distinguish the various types of defects based upon size and angular orientation, thus providing for the different display modes discussed herein. - In order to carry out the principles of the present invention utilizing the preferred program for this purpose, identified schematically as
flowchart 56, the first step is to initialize the parameters governing the process (box 56-1). At this stage in the inspection procedure, the user establishes the various operating frequencies and threshold values needed for subsequent calculations. Also established at this stage are the pipe speed, detector gain, inspection head rotational velocity, and the length, outside diameter, and wall thickness of the pipe to be inspected. After all necessary operating parameters have been established, a sufficient block of memory is allocated to store the real time data input fromsignals - Once the internal functions and parameters have been initialized and the memory is properly allocated, the main program instructs the computer to run various subroutines and functions in response to certain entries (box 56-3). The operations automatically performed upon selection of function keys F1-F10 are assigned as follows:
- F1 calls the inspl_cmd subroutine, displayed in
Figure 8 as
flowchart 60, which assigns a flag value to indicate the acquisition of new data and further calls the insp_cmd() subroutine for generating the two-dimensional display (boxes 56-4 and 56-5); - F2 calls a dsp_cmd subroutine which simply displays the raw real time data (boxes 56-6 and 56-7);
- F3 calls the inspl_cmd subroutine, illustrated as
flowchart 60 in Figure 8 which generates the two-dimensional display map for inspection (boxes 56-8 and 56-9); - F4 calls a para_cmd subroutine which allows the user to change the parameters as desired (56-10 and 56-11);
- F5 calls an rpm_cmd subroutine which displays the rotational velocity of the rotating inspection head 12 (56-12 and 56-13);
- F6 calls the det_offset_cmd subroutine which allows the user to set the required offset for each detector channel (56-14) and 56-15);
- F7 calls a set_ch_cmd subroutine which allows the user to select the multiplexer output value for each detector channel (boxes 56-16 and 56-17);
- F8 calls a set_samp_phres_cmd subroutine which allows the user to set the sampling threshold (boxes 56-18 and 56-19);
- F9 calls the save_cmd subroutine which operates to save the data received through input signals 24, 26 and 28 (boxes 56-20 and 56-21);
- F10 calls the help_cmd subroutine which generates a help menu on the screen (boxes 56-22 and 56-23);
- "Read" command calls the read_cmd subroutine which allows the user to read raw data directly from the file (boxes 56-24 and 56-25);
- "DOS" command sets the computer up to perform conventional DOS commands (boxes 56-26 and 56-27); and
- the "ESCAPE" key returns the computer to DOS format (box 56-28).
-
- The order ofthe steps performed by the main program illustrated in
flowchart 56 constitutes a convenient, logical progression for creating the framework for the overall programming including all subroutines. It will be understood by those skilled in the art, however, that the precise order of steps is, in many instances, simply a matter of choice, and may be rearranged considerably without departing from the teachings of the present invention. - The demux_adc subroutine, illustrated by
flowchart 58 in Figures 7a-d, constitutes the heart of the signal processing features, wherein signals 24, 26, and 28 are received and stored. As with virtually any computer program, the first step comprises initializing the parameters necessary for performing the operations specified by the remainder of the subroutine (box 58-1). In addition to the parameters previously selected for the main program, the demux_adc subroutine further requires the initialization of the values corresponding to therevolution counter signal 26a andangle counter signal 26b (box 58-2). - The demux_adc subroutine next directs the computer to read the defects signal 24 for each of the 48 detector channels, with gain and offset balanced (box 58-3), as well as
revolution counter signal 26a,angle counter signal 26b, and longitudinal signal 28 (box 58-4). The period of rotation forinspection head 12 is then established by determining the angle counter reading corresponding to a single revolution of tool trip head 12 (boxes 58-5 and 58-6). - The demux_adc subroutine then performs the signal processing functions necessary for the real time screen output and chart recorder output. Initially, the maximum value of the forty-eight channels comprising
defect signal 24 is determined (box 58-7) and processed by a digital high pass filter(box 58-8). If the maximum value is less than the pre-set threshold value, the output maximum value (out_max 48 ch) is set at zero (boxes 58-9 and 58-10). The signal difference for each flux detector is then established (boxes 58-111 and 58-12), with the maximum value being processed by a digital band pass filter (box 58-13). If the resulting value (out_dif) is less than a given threshold, the value is set at zero (boxes 58-14 and 58-15). - After the
out_max 48 ch and out_dif parameters have been determined, the amplitude of out_dif is displayed on the CRT screen in real time (box 58-16), and the values of both parameters are converted into analog signals and sent to a two channel strip chart recorder (box 58-17). The computer then determines if the raw data should be stored by discarded (boxes 58-18 and 58-19), and the data acquisition sequence is continued, if necessary, with the data record being updated accordingly (boxes 58-20 and 58-21). - The inspl_cmd subroutine referred to above is identified by
flowchart 60 set forth in Figure 8. this subroutine serves initially to assign a value of 1 to the insp_mode variable "inspect mode," and create a flag to signal the acquisition of new data (box 60-1). this is a preliminary step essential to the operation of the insp_cmd() subroutine which is called into play by the inspl_cmd (box 60-2) as set forth in more detail below. - The insp_cmd(), identified generally as
subroutine 62, requires that additional parameters be initialized before performing the operation specified therein (box 62-1). Next, relying upon an instruction previously supplied by the inspl_cmd subroutine, new data is automatically acquired if the insp_mode value equals 1 (boxes 62-2 and 62-3). Regardless of whether or not new data is acquired, the insp_mode is reset to zero and a suitable display record is set up to indicate the length of tubing corresponding to the required data (box 62-4). The computer next determines if all the acquired data records ("acq_rec") have been received and, if not, the user is instructed to depress the F1 key to acquire new data (box 62-5). If all data has been received, the graph_insp subroutine is called to generate a two-dimensional map and display the records thereon (box 62-6). - The next series of operations performed by the insp_cmd() subroutine provide the on screen focusing feature which allows the user to pinpoint the location of the defects appearing on the two-dimensional map. After all the data is properly displayed on the two-dimensional display, the text_insp subroutine is called and the cursor position is shown as the intersection between x and y axes (box 62-7). The user is then able to accurately position the cursor by moving the x and y axes by depressing the correct key on the keyboard (box 62-8).
- In the preferred embodiment illustrated, the "left cursor" key serves to move the x axis left (boxes 62-9 and 62-10), the "right cursor" key moves the x axis right (boxes 62-11 and 62-12), the "up cursor key moves the y axis upwardly (boxes 62-13 and 62-14) and the "down cursor" key moves the y axis downwardly (boxes 62-15 and 62-16).
- Finally, the user has the option of regenerating the screen simply by depressing the "HOME" key (boxes 62-17 and 62-18), or exiting the subroutine by depressing the "ESCAPE" key (box 62-19).
- The insp_cmd() subroutine allows the user to vary the display mode between short, long, angle, and inspection modes, and regenerate the two-dimensional map accordingly, as discussed above. The program assigns a numerical entry corresponding to each different mode, as follows: if the numeral "1" is entered, the two-dimensional map is regenerated in the angle mode (boxes 62-20 and 62-21); if the numeral "2" is entered, the map is regenerated as the short mode (boxes 62-22 and 62-23); if the numeral "3" is entered, the map is regenerated in the long mode (boxes 62-24 and 62-25); and if the numeral "4" is entered, the map is regenerated in the inspection mode (boxes 62-26 and 62-27).
- This subroutine also assigns functions to various letters of the alphabet to provide additional features which may be helpful to the user of the system. As illustrated, the selection of the letter "R" calls a report_reject subroutine which generates the defect summary shown in Figure 5 (boxes 62-28 and 62-29). Selection of the letters "S", "F", or "V" varies the speed of the cursor movement from slow, to fast, to very fast, respectively (boxes 62-30 through 62-35).
- Selection of the letter "P" instructs the computer to pot the two-dimensional display map on an attached plotter (boxes 62-36 and 62-37). If the user desires to change the threshold value to increase or decrease the amount of information being displayed, the letter "T" may be selected (boxes 62-38 and 62-39). Entry of the letter "M"" allows the user to select a completely different analysis algorithm, assign a corresponding channel half width value (ch_half_width), and regenerate the two-dimensional display map in accordance with the new algorithm (boxes 62-40 and 62-41).
- The user of
system 10 can quickly check the high pass and low pass filter values for the digital filters included in the chart recorder output by entering either the letter "H" or "L", respectively (boxes 62-42 through 62-45). Finally, by entering the letter "Z", the user can utilize the screen zooming feature discussed above, wherein the first "Z" entry marks the initial longitudinal boundary and the second "Z" entry marks the final longitudinal boundary for enlarged view (boxes 62-46 and 62-47). - In order to avoid confusion and erroneous displays, the insp_cmd() subroutine automatically checks the positions of the x and y axes to insure that both are within the range of the two-dimensional display shown on the screen (box 62-48). In the event that one or more of the previously described functions has been performed, thus temporarily removing the two-dimensional display map, the cursor is then redisplayed as the intersection of x and y axes (box 62-49).
- The graph_insp subroutine referenced at box 62-6 is illustrated as
flowchart 64 in Figure 10. Additional parameters must first be initialized (box 64-1) in order for the computer to perform the correlating functions of this subroutine. After the necessary parameters have been established, the axial, or longitudinal, display positions on the CRT screen are correlated to the defect data points contained in the data records for purposes of the screen zooming feature discussed above (box 64-2). After this correlation, or mapping, procedure has begun, the map_2d subroutine is called upon to display the data on the CRT screen (box 64-3) while the correlation continues until completed (box 64-4). - The map_2d subroutine referred to above is illustrated as
flowchart 66 in Figures 11a and b. As with certain other subroutines, this portion of the program requires that new parameters be initialized before any additional processing is performed (box 66-1). The processing functions of this subroutine are essentially contained within a logic loop, wherein the computer first determines if all the records are being displayed (box 66-2) and, if so, the maximum defect value for each of the twodetector head segments 13 is displayed on the screen (box 66-8). - If the computer determines that all records are not yet being displayed, it proceeds by first obtaining additional position information from the data records (box 66-3). The diff subroutine is next called upon to apply suitable algorithms to the raw data, thus generating four sets of distinctive values, with each set corresponding to one of the four display modes, short, long, angle, or inspection (box 66-4). The longitudinal and circumferential location for each of the forty-eight detector channels are next determined by correlating
signals - The predetermined threshold value for the particular display mode selected is compared to each numerical value comprising
defect signal 24 and, if the signal value is greater than the threshold value, a pixel is displayed on the CRT screen for the maximum defect value for each longitudinal position along the length oftubular member 22, as displayed on the two-dimensional map (boxes 66-6 and 66-7). If, on the other hand, the defect signal value is less than the threshold value, the signal value ignored and the logic loop repeated. - The final key portion of the preferred program for this invention is the diff subroutine identified by
flowchart 68 in Figure 12. Since the function of this program is to process all numerical values contained withindefect signal 24, it is imperative that the gain setting be matched for each of the forty-eight channel corresponding to the forty-eight separate flux detectors (box 68-1). The computer then performs one of five possible calculations depending upon the channel half width selected by the user. - If the selection is "0", the voltages for all channels are calculated for each discrete solid segment of tubular member 22 (boxes 68-2 ad 68-3). If, however, a channel half width of 1, 3, 25, or 26 is selected, the voltage values are processed according to the angle algorithm, short algorithm, long algorithm, or inspection algorithm, respectively, to generate the distinctive values needed to produce the four different display modes discussed above (boxes 68-4 and 68-11).
- The precise programming steps required to reproduce the preferred embodiment of the present invention will become apparent to those skilled in the art upon disclosure of the flowchart and the remainder of the specification set forth herein.
Claims (41)
- A method of detecting and mapping defects in a tubular member (22) comprising:characterized byscanning said tubular member by detecting means monitoring a plurality of discrete segments extending over the entire length of said tubular member (22) to generate a signal (24) which may include signal portions representing a defect in at least one discrete segment of said tubular member (22),generating a longitudinal signal (28) indicating the longitudinal position of said at least one discrete segment of said tubular member (22);generating a circumferential signal (26a, 26b) indicating the circumferential position of said at least one discrete segment of said tubular member (22);correlating said defect (24), longitudinal (28), and circumferential signals (24, 28, 26a, 26b) to obtain defect data, said defect data including the longitudinal position and circumferential position of said defect in said at least one discrete segment of said tubular member (22),wherein defects of said selected defect type are displayed as identification, images emphasizing said selected defect type at the expense of other defect types.processing said defect data in order to classify said defects into different types in dependence on the shape, length and angular orientation, thereof, andsupplying said processed defect data to a display means (20) for selectively displaying the presence and the position of a selected one of said different types of defects on a two-dimensional map (44), said map including:a first axis (46) corresponding to the length of said tubular member (22),a second axis (48) corresponding to the circumference of said tubular member (22),
- The method of claim 1 wherein as an additional facility the relative number and positions of said identification images with respect to said first and second axes (46, 48) indicate the location of all of said defect types (50a, 50b... ) on said tubular member (22) and further indicate said shape, length, and angular orientation of each of said plurality of defects relative to said tubular member (22) and to each other of said plurality of defects (50a, 50b,...).
- The method of claim 1 or 2 wherein said defect signal, said longitudinal signal, and said circumferential signals comprise analog electrical signals, said method further characterized by the step of displaying simultaneously said amplitude values of said at least one defect signal (50a, 50b,...) separately from said two dimensional map (44) of said plurality of defects.
- The method of claim 1 or 2 wherein said characteristics are displayed in a table (Figure 5) having at least four portions, characterized by:a first portion for displaying the longitudinal position of said defect,a second portion for displaying the circumferential position of said defect,a third portion for displaying the longitudinal length of said defect, anda fourth portion for displaying the angular orientation of said defect.
- The method of any of claims 1 to 3 wherein the step of displaying at a display means is characterized by displaying said defect data on a visual monitor (20a) operative to selectively receive continuously generated electronic pulses and convert said electronic pulses to visual images.
- The method of any of claims 1 to 3 wherein the step of displaying is characterized by displaying said defect on a chart recorder (20b).
- The method of any of claims 1 to 3 wherein the step of displaying is characterized by plotting said defect data on a plotter (20c).
- The method of any of claims 1 to 3 wherein the step of displaying said defect data is characterized by printing said defect data on a printer (20d).
- The method of any of claims 1 to 3 wherein said amplitude of said at least one defect signal is displayed on a display (52) separate from said two dimensional map (44) but which is axially aligned with said two-dimensional map (44).
- The method of claim 1 wherein said two dimensional map (44) being defined by a plurality of pixels, and wherein each of said at least one defect signal represents a pixel on said two-dimensional map (44).
- The method of claim 1 characterized by said two dimensional map (44) being defined by a plurality of pixels, and wherein each of said at least one defect signal constitutes a pixel on said two-dimensional map (44), and represents the presence of said defect in a particular discrete segment of said tubular member (22).
- The method of claim 1 wherein said plurality of defects include a plurality of defects of differing lengths, only a subset of defects of predetermined length value are emphasized on said two dimensional map (44) and all other defects are not emphasized.
- The method of Claim 1 wherein said plurality of defects (50a, 50b,...) include a plurality of defects (50a, 50b,...) of differing lengths, and wherein said step of displaying is characterized by:
selectively displaying the presence of said defects in the following alternative modes:a long defect mode (Figure 4d) in which only defects having a length above a predetermined length value are emphasized on said two dimensional map (44) and all other defects are not emphasized; anda short defect mode (Figure 4b) in which only defects having a shortness below a predetermined length value are emphasized on said two-dimensional map (44) and all other defects are not emphasized. - The method of claim 1 or 13 wherein said plurality of defects include a subset of angular defects out of axial alignment with the longitudinal central axis of said tubular member (22) by a predetermined angular threshold, wherein the step of displaying is characterized by selectively displaying the presence of said defect includes an angular defect mode (Figure 4c) in which only said subset of angular defects out of axial alignment with said central longitudinal axis by said predetermined angular value are emphasized on said two-dimensional map (44) and all other defects are not emphasized.
- The method of claim 1 or any of claims 12 to 14 wherein said plurality of defects is displayed in a full defect mode (Figure 4a) in which said first subset of long defects, said second subset of short defects, and said third subset of angular defects are simultaneously displayed on said two-dimensional map (44).
- The method of Claim 1 wherein said step of generating at least one defect signal is characterized by:generating a magnetic flux in said tubular member (22);detecting with said magnetic flux in a plurality of discrete solid members of said tubular member (22);producing from said detected magnetic flux at least one signal (24) representing a defect in at least one discrete solid segment of said tubular member (22) for each of said plurality of defects, each of said at least one defect signal having an amplitude value; andrecording said amplitude value for each of said at least one defect signal.
- The method of claim 1 or 16 wherein said step of generating at least one defect signal is characterized by: recording into a memeory of a computer (18) an amplitude value for each of said at least one defect signal; and distinguishing with said computer (18) said plurality of differing types of defects.
- The method of Claim 16 or 17 wherein said step of displaying further comprises:selecting at least one signal threshold (54);comparing said at least one signal threshold (54) to said amplitude value of each of said at least one defect signal to create a subset of datapoints ready for display; anddisplaying only said subset of datapoints to indicate the presence of said plurality of defects on said two-dimensional map (44).
- The method of Claim 1 wherein said step of displaying comprises:selecting with a computer (18) at least one signal threshold (54);comparing with said computer (18) said at least one signal threshold (54) to a amplitude value of each of said at least one defect signal to create a subset of data-points ready for display; anddisplaying only said subset of datapoints to indicate the presence of said plurality of defects on said two-dimensional map (44).
- The method of of any of claims 1 to 3 or 5 to 19 further characterized by selectively displaying only a portion of said two-dimensional map (44).
- The method of claim 20 further characterized by displaying and simultaneously enlarging said portion of said two dimensional map (44).
- The method of Claim 16 wherein said step of displaying is characterized by:selecting at least one signal threshold (54);comparing said at least one signal threshold (54) to said amplitude value of each at least one defect signal to create a subset of datapoints ready for display; and displaying said subset of data-points to indicate the presence of said plurality of defects on said two-dimensional map (44).
- The method of claim 1 characterized by the steps of:detecting the presence of a plurality of discrete points on said defect;comparing said discrete points to a common frame of reference, thus establishing the relative position of each of said discrete points with respect to the remainder of said plurality of discrete points; andcorrelating said relative position of each of said discrete points with the longitudinal orientation of said tubular member, thus determining the angular orientation of said plurality of discrete points with respect to said longitudinal axis of said tubular member.
- The method of Claim 23 further characterized by the step of displaying at a display means said angular orientation of said plurality of discrete points.
- The method of Claim 23 wherein said step of detecting the presence of a plurality of discrete points on said defect is characterized by generating a plurality of signals indicative of said plurality of discrete points, wherein each of said discrete points is represented by one corresponding signal; and processing said signals to establish the position of each of said discrete points indicated by each of said signals.
- The method of Claim 23 wherein said step of comparing said discrete points to a common frame of reference is characterized by:establishing the point in time at which each of said signals indicates the presence of a corresponding discrete point;measuring the time lag separating the detection of each adjacent discrete point on said defect; andapplying said time lag to calculate the relative position of each of said adjacent discrete points.
- The method of Claim 23 further comprising the steps of generating a time signal, wherein said step of detecting the presence of a plurality of discrete points on said defect is characterized by:generating a first signal indicative of a first discrete point;generating a second signal indicative of a second discrete point; andsaid step of comparing said discrete points to a common frame of reference comprises calculating the time lag between said first and second signals.
- An apparatus for detecting and mapping defects in a tubular member (22) comprising :wherein defects of said selected defect type are displayed as identification images emphasizing said selected defect type at the expense of other defect types.scanning means arranged to scan said tubular member by detecting means monitoring a plurality of discrete segments extending over the entire length of said tubular member,means (12) arranged to generate signals (24) which may include signal portions representing a defect in at least one discrete segment of said tubular member (22),means (16) arranged to generate a longitudinal signal (28) indicating the longitudinal position of said at least one discrete segment of said tubular member (22),means (14) arranged to generate a circumferential signal (26a, 26b) indicating the circumferential position of said at least one discrete segment of said tubular member (22),means arranged to correlate said defect, longitudinal, and circumferential signals (24, 28, 26a, 26b) to obtain defect data, said defect data including the longitudinal position and circumferential position of said defects in said at least one discrete segment of said tubular member (22); characterised byprocessing means arranged to process said defect data such as to classify said defects into different types in dependence on the shape, length and angular orientation thereof, anddisplay means (20) arranged to selectively display the presence and position of a selected one of said different types of defects based on said defect data on a two-dimensional map (44) said map including:a first axis (46) corresponding to the length of said tubular member (22);a second axis (48) corresponding to the circumference of said tubular member (22);
- The apparatus of claim 28 wherein said means for generating at least one defect signal comprise an electromagnetic inspection apparatus (12), characterized by:at least one driven coil for inducing a magnetic field in said discrete segment of said tubular member (22),at least one pick-up coil for detecting the magnetic field induced by said driven coil, andat least one magnetic flux detector, responsive to the variations in said flux caused by defects and generating a signal corresponding thereto.
- The apparatus of claim 28 wherein said means for generating a longitudinal signal characterized by:a generally rigid support member disposed adjacent said tubular member (22);a wheel (16) rotatably secured to said support member, wherein the outer perimeter of said wheel is in contact with the outer surface of said tubular member (22) while said apparatus is operating, such that longitudinal movement of said tubular member (22) relative to said apparatus causes corresponding rotational movement of said wheel (16); andsignal generating means communicating with said wheel for generating a signal (28) corresponding to the distance traveled by said wheel (16) along the outer surface of said tubular member (22).
- The apparatus of claim 28 wherein said means for generating a circumferential signal are characterized by sensing means for detecting the position of said defect signal generating means relative to said tubular member (22); and means for generating a signal indicating said relative position.
- The apparatus of Claim 28, characterized by:said defect signal generating means comprising a generally annularly-shaped, rotatable defect detector having an open interior of sufficiently large diameter to allow said tubular member (22) to pass axially therethrough,said defect detector (12) being rotatably mounted within said apparatus such that said tubular member (22) is passable through said open interior of said defect detector during rotation thereof; andsaid sensing means comprising:a position indicator (30) rigidly secured to said defect detector (12) and rotatable therewith,a stationary sensor (14), cooperating with said position indicator (30), for detecting each revolution of said defect detector (12) and generating a revolution signal indicative thereof;clock means for generating a time signal, and computing means (18) for receiving and correlating said revolution signal and said time signal, and selectively determining the circumferential position of said defect detector relative to said tubular member (22) at any given time.
- The apparatus of Claim 28, characterized by said means for correlating said defect, longitudinal, and circumferential signals being a computer.
- The apparatus of Claim 28, characterized by said display means comprising at least one of the following:(a) a CRT screen (20a);(b) a chart recorder (20b);(c) a plotter (20c); or(d) a printer (20d)-
- The apparatus of Claim 28 wherein said display means (20) is operable in a plurality of display modes, each for displaying a different type of defect.
- The apparatus of Claim 28, characterized by said display means displaying said defects in a length defect mode (Figure 4d) in which only a subset of defects of predetermined length value are emphasized and all other defects are not emphasized.
- The apparatus of to Claim 28 wherein said display means display defects in the following alternative modes: a long defect mode (Figure 4d) in which only defects having a length above a predetermined length value are emphasized and all other defects are not emphasized; and a short defect mode (Figure 4b) in which only defects having a length below a predetermined shortness value are emphasized and all other defects are not emphasized.
- The apparatus of Claim 28 or 37 wherein said display means display said defects additionally in a full defect mode (Figure 4a) in which said first subset of long defects, said second subset of short defects, and said third subset of angular defects are simultaneously displayed on said two-dimensional map (44).
- The apparatus of claim 28 characterized by:sensor means arranged to detecte the presence of a plurality of discrete points on said defect;means cooperating with said sensor means for generating at least one signal indicative of said plurality of discrete points; andmeans arranged to process (18) said at least one signal to determine the relative position of each of said plurality of discrete points with respect to said longitudinal axis of said tubular member (22), wherein said relative position of each of said plurality of discrete points corresponds to the angular orientation of said defect with respect to said longitudinal axis.
- The apparatus of Claim 39 further comprising clock means for generating a time signal, characterized by said processing means comprising a computer (18) for receiving and correlating said time signal and said at least one signal indicative of said plurality of discrete points, wherein said relative position of each of said plurality of discrete points is determined by establishing the time lag within said at least one signal indicative of adjacent discrete points and applying said time lag to calculate the longitudinal and circumferential spacing between said adjacent discrete points.
- The apparatus of Claim 39 further comprising clock means for generating a time signal, characterized by said sensor means comprises at least one first sensor for detecting the position of a first discrete point, and at least one second sensor for detecting the position of a second discrete point; and said signal generating means comprises a first means for generating a first signal indicative of said first discrete point, and second means for generating a second signal indicative of said second discrete point; wherein said processing means measures the time lag between said first and second signals, thus determining the relative positions of said first and second discrete points with respect to said longitudinal axis.
Applications Claiming Priority (2)
| Application Number | Priority Date | Filing Date | Title |
|---|---|---|---|
| US42413689A | 1989-10-19 | 1989-10-19 | |
| US424136 | 1989-10-19 |
Publications (3)
| Publication Number | Publication Date |
|---|---|
| EP0423753A1 EP0423753A1 (en) | 1991-04-24 |
| EP0423753B1 EP0423753B1 (en) | 1995-01-11 |
| EP0423753B2 true EP0423753B2 (en) | 1999-12-22 |
Family
ID=23681598
Family Applications (1)
| Application Number | Title | Priority Date | Filing Date |
|---|---|---|---|
| EP90119902A Expired - Lifetime EP0423753B2 (en) | 1989-10-19 | 1990-10-17 | Method and apparatus for displaying defects in tubular members |
Country Status (6)
| Country | Link |
|---|---|
| EP (1) | EP0423753B2 (en) |
| AR (1) | AR242664A1 (en) |
| AT (1) | ATE117084T1 (en) |
| CA (1) | CA2027968C (en) |
| DE (1) | DE69015959T3 (en) |
| MX (1) | MX173281B (en) |
Cited By (1)
| Publication number | Priority date | Publication date | Assignee | Title |
|---|---|---|---|---|
| US7349083B2 (en) | 2004-07-21 | 2008-03-25 | The Boeing Company | Rotary borescopic optical dimensional mapping tool |
Families Citing this family (7)
| Publication number | Priority date | Publication date | Assignee | Title |
|---|---|---|---|---|
| US5315234A (en) * | 1992-04-03 | 1994-05-24 | General Electric Company | Eddy current device for inspecting a component having a flexible support with a plural sensor array |
| US5442286A (en) * | 1993-09-22 | 1995-08-15 | General Electric Company | Eddy current array inspection device |
| JP3294125B2 (en) * | 1996-11-14 | 2002-06-24 | 山陽特殊製鋼株式会社 | Automatic material removal method for long materials |
| US6359434B1 (en) * | 1998-09-30 | 2002-03-19 | Hydroscope Cananda Inc. | Method and system for determining pipeline circumferential and non-circumferential wall loss defects in a water pipeline |
| DE102017101443A1 (en) * | 2017-01-25 | 2018-07-26 | Mavis Cable Service GmbH | Inspection unit and method for inspecting a rope |
| CN114354740B (en) * | 2022-03-09 | 2022-05-31 | 成都熊谷油气科技有限公司 | Pipeline detection system |
| CN115308297A (en) * | 2022-08-05 | 2022-11-08 | 国家石油天然气管网集团有限公司 | Defect signal quantization method and system based on circumferential excitation device |
Family Cites Families (4)
| Publication number | Priority date | Publication date | Assignee | Title |
|---|---|---|---|---|
| GB1056765A (en) * | 1962-09-15 | 1967-01-25 | Akademia Gorniczo Hutnicza Dzi | A magnetic crack detection device for examining elongated objects such as ropes, rodsand steel pipes |
| US3593122A (en) * | 1969-03-27 | 1971-07-13 | Amf Inc | Method and apparatus for identifying hardspots in magnetizable material |
| SE347356B (en) * | 1970-03-20 | 1972-07-31 | Essem Metotest Ab | |
| US4755753A (en) * | 1986-07-23 | 1988-07-05 | General Electric Company | Eddy current surface mapping system for flaw detection |
-
1990
- 1990-10-17 DE DE69015959T patent/DE69015959T3/en not_active Expired - Fee Related
- 1990-10-17 EP EP90119902A patent/EP0423753B2/en not_active Expired - Lifetime
- 1990-10-17 MX MX2287090A patent/MX173281B/en unknown
- 1990-10-17 AT AT90119902T patent/ATE117084T1/en not_active IP Right Cessation
- 1990-10-18 CA CA002027968A patent/CA2027968C/en not_active Expired - Lifetime
- 1990-10-19 AR AR90318142A patent/AR242664A1/en active
Cited By (1)
| Publication number | Priority date | Publication date | Assignee | Title |
|---|---|---|---|---|
| US7349083B2 (en) | 2004-07-21 | 2008-03-25 | The Boeing Company | Rotary borescopic optical dimensional mapping tool |
Also Published As
| Publication number | Publication date |
|---|---|
| ATE117084T1 (en) | 1995-01-15 |
| EP0423753A1 (en) | 1991-04-24 |
| DE69015959T2 (en) | 1995-05-11 |
| AR242664A1 (en) | 1993-04-30 |
| MX173281B (en) | 1994-02-14 |
| EP0423753B1 (en) | 1995-01-11 |
| DE69015959D1 (en) | 1995-02-23 |
| CA2027968A1 (en) | 1991-04-20 |
| CA2027968C (en) | 2002-01-01 |
| DE69015959T3 (en) | 2000-05-31 |
Similar Documents
| Publication | Publication Date | Title |
|---|---|---|
| US5030911A (en) | Method and apparatus for displaying defects in tubular members on a two-dimensional map in a variety of display modes | |
| US4763274A (en) | Machine implemented analysis eddy current data | |
| US5043663A (en) | Method and apparatus for detecting angular defects in a tubular member | |
| US5914596A (en) | Coiled tubing inspection system | |
| EP2835635B1 (en) | Method and apparatus for non-destructive testing | |
| US5943632A (en) | Method and apparatus for detecting and displaying irregularities in ferrous pipe | |
| US5671155A (en) | Method and apparatus for detecting and displaying irregularities in ferrous pipe | |
| CA2548938C (en) | Apparatus and method for detection of defects using flux leakage techniques | |
| CA1208291A (en) | Method and apparatus for detecting flaws in tubular metallic members | |
| EP1625379A2 (en) | Method for inspection of metal tubular goods | |
| EP0423753B1 (en) | Method and apparatus for displaying defects in tubular members | |
| FR2602053A1 (en) | DEVICE AND METHOD FOR NON-DESTRUCTIVE TESTING OF A WORKPIECE BY MEASURING THE IMPEDANCE OF CURRENT FOUCAULT | |
| EP0211905B1 (en) | Classification of steel | |
| US5473247A (en) | Apparatus for discriminating defects in top and bottom surfaces of objects | |
| WO1998016842A1 (en) | Coiled tubing inspection system | |
| CA2351738C (en) | Method and apparatus for displaying defects in tubular members | |
| AU589404B2 (en) | Classification of steel | |
| US2994032A (en) | Inspection system and method | |
| Udpa et al. | WINSAS: A New tool for Enhancing the Performance of Eddy Current Inspection of Aging Aircraft Wheels | |
| Mook et al. | Low frequency eddy current arrays with video clock | |
| Data | Acquisition and Evaluation System | |
| RU2086972C1 (en) | Universal magnetic flaw detector | |
| Sengupta | Defect characterisation in Austenitic stainless steel plate weld by multimulti frequency Eddy current testing technique | |
| JPS6082958A (en) | Eddy current detection of flaw on roll surface | |
| MXPA99003556A (en) | Coiled tubing inspection system |
Legal Events
| Date | Code | Title | Description |
|---|---|---|---|
| PUAI | Public reference made under article 153(3) epc to a published international application that has entered the european phase |
Free format text: ORIGINAL CODE: 0009012 |
|
| 17P | Request for examination filed |
Effective date: 19901228 |
|
| AK | Designated contracting states |
Kind code of ref document: A1 Designated state(s): AT BE CH DE DK ES FR GB GR IT LI LU NL SE |
|
| 17Q | First examination report despatched |
Effective date: 19930125 |
|
| RAP1 | Party data changed (applicant data changed or rights of an application transferred) |
Owner name: TUBOSCOPE VETCO INTERNATIONAL INC. |
|
| GRAA | (expected) grant |
Free format text: ORIGINAL CODE: 0009210 |
|
| AK | Designated contracting states |
Kind code of ref document: B1 Designated state(s): AT BE CH DE DK ES FR GB GR IT LI LU NL SE |
|
| PG25 | Lapsed in a contracting state [announced via postgrant information from national office to epo] |
Ref country code: BE Effective date: 19950111 Ref country code: LI Effective date: 19950111 Ref country code: GR Free format text: LAPSE BECAUSE OF FAILURE TO SUBMIT A TRANSLATION OF THE DESCRIPTION OR TO PAY THE FEE WITHIN THE PRESCRIBED TIME-LIMIT Effective date: 19950111 Ref country code: DK Effective date: 19950111 Ref country code: CH Effective date: 19950111 Ref country code: AT Effective date: 19950111 |
|
| REF | Corresponds to: |
Ref document number: 117084 Country of ref document: AT Date of ref document: 19950115 Kind code of ref document: T |
|
| REF | Corresponds to: |
Ref document number: 69015959 Country of ref document: DE Date of ref document: 19950223 |
|
| ITF | It: translation for a ep patent filed | ||
| PG25 | Lapsed in a contracting state [announced via postgrant information from national office to epo] |
Ref country code: SE Effective date: 19950411 |
|
| ET | Fr: translation filed | ||
| REG | Reference to a national code |
Ref country code: CH Ref legal event code: PL |
|
| PGFP | Annual fee paid to national office [announced via postgrant information from national office to epo] |
Ref country code: LU Payment date: 19950901 Year of fee payment: 6 |
|
| PGFP | Annual fee paid to national office [announced via postgrant information from national office to epo] |
Ref country code: ES Payment date: 19951009 Year of fee payment: 6 |
|
| PLBI | Opposition filed |
Free format text: ORIGINAL CODE: 0009260 |
|
| 26 | Opposition filed |
Opponent name: FORSCHUNGSZENTRUM KARLSRUHE GMBH, TECHNIK UND UMWE Effective date: 19951006 |
|
| NLR1 | Nl: opposition has been filed with the epo |
Opponent name: FORSCHUNGSZENTRUM KARLSRUHE GMBH, TECHNIK UND UMWE |
|
| PLBF | Reply of patent proprietor to notice(s) of opposition |
Free format text: ORIGINAL CODE: EPIDOS OBSO |
|
| PG25 | Lapsed in a contracting state [announced via postgrant information from national office to epo] |
Ref country code: LU Free format text: LAPSE BECAUSE OF NON-PAYMENT OF DUE FEES Effective date: 19961017 |
|
| PLBO | Opposition rejected |
Free format text: ORIGINAL CODE: EPIDOS REJO |
|
| APAC | Appeal dossier modified |
Free format text: ORIGINAL CODE: EPIDOS NOAPO |
|
| APAE | Appeal reference modified |
Free format text: ORIGINAL CODE: EPIDOS REFNO |
|
| APAC | Appeal dossier modified |
Free format text: ORIGINAL CODE: EPIDOS NOAPO |
|
| APAC | Appeal dossier modified |
Free format text: ORIGINAL CODE: EPIDOS NOAPO |
|
| PLAW | Interlocutory decision in opposition |
Free format text: ORIGINAL CODE: EPIDOS IDOP |
|
| PUAH | Patent maintained in amended form |
Free format text: ORIGINAL CODE: 0009272 |
|
| STAA | Information on the status of an ep patent application or granted ep patent |
Free format text: STATUS: PATENT MAINTAINED AS AMENDED |
|
| 27A | Patent maintained in amended form |
Effective date: 19991222 |
|
| AK | Designated contracting states |
Kind code of ref document: B2 Designated state(s): AT BE CH DE DK ES FR GB GR IT LI LU NL SE |
|
| NLR2 | Nl: decision of opposition | ||
| NLR3 | Nl: receipt of modified translations in the netherlands language after an opposition procedure | ||
| ITF | It: translation for a ep patent filed | ||
| ET3 | Fr: translation filed ** decision concerning opposition | ||
| PG25 | Lapsed in a contracting state [announced via postgrant information from national office to epo] |
Ref country code: ES Free format text: LAPSE BECAUSE OF FAILURE TO SUBMIT A TRANSLATION OF THE DESCRIPTION OR TO PAY THE FEE WITHIN THE PRESCRIBED TIME-LIMIT Effective date: 20000402 |
|
| REG | Reference to a national code |
Ref country code: GB Ref legal event code: IF02 |
|
| PGFP | Annual fee paid to national office [announced via postgrant information from national office to epo] |
Ref country code: FR Payment date: 20021030 Year of fee payment: 13 |
|
| PGFP | Annual fee paid to national office [announced via postgrant information from national office to epo] |
Ref country code: NL Payment date: 20021031 Year of fee payment: 13 |
|
| PG25 | Lapsed in a contracting state [announced via postgrant information from national office to epo] |
Ref country code: NL Free format text: LAPSE BECAUSE OF NON-PAYMENT OF DUE FEES Effective date: 20040501 |
|
| PG25 | Lapsed in a contracting state [announced via postgrant information from national office to epo] |
Ref country code: FR Free format text: LAPSE BECAUSE OF NON-PAYMENT OF DUE FEES Effective date: 20040630 |
|
| NLV4 | Nl: lapsed or anulled due to non-payment of the annual fee |
Effective date: 20040501 |
|
| REG | Reference to a national code |
Ref country code: FR Ref legal event code: ST |
|
| APAH | Appeal reference modified |
Free format text: ORIGINAL CODE: EPIDOSCREFNO |
|
| PGFP | Annual fee paid to national office [announced via postgrant information from national office to epo] |
Ref country code: GB Payment date: 20051013 Year of fee payment: 16 |
|
| PG25 | Lapsed in a contracting state [announced via postgrant information from national office to epo] |
Ref country code: IT Free format text: LAPSE BECAUSE OF NON-PAYMENT OF DUE FEES;WARNING: LAPSES OF ITALIAN PATENTS WITH EFFECTIVE DATE BEFORE 2007 MAY HAVE OCCURRED AT ANY TIME BEFORE 2007. THE CORRECT EFFECTIVE DATE MAY BE DIFFERENT FROM THE ONE RECORDED. Effective date: 20051017 |
|
| PGFP | Annual fee paid to national office [announced via postgrant information from national office to epo] |
Ref country code: DE Payment date: 20051130 Year of fee payment: 16 |
|
| PG25 | Lapsed in a contracting state [announced via postgrant information from national office to epo] |
Ref country code: DE Free format text: LAPSE BECAUSE OF NON-PAYMENT OF DUE FEES Effective date: 20070501 |
|
| GBPC | Gb: european patent ceased through non-payment of renewal fee |
Effective date: 20061017 |
|
| PG25 | Lapsed in a contracting state [announced via postgrant information from national office to epo] |
Ref country code: GB Free format text: LAPSE BECAUSE OF NON-PAYMENT OF DUE FEES Effective date: 20061017 |
|
| PG25 | Lapsed in a contracting state [announced via postgrant information from national office to epo] |
Ref country code: ES Free format text: LAPSE BECAUSE OF FAILURE TO SUBMIT A TRANSLATION OF THE DESCRIPTION OR TO PAY THE FEE WITHIN THE PRESCRIBED TIME-LIMIT Effective date: 19961031 |