EP0390339B1 - Path measurement and analysis tool for evaluating the performance of software designs - Google Patents
Path measurement and analysis tool for evaluating the performance of software designs Download PDFInfo
- Publication number
- EP0390339B1 EP0390339B1 EP90302179A EP90302179A EP0390339B1 EP 0390339 B1 EP0390339 B1 EP 0390339B1 EP 90302179 A EP90302179 A EP 90302179A EP 90302179 A EP90302179 A EP 90302179A EP 0390339 B1 EP0390339 B1 EP 0390339B1
- Authority
- EP
- European Patent Office
- Prior art keywords
- module
- program
- modules
- path
- design
- Prior art date
- Legal status (The legal status is an assumption and is not a legal conclusion. Google has not performed a legal analysis and makes no representation as to the accuracy of the status listed.)
- Expired - Lifetime
Links
Images



Classifications
-
- G—PHYSICS
- G06—COMPUTING OR CALCULATING; COUNTING
- G06F—ELECTRIC DIGITAL DATA PROCESSING
- G06F11/00—Error detection; Error correction; Monitoring
- G06F11/30—Monitoring
- G06F11/34—Recording or statistical evaluation of computer activity, e.g. of down time, of input/output operation ; Recording or statistical evaluation of user activity, e.g. usability assessment
-
- G—PHYSICS
- G06—COMPUTING OR CALCULATING; COUNTING
- G06F—ELECTRIC DIGITAL DATA PROCESSING
- G06F11/00—Error detection; Error correction; Monitoring
- G06F11/36—Prevention of errors by analysis, debugging or testing of software
- G06F11/3604—Analysis of software for verifying properties of programs
- G06F11/3612—Analysis of software for verifying properties of programs by runtime analysis
Definitions
- the present invention generally relates to the development of software programs, and is more specifically directed to a novel programming tool which enables a software engineer to evaluate the expected performance of a program and isolate potential performance problems during an early stage of program development.
- a typical life cycle in the development of a computer program includes the initial steps of analyzing the problem to be solved by the program and designing the overall structure of the program. After the general structure of the program has been designed, it is then constructed, or coded, after which it undergoes a period of testing and debugging. Finally, after the program has been successfully tested, it is released for general use.
- One difficulty associated with this traditional approach to the development of software is the fact that it does not readily enable design defects to be recognized until substantially all of the work necessary to create the program has been completed. In other words, in the past it has always been necessary to construct the code for the program before it could be tested for the efficiency of its operation. Thus, once the code had been written and the program run during the testing phase, if unsatisfactory performance was detected it was necessary to return to the design phase to restructure the program, and then rewrite the code to implement the design changes.
- the types of mistakes which are most expensive to correct are those which occur in the analysis and design phases of the software development cycle.
- one of the factors which significantly influences the performance of a program is the lengths of the paths in the structure of the program that are followed to carry out a particular task.
- the length of the path is typically defined in terms of the number of transitions from module to module which occur as the program proceeds from an initial module to the final node in the path which represents completion of the task. As a path length becomes longer, it typically takes the program longer to execute the task, thereby reducing the efficiency of the program.
- Another factor which influences the performance of the program is the efficiency of a particular module which may be executed often by being called many times.
- Structured Design one popular methodology that is used in the development of software is known as Structured Design. Basically, this methodology involves breaking a task down into smaller and smaller functional units. Through this approach, repeatable and more predictable results can be obtained in software development. However, since the structured design approach promotes functional decomposition and small module sizes, it can result in longer path lengths. As a result, the performance of the program could be less than optimal when this design methodology is employed.
- GPAS Graphic Performance Analysis System
- the invention enables expected efficiency and performance of a program design to be evaluated prior to coding. It is particularly designed to work with the results of the Structured Design approach to software development. Basically, conventional software used in the implementation of the Structured Design approach provide a database which includes a specification for each module (functional element) in the design, as well as the overall relationship of the modules to one another. Utilizing this information, the invention determines every possible path that can be followed by the implementation of the program. From these determinations, reports are generated which identify the longest paths in the program, and hence the sources of potential "bottlenecks" in the performance of the program.
- time that would be required to follow each path can be determined on the basis of weighting factors assigned to the various modules.
- the modules which are called most often in the implementation of the program can be identified and called to the program developer's attention as program elements which may need to be most closely reviewed for possible optimization.
- the user can also create various hypothetical situations and evaluate their effect on the efficiency of the program.
- the invention enables the program developer to identify and correct some types of design deficiencies before any coding of the program ever takes place, thereby significantly reducing the cost and effort required to produce a program which operates with optimum efficiency.
- the first step involves a Structured Analysis 10 of the basic objectives of the software. Generally, this phase results in an outline of the program user's requirements for the program. Once these requirements have been identified, a Structured Design approach 12 is employed to define the tasks to be carried out by the software. When these tasks have been designed with sufficient particularity, actual coding of the program takes place, at step 14. After the coding phase, the program undergoes a testing and evaluation phase 16.
- testing phase limitations in the performance of the program will be recognized. For example, tasks which are not completed in a specified period of time will be identified.
- the software development process returns to the design phase 12, where the design is revised to reduce or eliminate the performance bottlenecks.
- additional coding 14 must take place, which is followed up by further testing and evaluation steps 16.
- the closed loop process of designing, coding, and testing might go through several iterations before the program finally operates at a satisfactory level. Once this point has been reached, the program is then released for distribution at step 18.
- a software development cycle that employs the techniques of the present invention begins with an analysis of the functions to be performed by the program, preferably using the Structured Analysis approach. This phase is followed by the design phase 12 for the program, again preferably using a Structured Design technique.
- the software tools that are employed in accordance with this technique generate a database containing information that can be used to evaluate the overall efficiency of the design, in accordance with the present invention.
- Structured Design is a well known method that is conventionally employed by software engineers, and therefore will not be described herein. For a detailed description of this design approach, reference is made to The Practical Guide to Structured Systems Design by Meilir Page-Jones, published by Yourdon Press, New York, 1980.
- an evaluation 20 of the design takes place immediately following the completion of the design step 12, and prior to the coding phase 14.
- various inefficiencies in the design can be detected and called to the software engineer's attention.
- the evaluation step 20 can determine the lengths of the paths that must be followed during the operation of the program under development.
- the evaluation phase 20 can operate to identify modules (functional elements) in the program which are utilized most frequently and call these modules to the designer's attention as likely candidates for optimization, as well as provide other information which helps to isolate possible performance limitations.
- the software engineer can redesign the program to reduce or eliminate the possible inefficiencies. After the program has been redesigned, it can again be evaluated in accordance with the present invention, and further refined as necessary.
- the design evaluation step 20 provides an indication that the program structure meets a satisfactory performance level, the design can be presented to a programmer for the conventional steps of coding 14 and testing 16. Since the design evaluation helps to identify and reduce design inefficiencies prior to coding, the testing phase 16 is more likely to be concentrated on specific coding errors and the debugging of these errors. Coding errors are much easier and less expensive to correct than design mistakes, and hence the overall effort and time required to put the program in form for final release 18 could be significantly reduced, particularly for large and highly complex programs.
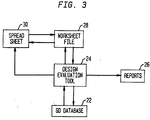
- FIG. 3 The general architecture of a system for performing the design evaluation phase 20 is illustrated in block diagram form in Figure 3.
- the tools which are employed to carry out the Structured Design approach to software engineering provide a database 22 which contains information describing the overall structure of the program as well as the functionality of its individual modules.
- the overall structure of the program is typically represented by means of a structure chart, an example of which is shown in Figure 4.
- the particular example represented in Figure 4 is for a relatively simple program, to facilitate an understanding of the invention and its application. It will be appreciated, however, that the present invention is particularly useful in connection with large and highly complex program designs, whose structure charts may typically be spread over a number of sheets and are therefore difficult to manually comprehend.
- each of the blocks which is labeled with a letter represents a module in the program.
- the lines interconnecting the modules identify the hierarchical relationships of the modules to one another, and serve to define the paths which are followed in the operation of the program to perform specific tasks.
- the database 22 shown in FIG. 3 also contains a specification for each individual module. This specification basically describes the inputs of a module, the function performed within the module, and the outputs of the module.
- a design evaluation tool 24 which operates in accordance with the present invention.
- the evaluation tool 24 determines the length of every possible path that can be followed during the running of the program. Basically, a path length is defined in terms of the number of transitions from an initial module to the final node in the path. Referring to the structure chart shown in Figure 4, the path from the initial module A to the terminal module M contains two transitions, from module A to C and then from module C to M. Thus, this path has a length of 2.
- the user specifies a particular module of interest, which can be the beginning module in a task execution path. Each possible path that can be followed from this initial module is then determined, and its length is measured. After all possible paths have been evaluated, the tool 24 generates reports 26 on a printer or a video display that are indicative of such evaluation. One such report can list all possible paths from the specified module, such as the root module A for example, and their corresponding lengths.
- Table 1 ALL PATHS Path Path Length A/B/E/G 3 A/B/E/H/I 4 A/B/E/H/J/L 5 A/B/E/H/K/R 5 A/B/F 2 A/C/M 2 A/C/N/O/K/R 5 A/C/N/P 3 A/C/N/Q 3 A ⁇ D/K/R 2 A/W/T/U/T/... *
- the paths can be listed in order of descending path length.
- the user can select whether those modules that are asynchronously activated, such as the module Q in the example of Figure 4 (as represented by the dashed line from module N to module Q), are to be ignored during the design evaluation. In such a case, the paths to those modules (path A/C/N/Q in the example of Figure 4 is such a path) would not be listed in the report shown in Table 1.
- the report can also identify paths that are recursive, that is, those which could result in endless loops.
- the last path listed in Table 1 is a recursive path because it extends from module T to module U and then loops from module U back to module T.
- This path is identified as a recursive path by repetition of the letter which identifies the first module in the recursive path, ellipses in the path listing, and an asterisk rather than a finite number in the "Path Length" column of the table.
- the report allows for any lexically included modules which are included in the structure chart.
- a lexically included module is actually a part of another module and therefore does not contribute to path length; however, it is convenient to illustrate it in the structure chart.
- the module D is a lexically included module which is actually a part of the module A. This is denoted in Figure 4 by a stylized carat on top of module D. Only one path includes module D -- this path extends from module A to D, from module D to K andfrom module K to R.
- This path which is the next-to-last path in Table 1, is shown ashaving a path length of 2 because the lexically included module D does not contribute tothe path length; this is indicated in Table 1 by a carat between the letters A and D in thepath description.
- Another type of report can list all excessive paths and path lengths.
- the software engineer specifies a length limit that should not be exceeded in the design, and the report would list only those paths that have a length greater than that which is specified. For example, if the software engineer specified a maximum path length of 4 for the program illustrated in Figure 4, the excessive path length report would be constituted as shown in the following Table 2: Table 2 EXCESSIVE PATHS Path Path Length A/B/E/H/J/L 5 A/B/E/H/K/R 5 A/C/N/O/K/R 5
- a third type of report can identify portions of the design and program that the engineer may wish to optimize.
- the user specifies a number which indicates the unique number of calls to any module or sub-path. The purpose of this number is to identify the modules and sub-paths that are called most frequently by other modules. For example, if the user specifies the number 3, the design evaluation tool 24 generates a report identifying all sub-paths that have at least 3 unique calling modules. For the example shown in Figure 4, such a report would appear as shown in the following Table 3: Table 3 OPTIMIZATION Path # Calls Calling Modules K/R 3 H,O,D
- the evaluation tool 24 can also provide reports which are based upon the anticipated time that would be required to complete certain tasks.
- the user assigns a relative weight to each module in the program structure.
- the weight assigned to a module is a number which represents, for example, the relative complexity of the module or the anticipated performance time of the module.
- These weights can be entered during the design phase 12 of the program and stored in the Structured Design database 22 as part of the module specification. Alternatively, the weights can be entered by the user during the design evaluation phase 20 and stored in a worksheet file 28, for example.
- the tool 24 will read the weights from the worksheet file and update the module specifications in the design database 22 automatically.
- a weight of 1, for example, can be associated with a relatively simple module, and each other module can be assigned a weight value which indicates the complexity of that module relative to that of the simple module. Thus, a module with a weight of 3 would be expected to take 3 times longer to execute than the simple module having a weight of 1. If the user fails to specify a weight for a given module, the tool 24 can assign a default weight (for example, a weight of 1) to such module.
- a timing report can be generated which identifies each path with its timing weight.
- the timing weight for a path would be the sum of the weights for each module in the path.
- the user can request that only those paths having a timing weight greater than a specified threshold level be identified.
- the software engineer can identity each module as being of a particular type and store this identification as part of the module specification in the structured design database 22.
- the user can also provide a file which contains a list of module types and a performance weight for each type.
- the evaluation tool 24 can then refer to this file and assign the appropriate performance weight to a module based upon its type.
- a probability can also be assigned to each invocation path that is conditionally activated (not always called).
- the paths from the module n to each of the modules o, p and q are conditional. This status is indicated by the diamond symbol at the output of the module n.
- a probability of its likelihood of being called can be assigned by the user.
- the weighting information can be factored into the expected performance of the program.
- a particularly useful report that can be generated with the design evaluation tool of the present invention is a performance report which identifies paths that should be of particular concern to the software engineer from the standpoint of possible performance problems.
- This type of report takes into account both path lengths and path weights and is comprised of three sections as shown in Table 4 below: Table 4 DESCENDING PATH LENGTHS Path Length Loops Conds A/B/E/H/J/L 5 2 2 A/B/E/H/K/R 5 2 1 A/C/N/O/K/R 5 1 1 A/B/E/H/I 4 2 1 DESCENDING PATH WEIGHTS Path Weight Loops Conds A/B/E/H/K/R 11.00 2 1 A/B/E/H/I 8.50 2 1 A/B/E/H/J/L 6.15 2 2 A/C/N/O/K/R 5.85 1 2 DESCENDING PATH LENGTHS & WEIGHTS Path Length Weight Loops Conds A/B/
- this report the user specifies how many paths are to be listed. This quantity is preferably expressed as a percentage of all the paths in the program. For example, if there are 40 paths in a program and a user specifies that 10% of the paths are to be listed, the report will list 4 paths.
- the first section of the report lists those paths which have the greatest lengths, in order of decreasing length, until the desired number of paths have been listed. It also lists the number of loops and conditionals for each path, and sorts paths of the same length in descending order of loops and conditionals, respectively.
- the second section lists those paths which have the greatest weights, in order of decreasing path weight, until the desired number of paths have been listed. Again, the number of loops and conditionals can be used as secondary and tertiary sorting criteria if two or more paths have the same weight.
- the third section represents a combination of the first two sections; both length and weight are listed.
- the sorting of the paths in this section is done in accordance with criteria selected by the software engineer.
- Table 4 the paths which are listed in the third section have been listed in ascending order of the sums of their ordinal positions in the first two sections.
- the ordinal position of the path A/B/E/H/K/R in the first section for example, is 2 and in the second section is 1; its ordinal sum is therefore 3.
- the ordinal position of the path A/B/E/H/J/L in the first section is 1 and in the second section is 3; its ordinal sum is therefore 4 and accordingly it is listed below the path A/B/E/H/K/R in the third section of the table.
- the user can decide whether paths that contain external library calls, such as the module L in the example of Figure 4, are to be considered or ignored in the generation of the performance reports. Likewise, the user can decide whether to include asynchronously activated modules such as the module Q in Fig. 4.
- the design evaluation tool 24 can include a facility which activates a spreadsheet program 30 to use the information contained in the worksheet file 28.
- a spreadsheet program 30 An example of such a spreadsheet is illustrated in Figure 5 for a portion of the program whose structure is depicted in Figure 4.
- the root module A is identified.
- the weight which has been assigned to this module is listed. In this case the weight of the root module is 1.
- Below the weight are listed the other modules that are called from the root module. In the illustrated example only modules B and C are listed. Again, the weight for each of these modules is shown to the immediate right of the module identification. Below the weight for each of these two modules are listed other modules that can be called from these modules, along with their assigned weights.
- the summed weight for the path to that module is also listed.
- the total weights of the paths A/C/M and A/B/F (4.8 and 3.25, respectively) are shown to the extreme right in the example of Figure 5.
- An advantage associated with the presentation of this information in a spreadsheet is that it enables the user to create hypothetical situations from which he can assess the overall performance of the program.
- the user can alter the weights of individual modules within the spreadsheet; when the spreadsheet is recalculated, the user is provided with updated information that shows how the new module weight affects the overall performance of the program.
- the tool 24 can generate a report which lists the original weight of a module, the new weight assigned by the user, and a "delta" or difference between the two weights. This delta can be expressed as a percentage of the original weight.
- the report can also identify the percentage difference which the weight change will have on the performance timing of each path in which the changed module is located. From this information, the user can determine whether optimization of a particular module, for example to reduce its complexity, is a worthwhile effort. If desired, the user can instruct the evaluation tool 24 to update the software design data base 22 with the revised weights entered into the spreadsheet 30.
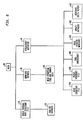
- FIG. 6 A general structure chart for the overall operation of the design evaluation tool 24 is illustrated in Figure 6.
- the tool begins operation in a main routine 32 which handles initialization and various other housekeeping chores and controls the overall flow of the program.
- the program branches to a routine 34 for building an internal path structure file.
- the structured design database 22 is analyzed within another routine 36 and a file is built which describes all of the paths, their lengths and weights, and associated loop and condition information.
- the program branches to a routine 38 to generate reports.
- the program reads the data stored in the internal file and formats this data to produce the appropriate reports by means of a routine 39.
- the design evaluation program can branch to the spreadsheet interface routine 40.
- the appropriate data from the internal file is again read (subroutine 40A) and a worksheet file is built (subroutine 40B).
- a suitable spreadsheet application program is then called (subroutine 40C) and the spreadsheet is displayed. If the user modifies any of the weight values for the module, the updated information is read (subroutine 40D) and used to update the database 22 (subroutine 40E). The updated data is also used to generate the delta reports (subroutine 40F).
- FIG. 7 A more specific flow chart which illustrates the operation of the database analysis routine 36 is shown in Figure 7. Basically, the evaluation of the design being tested proceeds as a series of nested loops in which each possible path in the structure of the design is identified and its length is measured.
- the tool begins at a starting module selected by the user. If the user does not select a starting module, the tool starts with the root module (module A in the example of Figure 4).
- the weight of the starting module is stored as indicated by a block 101 in FIG. 7.
- the starting module defines a top or first module level.
- a variable "i” is used to identify any second level modules which are called from the starting module. This variable is initially set equal to 1, as indicated by a block 103.
- a level counter "c” is used to keep track of how many levels there are between the starting module and a terminal module, and this variable is also initially set equal to 1, as indicated by a block 105.
- the tool 24 finds and stores the weight of the i-th second level module which is called from the root module, as indicated by a block 107.
- the tool also finds whether any third level modules are called from the i-th second level module, as indicated by a decision block 109. If so, a variable "j" is used to identify such third level modules. This variable is initially set equal to 1, as indicated by a block 111, and the level counter "c" is set equal to 2 as indicated by a block 113 to show that there are two levels between the starting module and the j-th third level module. Then the weight of the j-th third level module is stored as indicated by a block 115.
- the tool finds whether any fourth level modules are called from the j-th third level module, as indicated by a decision block 117.
- a variable "k” is used to identity such fourth level modules and is initially set equal to 1, as indicated by a block 119, and the level counter "c" is set equal to 3 as indicated by a block 121. Then the weight of the k-th fourth level module is stored as indicated by a block 123.
- a terminal module (a module which calls no lower-level modules) is reached.
- a description of the path which has been followed from the starting module to that terminal module is stored. For example, if the terminal module is the i-th second level module, this occurs in response to a negative answer from the decision block 109 (whether any third-level modules are called from that second level module) as indicated by a block 127.
- the path description is stored in response to a negative answer from the decision block 117 as indicated by a block 129, and if the terminal module is the k-th fourth level module the path description is stored in response to a negative answer from the decision block 125 as indicated by a block 131.
- the path description includes the value of the level counter "c", which indicates the length of the path; the identification and weight of each module in the path; the sum of the weights of the modules; and any applicable loop and conditional information respecting the path.
- the tool After storing the path description, the tool returns to the next previous level and continues with all other possible modules that can be accessed from the module which called the terminal module. This procedure continues until all possible paths have been identified and their descriptions stored. For example, if the k-th fourth level module is a terminal module, the tool determines whether there are any other fourth level modules called by the j-th third level module, as indicated by a decision block 133. If so, k is incremented as indicated by a block 135 and the tool returns to block 121.
- the tool determines whether any other third level modules are called by the i-th second level module, as indicated by a decision block 137. If so, j is incremented as indicated by a block 139 and the tool returns to block 113. Similarly, if there are no more third level modules, the tool determines whether any other second level modules are called by the starting module, as indicated by a decision block 141. If so, i is incremented as indicated by a block 143 and the tool returns to the block 105. When no more modules are left, the analysis routine 36 ends as indicated by a block 145.
- the present invention provides the software engineer with a tool to evaluate the efficiency of a program design, and possible performance drawbacks, early in the development life cycle of the program.
- the software engineer By providing the software engineer with this type of information at such an early stage, the need to write program code and test portions of the program that may need to be subsequently redesigned is thereby avoided.
- the designer by enabling the designer to experiment with different performance weights for each module and measure the effect of these different weights on total performance, designs can be optimized prior to coding.
- the tool provided by the present invention will be especially valuable to a software engineer who is designing a large and complex software system.
- a software engineer who is designing a large and complex software system.
- Such a system may have large numbers of levels, many modules at each level, and many hundreds of possible paths among these modules.
- the structure of many such systems is so complex as to defy any attempt at analysis by existing means.
- the present invention makes it possible for the engineer to evaluate such a design, find potential trouble spots and correct them, all before any coding has taken place.
- Uses for the present invention are not limited to the development of entirely new programs. It can also be used to analyze potential problem areas whenever enhancements are being made to existing software.
Landscapes
- Engineering & Computer Science (AREA)
- General Engineering & Computer Science (AREA)
- Theoretical Computer Science (AREA)
- Computer Hardware Design (AREA)
- Quality & Reliability (AREA)
- Physics & Mathematics (AREA)
- General Physics & Mathematics (AREA)
- Stored Programmes (AREA)
- Debugging And Monitoring (AREA)
Description
- The present invention generally relates to the development of software programs, and is more specifically directed to a novel programming tool which enables a software engineer to evaluate the expected performance of a program and isolate potential performance problems during an early stage of program development.
- A typical life cycle in the development of a computer program includes the initial steps of analyzing the problem to be solved by the program and designing the overall structure of the program. After the general structure of the program has been designed, it is then constructed, or coded, after which it undergoes a period of testing and debugging. Finally, after the program has been successfully tested, it is released for general use. One difficulty associated with this traditional approach to the development of software is the fact that it does not readily enable design defects to be recognized until substantially all of the work necessary to create the program has been completed. In other words, in the past it has always been necessary to construct the code for the program before it could be tested for the efficiency of its operation. Thus, once the code had been written and the program run during the testing phase, if unsatisfactory performance was detected it was necessary to return to the design phase to restructure the program, and then rewrite the code to implement the design changes.
- Often, the types of mistakes which are most expensive to correct are those which occur in the analysis and design phases of the software development cycle. In this regard, one of the factors which significantly influences the performance of a program is the lengths of the paths in the structure of the program that are followed to carry out a particular task. The length of the path is typically defined in terms of the number of transitions from module to module which occur as the program proceeds from an initial module to the final node in the path which represents completion of the task. As a path length becomes longer, it typically takes the program longer to execute the task, thereby reducing the efficiency of the program. Another factor which influences the performance of the program is the efficiency of a particular module which may be executed often by being called many times.
- In this regard, one popular methodology that is used in the development of software is known as Structured Design. Basically, this methodology involves breaking a task down into smaller and smaller functional units. Through this approach, repeatable and more predictable results can be obtained in software development. However, since the structured design approach promotes functional decomposition and small module sizes, it can result in longer path lengths. As a result, the performance of the program could be less than optimal when this design methodology is employed.
- In "Software Performance Analysis Using a Graphic Modeling Technique", Proceedings of the Eighth Annual International Phoenix Conference on Computers and Communications, March 24, 1989, Scottsdale, Arizona, J. Wang et al. propose a Graphic Performance Analysis System ("GPAS"). A software designer uses GPAS to build a computation structure model during the design process. This model can only are one start node, one end node, and three other kinds of nodes. The designer uses the model for performance and functional design.
- Although Wang et al. provide a method of designing software that has one defined start node and one defined end node, in a program having many modules it is often difficult to identify critical flow paths through the various modules. This is particularly the case if the overall program might follow any one of many different paths, each ending with different module. Thus, in large and complex programs, the program must be coded and tested before long path which adversely affect performance can be recognized. As a result, it can be appreciated that significant and expensive efforts may be required to redesign the program and then recode it once the performance limitations have been detected. Accordingly, it would be desirable to provide a software engineering tool which isolates possible performance problems early in the software development cycle, before coding, to thereby minimize the effort necessary to correct such problems.
- The features of the inventionare defined in
Claim 1. - The invention, enables expected efficiency and performance of a program design to be evaluated prior to coding. It is particularly designed to work with the results of the Structured Design approach to software development. Basically, conventional software used in the implementation of the Structured Design approach provide a database which includes a specification for each module (functional element) in the design, as well as the overall relationship of the modules to one another. Utilizing this information, the invention determines every possible path that can be followed by the implementation of the program. From these determinations, reports are generated which identify the longest paths in the program, and hence the sources of potential "bottlenecks" in the performance of the program.
- In a preferred embodiment of the invention, time that would be required to follow each path can be determined on the basis of weighting factors assigned to the various modules. The modules which are called most often in the implementation of the program can be identified and called to the program developer's attention as program elements which may need to be most closely reviewed for possible optimization. The user can also create various hypothetical situations and evaluate their effect on the efficiency of the program.
- The invention enables the program developer to identify and correct some types of design deficiencies before any coding of the program ever takes place, thereby significantly reducing the cost and effort required to produce a program which operates with optimum efficiency.
- Further features of the present invention and the advantages offered thereby are explained in greater detail hereinafter with reference to various examples illustrated in the accompanying drawings.
-
- Figure 1 is a block diagram flow chart of the prior art approach to the development of software;
- Figure 2 is a block diagram flow chart depicting a software development life cycle which employs the principles of the present invention;
- Figure 3 is a general block diagram depicting the functional operation of the present invention;
- Figure 4 is an example of a structure chart that can be produced through the Structured Design approach to software development;
- Figure 5 is an example of a spreadsheet that can be generated by the design evaluation tool;
- Figure 6 is a general structure chart depicting the overall operation of the present invention; and
- Figure 7 is a more specific flow chart illustrating the analysis of the information in the Structured Design database to create an internal path structure file.
- The typical life cycle that has been conventionally employed in the development of software will first be briefly described with reference to Figure 1. In a structured systems design approach, the first step involves a
Structured Analysis 10 of the basic objectives of the software. Generally, this phase results in an outline of the program user's requirements for the program. Once these requirements have been identified, aStructured Design approach 12 is employed to define the tasks to be carried out by the software. When these tasks have been designed with sufficient particularity, actual coding of the program takes place, atstep 14. After the coding phase, the program undergoes a testing andevaluation phase 16. - As a result of the testing phase, limitations in the performance of the program will be recognized. For example, tasks which are not completed in a specified period of time will be identified. At this point, the software development process returns to the
design phase 12, where the design is revised to reduce or eliminate the performance bottlenecks. As a result of these design changes,additional coding 14 must take place, which is followed up by further testing andevaluation steps 16. The closed loop process of designing, coding, and testing might go through several iterations before the program finally operates at a satisfactory level. Once this point has been reached, the program is then released for distribution atstep 18. - In accordance with the present invention, much of the time that is spent during the testing, redesign and recoding phases of the software development cycle can be significantly reduced by evaluating the efficiency of the design prior to the time that coding of the program takes place. Referring to Figure 2, a software development cycle that employs the techniques of the present invention begins with an analysis of the functions to be performed by the program, preferably using the Structured Analysis approach. This phase is followed by the
design phase 12 for the program, again preferably using a Structured Design technique. The software tools that are employed in accordance with this technique generate a database containing information that can be used to evaluate the overall efficiency of the design, in accordance with the present invention. Structured Design is a well known method that is conventionally employed by software engineers, and therefore will not be described herein. For a detailed description of this design approach, reference is made to The Practical Guide to Structured Systems Design by Meilir Page-Jones, published by Yourdon Press, New York, 1980. - Using the information provided as a result of the Structured Design, an
evaluation 20 of the design takes place immediately following the completion of thedesign step 12, and prior to thecoding phase 14. As a result of this evaluation, various inefficiencies in the design can be detected and called to the software engineer's attention. For example, as discussed previously, one factor which significantly contributes to the efficiency of a program is the lengths of the paths that must be followed to execute a particular task. Theevaluation step 20 can determine the lengths of the paths that must be followed during the operation of the program under development. In addition, theevaluation phase 20 can operate to identify modules (functional elements) in the program which are utilized most frequently and call these modules to the designer's attention as likely candidates for optimization, as well as provide other information which helps to isolate possible performance limitations. - With the information provided from the
design evaluation step 20, the software engineer can redesign the program to reduce or eliminate the possible inefficiencies. After the program has been redesigned, it can again be evaluated in accordance with the present invention, and further refined as necessary. Once thedesign evaluation step 20 provides an indication that the program structure meets a satisfactory performance level, the design can be presented to a programmer for the conventional steps ofcoding 14 andtesting 16. Since the design evaluation helps to identify and reduce design inefficiencies prior to coding, thetesting phase 16 is more likely to be concentrated on specific coding errors and the debugging of these errors. Coding errors are much easier and less expensive to correct than design mistakes, and hence the overall effort and time required to put the program in form forfinal release 18 could be significantly reduced, particularly for large and highly complex programs. - The general architecture of a system for performing the
design evaluation phase 20 is illustrated in block diagram form in Figure 3. Referring thereto, the tools which are employed to carry out the Structured Design approach to software engineering provide adatabase 22 which contains information describing the overall structure of the program as well as the functionality of its individual modules. The overall structure of the program is typically represented by means of a structure chart, an example of which is shown in Figure 4. The particular example represented in Figure 4 is for a relatively simple program, to facilitate an understanding of the invention and its application. It will be appreciated, however, that the present invention is particularly useful in connection with large and highly complex program designs, whose structure charts may typically be spread over a number of sheets and are therefore difficult to manually comprehend. - In the structure chart, each of the blocks which is labeled with a letter represents a module in the program. The lines interconnecting the modules identify the hierarchical relationships of the modules to one another, and serve to define the paths which are followed in the operation of the program to perform specific tasks. In addition to information describing the structure chart, the database 22 (shown in FIG. 3) also contains a specification for each individual module. This specification basically describes the inputs of a module, the function performed within the module, and the outputs of the module.
- The information contained within the
database 22 is accessed by adesign evaluation tool 24 which operates in accordance with the present invention. In one mode of operation, theevaluation tool 24 determines the length of every possible path that can be followed during the running of the program. Basically, a path length is defined in terms of the number of transitions from an initial module to the final node in the path. Referring to the structure chart shown in Figure 4, the path from the initial module A to the terminal module M contains two transitions, from module A to C and then from module C to M. Thus, this path has a length of 2. - In operation, the user specifies a particular module of interest, which can be the beginning module in a task execution path. Each possible path that can be followed from this initial module is then determined, and its length is measured. After all possible paths have been evaluated, the
tool 24 generatesreports 26 on a printer or a video display that are indicative of such evaluation. One such report can list all possible paths from the specified module, such as the root module A for example, and their corresponding lengths. For the program of Figure 4, such a report would appear as follows in Table 1:Table 1 ALL PATHS Path Path Length A/B/E/G 3 A/B/E/H/I 4 A/B/E/H/J/L 5 A/B/E/H/K/R 5 A/B/F 2 A/C/M 2 A/C/N/O/K/R 5 A/C/N/P 3 A/C/N/Q 3 A^D/K/R 2 A/W/T/U/T/... * - If desired, the paths can be listed in order of descending path length. In addition, the user can select whether those modules that are asynchronously activated, such as the module Q in the example of Figure 4 (as represented by the dashed line from module N to module Q), are to be ignored during the design evaluation. In such a case, the paths to those modules (path A/C/N/Q in the example of Figure 4 is such a path) would not be listed in the report shown in Table 1.
- The report can also identify paths that are recursive, that is, those which could result in endless loops. The last path listed in Table 1 is a recursive path because it extends from module T to module U and then loops from module U back to module T. This path is identified as a recursive path by repetition of the letter which identifies the first module in the recursive path, ellipses in the path listing, and an asterisk rather than a finite number in the "Path Length" column of the table.
- As another feature the report allows for any lexically included modules which are included in the structure chart. A lexically included module is actually a part of another module and therefore does not contribute to path length; however, it is convenient to illustrate it in the structure chart. In FIG. 4, for example, the module D is a lexically included module which is actually a part of the module A. This is denoted in Figure 4 by a stylized carat on top of module D. Only one path includes module D -- this path extends from module A to D, from module D to K andfrom module K to R. This path, which is the next-to-last path in Table 1, is shown ashaving a path length of 2 because the lexically included module D does not contribute tothe path length; this is indicated in Table 1 by a carat between the letters A and D in thepath description.
- Another type of report can list all excessive paths and path lengths. In the generation of this report, the software engineer specifies a length limit that should not be exceeded in the design, and the report would list only those paths that have a length greater than that which is specified. For example, if the software engineer specified a maximum path length of 4 for the program illustrated in Figure 4, the excessive path length report would be constituted as shown in the following Table 2:
Table 2 EXCESSIVE PATHS Path Path Length A/B/E/H/J/L 5 A/B/E/H/K/R 5 A/C/N/O/K/R 5 - A third type of report can identify portions of the design and program that the engineer may wish to optimize. In the generation of this report, the user specifies a number which indicates the unique number of calls to any module or sub-path. The purpose of this number is to identify the modules and sub-paths that are called most frequently by other modules. For example, if the user specifies the
number 3, thedesign evaluation tool 24 generates a report identifying all sub-paths that have at least 3 unique calling modules. For the example shown in Figure 4, such a report would appear as shown in the following Table 3:Table 3 OPTIMIZATION Path # Calls Calling Modules K/R 3 H,O,D - In addition to reports which are based upon the lengths of paths in the structured design, the
evaluation tool 24 can also provide reports which are based upon the anticipated time that would be required to complete certain tasks. In this mode of operation, the user assigns a relative weight to each module in the program structure. The weight assigned to a module is a number which represents, for example, the relative complexity of the module or the anticipated performance time of the module. These weights can be entered during thedesign phase 12 of the program and stored in theStructured Design database 22 as part of the module specification. Alternatively, the weights can be entered by the user during thedesign evaluation phase 20 and stored in aworksheet file 28, for example. - The
tool 24 will read the weights from the worksheet file and update the module specifications in thedesign database 22 automatically. A weight of 1, for example, can be associated with a relatively simple module, and each other module can be assigned a weight value which indicates the complexity of that module relative to that of the simple module. Thus, a module with a weight of 3 would be expected to take 3 times longer to execute than the simple module having a weight of 1. If the user fails to specify a weight for a given module, thetool 24 can assign a default weight (for example, a weight of 1) to such module. - In this mode of operation, a timing report can be generated which identifies each path with its timing weight. The timing weight for a path would be the sum of the weights for each module in the path. As a subset of this report, the user can request that only those paths having a timing weight greater than a specified threshold level be identified.
- As an alternative to designating specific weights for each module, the software engineer can identity each module as being of a particular type and store this identification as part of the module specification in the structured
design database 22. The user can also provide a file which contains a list of module types and a performance weight for each type. Theevaluation tool 24 can then refer to this file and assign the appropriate performance weight to a module based upon its type. - In addition to weighting each of the individual modules, a probability can also be assigned to each invocation path that is conditionally activated (not always called). In the example illustrated in Figure 4, the paths from the module n to each of the modules o, p and q are conditional. This status is indicated by the diamond symbol at the output of the module n. For each of these conditional paths, a probability of its likelihood of being called can be assigned by the user. When generating a report on the paths that are most commonly called, the weighting information can be factored into the expected performance of the program.
- A particularly useful report that can be generated with the design evaluation tool of the present invention is a performance report which identifies paths that should be of particular concern to the software engineer from the standpoint of possible performance problems. This type of report takes into account both path lengths and path weights and is comprised of three sections as shown in Table 4 below:
Table 4 DESCENDING PATH LENGTHS Path Length Loops Conds A/B/E/H/J/L 5 2 2 A/B/E/H/K/R 5 2 1 A/C/N/O/K/R 5 1 1 A/B/E/H/I 4 2 1 DESCENDING PATH WEIGHTS Path Weight Loops Conds A/B/E/H/K/R 11.00 2 1 A/B/E/H/I 8.50 2 1 A/B/E/H/J/L 6.15 2 2 A/C/N/O/K/R 5.85 1 2 DESCENDING PATH LENGTHS & WEIGHTS Path Length Weight Loops Conds A/B/E/H/K/R 5 11.00 2 1 A/B/E/H/J/L 5 6.15 2 2 A/B/E/H/I 4 8.50 2 1 A/C/N/O/K/R 5 5.85 1 2 - In the generation of this report the user specifies how many paths are to be listed. This quantity is preferably expressed as a percentage of all the paths in the program. For example, if there are 40 paths in a program and a user specifies that 10% of the paths are to be listed, the report will list 4 paths.
- The first section of the report lists those paths which have the greatest lengths, in order of decreasing length, until the desired number of paths have been listed. It also lists the number of loops and conditionals for each path, and sorts paths of the same length in descending order of loops and conditionals, respectively.
- The second section lists those paths which have the greatest weights, in order of decreasing path weight, until the desired number of paths have been listed. Again, the number of loops and conditionals can be used as secondary and tertiary sorting criteria if two or more paths have the same weight.
- The third section represents a combination of the first two sections; both length and weight are listed. The sorting of the paths in this section is done in accordance with criteria selected by the software engineer. In Table 4, the paths which are listed in the third section have been listed in ascending order of the sums of their ordinal positions in the first two sections.
- The ordinal position of the the path A/B/E/H/K/R in the first section, for example, is 2 and in the second section is 1; its ordinal sum is therefore 3. Similarly, the ordinal position of the path A/B/E/H/J/L in the first section is 1 and in the second section is 3; its ordinal sum is therefore 4 and accordingly it is listed below the path A/B/E/H/K/R in the third section of the table.
- If desired, the user can decide whether paths that contain external library calls, such as the module L in the example of Figure 4, are to be considered or ignored in the generation of the performance reports. Likewise, the user can decide whether to include asynchronously activated modules such as the module Q in Fig. 4.
- As a further feature, the
design evaluation tool 24 can include a facility which activates aspreadsheet program 30 to use the information contained in theworksheet file 28. An example of such a spreadsheet is illustrated in Figure 5 for a portion of the program whose structure is depicted in Figure 4. At the left of this spreadsheet the root module A is identified. Immediately to the right of the module identification, the weight which has been assigned to this module is listed. In this case the weight of the root module is 1. Below the weight are listed the other modules that are called from the root module. In the illustrated example only modules B and C are listed. Again, the weight for each of these modules is shown to the immediate right of the module identification. Below the weight for each of these two modules are listed other modules that can be called from these modules, along with their assigned weights. For each module which is the terminal module in a path, the summed weight for the path to that module is also listed. Thus, the total weights of the paths A/C/M and A/B/F (4.8 and 3.25, respectively) are shown to the extreme right in the example of Figure 5. - An advantage associated with the presentation of this information in a spreadsheet is that it enables the user to create hypothetical situations from which he can assess the overall performance of the program. Specifically, the user can alter the weights of individual modules within the spreadsheet; when the spreadsheet is recalculated, the user is provided with updated information that shows how the new module weight affects the overall performance of the program. In this regard, the
tool 24 can generate a report which lists the original weight of a module, the new weight assigned by the user, and a "delta" or difference between the two weights. This delta can be expressed as a percentage of the original weight. The report can also identify the percentage difference which the weight change will have on the performance timing of each path in which the changed module is located. From this information, the user can determine whether optimization of a particular module, for example to reduce its complexity, is a worthwhile effort. If desired, the user can instruct theevaluation tool 24 to update the softwaredesign data base 22 with the revised weights entered into thespreadsheet 30. - A general structure chart for the overall operation of the
design evaluation tool 24 is illustrated in Figure 6. The tool begins operation in a main routine 32 which handles initialization and various other housekeeping chores and controls the overall flow of the program. Once these general operations have been carried out, the program branches to a routine 34 for building an internal path structure file. In this process, thestructured design database 22 is analyzed within another routine 36 and a file is built which describes all of the paths, their lengths and weights, and associated loop and condition information. After the internal file has been built, the program branches to a routine 38 to generate reports. As part of this function, the program reads the data stored in the internal file and formats this data to produce the appropriate reports by means of a routine 39. - Thereafter, the design evaluation program can branch to the
spreadsheet interface routine 40. Within this routine, the appropriate data from the internal file is again read (subroutine 40A) and a worksheet file is built (subroutine 40B). A suitable spreadsheet application program is then called (subroutine 40C) and the spreadsheet is displayed. If the user modifies any of the weight values for the module, the updated information is read (subroutine 40D) and used to update the database 22 (subroutine 40E). The updated data is also used to generate the delta reports (subroutine 40F). - A more specific flow chart which illustrates the operation of the
database analysis routine 36 is shown in Figure 7. Basically, the evaluation of the design being tested proceeds as a series of nested loops in which each possible path in the structure of the design is identified and its length is measured. - At the outset, the tool begins at a starting module selected by the user. If the user does not select a starting module, the tool starts with the root module (module A in the example of Figure 4). The weight of the starting module is stored as indicated by a
block 101 in FIG. 7. The starting module defines a top or first module level. - A variable "i" is used to identify any second level modules which are called from the starting module. This variable is initially set equal to 1, as indicated by a
block 103. A level counter "c" is used to keep track of how many levels there are between the starting module and a terminal module, and this variable is also initially set equal to 1, as indicated by ablock 105. - By referring to the module specification stored in the
data base 22, thetool 24 finds and stores the weight of the i-th second level module which is called from the root module, as indicated by a block 107. The tool also finds whether any third level modules are called from the i-th second level module, as indicated by adecision block 109. If so, a variable "j" is used to identify such third level modules. This variable is initially set equal to 1, as indicated by ablock 111, and the level counter "c" is set equal to 2 as indicated by ablock 113 to show that there are two levels between the starting module and the j-th third level module. Then the weight of the j-th third level module is stored as indicated by ablock 115. - Similarly, the tool finds whether any fourth level modules are called from the j-th third level module, as indicated by a
decision block 117. A variable "k" is used to identity such fourth level modules and is initially set equal to 1, as indicated by ablock 119, and the level counter "c" is set equal to 3 as indicated by ablock 121. Then the weight of the k-th fourth level module is stored as indicated by a block 123. - The process continues with any fifth level modules which are called from the k-th fourth level module, as indicated by a
decision block 125, and so forth. - Eventually a terminal module (a module which calls no lower-level modules) is reached. When this happens, a description of the path which has been followed from the starting module to that terminal module is stored. For example, if the terminal module is the i-th second level module, this occurs in response to a negative answer from the decision block 109 (whether any third-level modules are called from that second level module) as indicated by a
block 127. - Similarly, if the terminal module is the j-th third level module, the path description is stored in response to a negative answer from the
decision block 117 as indicated by ablock 129, and if the terminal module is the k-th fourth level module the path description is stored in response to a negative answer from thedecision block 125 as indicated by ablock 131. - The path description includes the value of the level counter "c", which indicates the length of the path; the identification and weight of each module in the path; the sum of the weights of the modules; and any applicable loop and conditional information respecting the path.
- After storing the path description, the tool returns to the next previous level and continues with all other possible modules that can be accessed from the module which called the terminal module. This procedure continues until all possible paths have been identified and their descriptions stored. For example, if the k-th fourth level module is a terminal module, the tool determines whether there are any other fourth level modules called by the j-th third level module, as indicated by a
decision block 133. If so, k is incremented as indicated by a block 135 and the tool returns to block 121. - If there are no more fourth level modules, the tool determines whether any other third level modules are called by the i-th second level module, as indicated by a
decision block 137. If so, j is incremented as indicated by ablock 139 and the tool returns to block 113. Similarly, if there are no more third level modules, the tool determines whether any other second level modules are called by the starting module, as indicated by a decision block 141. If so, i is incremented as indicated by ablock 143 and the tool returns to theblock 105. When no more modules are left, theanalysis routine 36 ends as indicated by ablock 145. - From the foregoing, it will be appreciated that the present invention provides the software engineer with a tool to evaluate the efficiency of a program design, and possible performance drawbacks, early in the development life cycle of the program. By providing the software engineer with this type of information at such an early stage, the need to write program code and test portions of the program that may need to be subsequently redesigned is thereby avoided. Furthermore, by enabling the designer to experiment with different performance weights for each module and measure the effect of these different weights on total performance, designs can be optimized prior to coding.
- The tool provided by the present invention will be especially valuable to a software engineer who is designing a large and complex software system. Such a system may have large numbers of levels, many modules at each level, and many hundreds of possible paths among these modules. The structure of many such systems is so complex as to defy any attempt at analysis by existing means. The present invention makes it possible for the engineer to evaluate such a design, find potential trouble spots and correct them, all before any coding has taken place.
- Uses for the present invention are not limited to the development of entirely new programs. It can also be used to analyze potential problem areas whenever enhancements are being made to existing software.
- It will be appreciated by those of ordinary skill in the art that the present invention can be implemented in other ways and embodied in other specific forms without departing from essential characteristics thereof. The presently disclosed embodiments are therefore considered in all respects to be illustrative and not restrictive. The scope of the invention is indicated by the appended claims rather than the foregoing description, and all changes that come within the meaning and range of equivalents thereof are intended to be embraced therein.
Claims (7)
- A method of evaluating the design of a program during development of the program by means of a structured design process in which: a database (22) that identifies each functional module in the program and the hierarchical relationships of the modules to one another is created and stored, a module which forms a starting point for a task to be executed by the program is identified, and a report (26) providing a result of the evaluation is prepared by a design evaluation tool (24), the method characterized by the design evaluation tool (24) performing the steps of:- accessing the database (22) to determine possible paths from the identified starting point module to other modules in the hierarchical relationship that can be followed by the program in executing the task;- measuring the relative lengths of the various possible paths wherein the path length is defined in terms of the number of transitions from an initial module to the final module in the path; and- estimating relative execution times according to said relative path lengths.
- A method as in claim 1 wherein estimating relative execution times comprises assigning a weight factor to each module in the determined paths and summing the weight factors for all modules in each of the determined paths.
- A method as in claim 2 wherein the step of assigning a weight factor to a module comprises identifying the module as being of a particular type, establishing a table which associates a weight factor with each type of module, and accessing said table to determine the weight factor for a particular module on the basis of its type.
- A method as in claim 2 wherein the step of assigning a weight factor to a module comprises manually entering a weight factor for that module.
- A method as in claim 2, 3 or 4 wherein the report comprises a spread sheet in which a user can modify a weight factor and thereby obtain an indication of the effect which a modified weight factor would have on the estimated relative execution times of the determined paths.
- A method as in any preceding claim and further comprising:selecting a threshold call number;identifying each module that can be called during execution of a task by a number of other modules equal to or greater than the threshold call number; andproducing an optimization report which lists the identified modules.
- A method as in claim 6 wherein the optimization report indicates which modules can call each identified module.
Applications Claiming Priority (2)
| Application Number | Priority Date | Filing Date | Title |
|---|---|---|---|
| US33131589A | 1989-03-29 | 1989-03-29 | |
| US331315 | 1989-03-29 |
Publications (3)
| Publication Number | Publication Date |
|---|---|
| EP0390339A2 EP0390339A2 (en) | 1990-10-03 |
| EP0390339A3 EP0390339A3 (en) | 1991-10-09 |
| EP0390339B1 true EP0390339B1 (en) | 1996-01-03 |
Family
ID=23293445
Family Applications (1)
| Application Number | Title | Priority Date | Filing Date |
|---|---|---|---|
| EP90302179A Expired - Lifetime EP0390339B1 (en) | 1989-03-29 | 1990-03-01 | Path measurement and analysis tool for evaluating the performance of software designs |
Country Status (4)
| Country | Link |
|---|---|
| US (1) | US5168563A (en) |
| EP (1) | EP0390339B1 (en) |
| JP (1) | JP2783641B2 (en) |
| DE (1) | DE69024515T2 (en) |
Families Citing this family (41)
| Publication number | Priority date | Publication date | Assignee | Title |
|---|---|---|---|---|
| US5269014A (en) * | 1988-05-24 | 1993-12-07 | Mitsubishi Denki Kabushiki Kaisha | Automatic programming system with design review capabilities |
| JP2612967B2 (en) * | 1991-01-18 | 1997-05-21 | 松下電器産業株式会社 | Network diagram automatic generation method and system |
| JPH05341819A (en) * | 1991-02-05 | 1993-12-24 | Mitsubishi Electric Corp | Method and device for debugging of sfc program |
| US5724569A (en) * | 1991-03-29 | 1998-03-03 | Bull S.A. | Apparatus for evaluating database query performance having libraries containing information for modeling the various system components of multiple systems |
| US5485615A (en) * | 1992-06-10 | 1996-01-16 | Telefonaktiebolaget L M Ericsson | System and method of interactively developing desired computer programs by using plurality of tools within a process described in graphical language |
| US5297150A (en) * | 1992-06-17 | 1994-03-22 | International Business Machines Corporation | Rule-based method for testing of programming segments |
| JP2634137B2 (en) * | 1993-01-27 | 1997-07-23 | インターナショナル・ビジネス・マシーンズ・コーポレイション | User interface system and method |
| US5648913A (en) * | 1993-03-29 | 1997-07-15 | Xilinx, Inc. | Frequency driven layout system and method for field programmable gate arrays |
| JP3153403B2 (en) * | 1993-12-28 | 2001-04-09 | 富士通株式会社 | Device for calculating delay time of semiconductor integrated circuit |
| US5455938A (en) * | 1994-09-14 | 1995-10-03 | Ahmed; Sultan | Network based machine instruction generator for design verification |
| US5727167A (en) * | 1995-04-14 | 1998-03-10 | International Business Machines Corporation | Thresholding support in performance monitoring |
| US5751945A (en) * | 1995-10-02 | 1998-05-12 | International Business Machines Corporation | Method and system for performance monitoring stalls to identify pipeline bottlenecks and stalls in a processing system |
| US5729726A (en) * | 1995-10-02 | 1998-03-17 | International Business Machines Corporation | Method and system for performance monitoring efficiency of branch unit operation in a processing system |
| US5748855A (en) * | 1995-10-02 | 1998-05-05 | Iinternational Business Machines Corporation | Method and system for performance monitoring of misaligned memory accesses in a processing system |
| US5691920A (en) * | 1995-10-02 | 1997-11-25 | International Business Machines Corporation | Method and system for performance monitoring of dispatch unit efficiency in a processing system |
| US5797019A (en) * | 1995-10-02 | 1998-08-18 | International Business Machines Corporation | Method and system for performance monitoring time lengths of disabled interrupts in a processing system |
| US5949971A (en) * | 1995-10-02 | 1999-09-07 | International Business Machines Corporation | Method and system for performance monitoring through identification of frequency and length of time of execution of serialization instructions in a processing system |
| US5752062A (en) * | 1995-10-02 | 1998-05-12 | International Business Machines Corporation | Method and system for performance monitoring through monitoring an order of processor events during execution in a processing system |
| US5831869A (en) * | 1995-12-15 | 1998-11-03 | Unisys Corporation | Method of compacting data representations of hierarchical logic designs used for static timing analysis |
| US6073108A (en) * | 1996-06-21 | 2000-06-06 | Paul, Hastings, Janofsky & Walker | Task-based classification and analysis system |
| US6311166B1 (en) | 1996-07-25 | 2001-10-30 | Price Waterhouse World Firm Services Bv | Method for analyzing effectiveness of internal controls in a model of an accounting system |
| US6199193B1 (en) * | 1997-03-18 | 2001-03-06 | Fujitsu Limited | Method and system for software development and software design evaluation server |
| JP4190610B2 (en) * | 1998-02-18 | 2008-12-03 | 富士通株式会社 | Load module test route determination device |
| US6341338B1 (en) | 1999-02-04 | 2002-01-22 | Sun Microsystems, Inc. | Protocol for coordinating the distribution of shared memory |
| US7035989B1 (en) | 2000-02-16 | 2006-04-25 | Sun Microsystems, Inc. | Adaptive memory allocation |
| US6802057B1 (en) | 2000-05-03 | 2004-10-05 | Sun Microsystems, Inc. | Automatic generation of fortran 90 interfaces to fortran 77 code |
| US6986130B1 (en) | 2000-07-28 | 2006-01-10 | Sun Microsystems, Inc. | Methods and apparatus for compiling computer programs using partial function inlining |
| US6910107B1 (en) | 2000-08-23 | 2005-06-21 | Sun Microsystems, Inc. | Method and apparatus for invalidation of data in computer systems |
| US7406681B1 (en) | 2000-10-12 | 2008-07-29 | Sun Microsystems, Inc. | Automatic conversion of source code from 32-bit to 64-bit |
| US6957208B1 (en) * | 2000-10-31 | 2005-10-18 | Sun Microsystems, Inc. | Method, apparatus, and article of manufacture for performance analysis using semantic knowledge |
| US6745348B2 (en) | 2001-06-14 | 2004-06-01 | International Business Machines Corporation | Method for estimating number of internationalization faults in software code |
| US7010783B2 (en) | 2002-03-18 | 2006-03-07 | Sun Microsystems, Inc. | Method and apparatus for deployment of high integrity software using reduced dynamic memory allocation |
| US6996802B2 (en) | 2002-03-18 | 2006-02-07 | Sun Microsystems, Inc. | Method and apparatus for deployment of high integrity software using initialization order and calling order constraints |
| US7181737B2 (en) | 2002-03-18 | 2007-02-20 | Sun Microsystems, Inc. | Method and apparatus for deployment of high integrity software using static procedure return addresses |
| US20040187892A1 (en) * | 2003-03-31 | 2004-09-30 | Maguire Walter L. | Scrubbing element with leader |
| US20040250176A1 (en) * | 2003-06-03 | 2004-12-09 | Brown Christopher W. | Generating a status report from source code |
| US8875100B2 (en) | 2011-06-17 | 2014-10-28 | Microsoft Corporation | Pattern analysis and performance accounting |
| WO2016172950A1 (en) * | 2015-04-30 | 2016-11-03 | Hewlett-Packard Development Company, L.P. | Application testing |
| CN104915294B (en) * | 2015-06-23 | 2019-03-29 | 北京玉华骢科技股份有限公司 | A kind of program feature counter and method based on key point |
| US10896115B2 (en) * | 2019-02-05 | 2021-01-19 | Oracle International Corporation | Investigation of performance bottlenecks occurring during execution of software applications |
| US11593255B2 (en) * | 2020-07-31 | 2023-02-28 | Bank Of America Corporation | Mobile log heatmap-based auto testcase generation |
Family Cites Families (6)
| Publication number | Priority date | Publication date | Assignee | Title |
|---|---|---|---|---|
| US3702005A (en) * | 1971-05-24 | 1972-10-31 | United Data Services | Execution time analyzer |
| US4742467A (en) * | 1984-05-04 | 1988-05-03 | Analysts International Corporation | Automated programming system for machine creation of applications program source code from non-procedural terminal input |
| US4782461A (en) * | 1984-06-21 | 1988-11-01 | Step Engineering | Logical grouping of facilities within a computer development system |
| US4845665A (en) * | 1985-08-26 | 1989-07-04 | International Business Machines Corp. | Simulation of computer program external interfaces |
| US4809170A (en) * | 1987-04-22 | 1989-02-28 | Apollo Computer, Inc. | Computer device for aiding in the development of software system |
| US4864569A (en) * | 1987-11-25 | 1989-09-05 | Westinghouse Electric Corp. | Software verification and validation configuration management system |
-
1990
- 1990-03-01 DE DE69024515T patent/DE69024515T2/en not_active Expired - Fee Related
- 1990-03-01 EP EP90302179A patent/EP0390339B1/en not_active Expired - Lifetime
- 1990-03-28 JP JP2080594A patent/JP2783641B2/en not_active Expired - Lifetime
-
1992
- 1992-03-25 US US07/859,290 patent/US5168563A/en not_active Expired - Lifetime
Also Published As
| Publication number | Publication date |
|---|---|
| DE69024515T2 (en) | 1996-05-15 |
| US5168563A (en) | 1992-12-01 |
| DE69024515D1 (en) | 1996-02-15 |
| JP2783641B2 (en) | 1998-08-06 |
| EP0390339A2 (en) | 1990-10-03 |
| EP0390339A3 (en) | 1991-10-09 |
| JPH02281342A (en) | 1990-11-19 |
Similar Documents
| Publication | Publication Date | Title |
|---|---|---|
| US5168563A (en) | Various possible execution paths measurement and analysis system for evaluating before writing source codes the efficiency performance of software designs | |
| US7058588B2 (en) | Dependency-based work flow integration and reduction | |
| US4847761A (en) | Automated bill of material | |
| US5930806A (en) | Method and system for data migration from network database to relational database | |
| US5706405A (en) | System and method for the design of software systems using a knowledge base | |
| US5440742A (en) | Two-neighborhood method for computing similarity between two groups of objects | |
| Poston | Automated testing from object models | |
| US5303147A (en) | Computer aided planning method and system | |
| US6212677B1 (en) | Generating a natural language specification of a computer program by generating an intermediate expression table based on a flow chart from analyzed syntax of the program | |
| Motta et al. | Solving VT in VITAL: a study in model construction and knowledge reuse | |
| Mancl et al. | A study of the impact of C++ on software maintenance | |
| Heinrich et al. | A methodology for domain-spanning change impact analysis | |
| Nesi | Managing OO projects better | |
| US20130096894A1 (en) | Automatic insertion point identification in model merging operations | |
| Rauterberg et al. | Benefits of user-oriented software development based on an iterative cyclic process model for simultaneous engineering | |
| Rombach et al. | How to assess a software process modeling formalism from a project member's point of view | |
| Zülch et al. | Simulating alternative organizational structures of production systems | |
| Davis | System testing: Implications of requirements specifications | |
| Hood et al. | A modular structure for a highly detailed model of semiconductor manufacturing | |
| Ince | Software metrics | |
| Ramamoorthy | Distributed techniques in software systems integration | |
| Baird | APET—A versatile tool for estimating computer application performance | |
| Yancey et al. | Implementation of rule-based technology in a shop scheduling system | |
| Dakhli et al. | A three layers software development method: Foundations and definition | |
| Kruth et al. | An interactive CAPP kernel based on a blackboard system architecture |
Legal Events
| Date | Code | Title | Description |
|---|---|---|---|
| PUAI | Public reference made under article 153(3) epc to a published international application that has entered the european phase |
Free format text: ORIGINAL CODE: 0009012 |
|
| AK | Designated contracting states |
Kind code of ref document: A2 Designated state(s): DE FR GB |
|
| PUAL | Search report despatched |
Free format text: ORIGINAL CODE: 0009013 |
|
| AK | Designated contracting states |
Kind code of ref document: A3 Designated state(s): DE FR GB |
|
| 17P | Request for examination filed |
Effective date: 19911204 |
|
| 17Q | First examination report despatched |
Effective date: 19940223 |
|
| GRAA | (expected) grant |
Free format text: ORIGINAL CODE: 0009210 |
|
| AK | Designated contracting states |
Kind code of ref document: B1 Designated state(s): DE FR GB |
|
| REF | Corresponds to: |
Ref document number: 69024515 Country of ref document: DE Date of ref document: 19960215 |
|
| ET | Fr: translation filed | ||
| PLBE | No opposition filed within time limit |
Free format text: ORIGINAL CODE: 0009261 |
|
| STAA | Information on the status of an ep patent application or granted ep patent |
Free format text: STATUS: NO OPPOSITION FILED WITHIN TIME LIMIT |
|
| 26N | No opposition filed | ||
| PGFP | Annual fee paid to national office [announced via postgrant information from national office to epo] |
Ref country code: FR Payment date: 19980221 Year of fee payment: 9 |
|
| PGFP | Annual fee paid to national office [announced via postgrant information from national office to epo] |
Ref country code: DE Payment date: 19980223 Year of fee payment: 9 |
|
| PGFP | Annual fee paid to national office [announced via postgrant information from national office to epo] |
Ref country code: GB Payment date: 19980226 Year of fee payment: 9 |
|
| PG25 | Lapsed in a contracting state [announced via postgrant information from national office to epo] |
Ref country code: GB Free format text: LAPSE BECAUSE OF NON-PAYMENT OF DUE FEES Effective date: 19990301 |
|
| GBPC | Gb: european patent ceased through non-payment of renewal fee |
Effective date: 19990301 |
|
| PG25 | Lapsed in a contracting state [announced via postgrant information from national office to epo] |
Ref country code: FR Free format text: LAPSE BECAUSE OF NON-PAYMENT OF DUE FEES Effective date: 19991130 |
|
| REG | Reference to a national code |
Ref country code: FR Ref legal event code: ST |
|
| PG25 | Lapsed in a contracting state [announced via postgrant information from national office to epo] |
Ref country code: DE Free format text: LAPSE BECAUSE OF NON-PAYMENT OF DUE FEES Effective date: 20000101 |