EP0386899B1 - Process for controlling aluminium smelting cells - Google Patents
Process for controlling aluminium smelting cells Download PDFInfo
- Publication number
- EP0386899B1 EP0386899B1 EP90301748A EP90301748A EP0386899B1 EP 0386899 B1 EP0386899 B1 EP 0386899B1 EP 90301748 A EP90301748 A EP 90301748A EP 90301748 A EP90301748 A EP 90301748A EP 0386899 B1 EP0386899 B1 EP 0386899B1
- Authority
- EP
- European Patent Office
- Prior art keywords
- cell
- resistance
- slope
- smoothed
- heat
- Prior art date
- Legal status (The legal status is an assumption and is not a legal conclusion. Google has not performed a legal analysis and makes no representation as to the accuracy of the status listed.)
- Expired - Lifetime
Links
- 238000000034 method Methods 0.000 title claims abstract description 49
- 230000008569 process Effects 0.000 title claims abstract description 31
- 229910052782 aluminium Inorganic materials 0.000 title claims abstract description 21
- 239000004411 aluminium Substances 0.000 title claims abstract description 20
- XAGFODPZIPBFFR-UHFFFAOYSA-N aluminium Chemical compound [Al] XAGFODPZIPBFFR-UHFFFAOYSA-N 0.000 title claims abstract description 20
- 238000003723 Smelting Methods 0.000 title claims abstract description 12
- PNEYBMLMFCGWSK-UHFFFAOYSA-N aluminium oxide Inorganic materials [O-2].[O-2].[O-2].[Al+3].[Al+3] PNEYBMLMFCGWSK-UHFFFAOYSA-N 0.000 claims abstract description 71
- 238000007792 addition Methods 0.000 claims abstract description 24
- 230000008859 change Effects 0.000 claims abstract description 18
- 238000012544 monitoring process Methods 0.000 claims abstract description 12
- 238000004364 calculation method Methods 0.000 claims description 30
- 238000010079 rubber tapping Methods 0.000 claims description 9
- 239000003792 electrolyte Substances 0.000 claims description 8
- 238000011112 process operation Methods 0.000 claims description 8
- 238000004519 manufacturing process Methods 0.000 abstract description 9
- 230000007774 longterm Effects 0.000 abstract description 8
- KLZUFWVZNOTSEM-UHFFFAOYSA-K Aluminium flouride Chemical compound F[Al](F)F KLZUFWVZNOTSEM-UHFFFAOYSA-K 0.000 description 24
- 238000012360 testing method Methods 0.000 description 20
- 230000000694 effects Effects 0.000 description 13
- 230000006870 function Effects 0.000 description 12
- 229910052751 metal Inorganic materials 0.000 description 12
- 239000002184 metal Substances 0.000 description 12
- 230000033228 biological regulation Effects 0.000 description 10
- 230000009467 reduction Effects 0.000 description 8
- 238000010586 diagram Methods 0.000 description 7
- 230000017525 heat dissipation Effects 0.000 description 7
- 230000004044 response Effects 0.000 description 7
- 238000011217 control strategy Methods 0.000 description 5
- 238000005259 measurement Methods 0.000 description 5
- 238000006243 chemical reaction Methods 0.000 description 4
- 238000013461 design Methods 0.000 description 4
- OKTJSMMVPCPJKN-UHFFFAOYSA-N Carbon Chemical compound [C] OKTJSMMVPCPJKN-UHFFFAOYSA-N 0.000 description 3
- 229910052799 carbon Inorganic materials 0.000 description 3
- 230000015556 catabolic process Effects 0.000 description 3
- 230000001186 cumulative effect Effects 0.000 description 3
- 230000001934 delay Effects 0.000 description 3
- 238000001914 filtration Methods 0.000 description 3
- 239000000203 mixture Substances 0.000 description 3
- 238000005580 one pot reaction Methods 0.000 description 3
- 241001135555 Sandfly fever Sicilian virus Species 0.000 description 2
- 230000009471 action Effects 0.000 description 2
- 238000013459 approach Methods 0.000 description 2
- 230000008901 benefit Effects 0.000 description 2
- 230000036755 cellular response Effects 0.000 description 2
- 125000004122 cyclic group Chemical group 0.000 description 2
- 230000003247 decreasing effect Effects 0.000 description 2
- 230000006735 deficit Effects 0.000 description 2
- 238000011161 development Methods 0.000 description 2
- 230000018109 developmental process Effects 0.000 description 2
- 238000004090 dissolution Methods 0.000 description 2
- 238000009826 distribution Methods 0.000 description 2
- 230000008030 elimination Effects 0.000 description 2
- 238000003379 elimination reaction Methods 0.000 description 2
- 238000005516 engineering process Methods 0.000 description 2
- 230000008014 freezing Effects 0.000 description 2
- 238000007710 freezing Methods 0.000 description 2
- 239000007788 liquid Substances 0.000 description 2
- 230000007246 mechanism Effects 0.000 description 2
- 238000010561 standard procedure Methods 0.000 description 2
- 230000001960 triggered effect Effects 0.000 description 2
- 230000005856 abnormality Effects 0.000 description 1
- 230000015572 biosynthetic process Effects 0.000 description 1
- 238000004422 calculation algorithm Methods 0.000 description 1
- 229910001610 cryolite Inorganic materials 0.000 description 1
- 238000013016 damping Methods 0.000 description 1
- 238000000354 decomposition reaction Methods 0.000 description 1
- 230000007423 decrease Effects 0.000 description 1
- 230000003111 delayed effect Effects 0.000 description 1
- 230000002939 deleterious effect Effects 0.000 description 1
- 230000001419 dependent effect Effects 0.000 description 1
- 238000009472 formulation Methods 0.000 description 1
- 238000010438 heat treatment Methods 0.000 description 1
- 230000006872 improvement Effects 0.000 description 1
- 230000000977 initiatory effect Effects 0.000 description 1
- 230000003993 interaction Effects 0.000 description 1
- 230000002452 interceptive effect Effects 0.000 description 1
- 239000000463 material Substances 0.000 description 1
- 238000012821 model calculation Methods 0.000 description 1
- 238000005457 optimization Methods 0.000 description 1
- 230000002265 prevention Effects 0.000 description 1
- 230000035755 proliferation Effects 0.000 description 1
- 230000009257 reactivity Effects 0.000 description 1
- 231100000817 safety factor Toxicity 0.000 description 1
- 230000001932 seasonal effect Effects 0.000 description 1
Images







Classifications
-
- C—CHEMISTRY; METALLURGY
- C25—ELECTROLYTIC OR ELECTROPHORETIC PROCESSES; APPARATUS THEREFOR
- C25C—PROCESSES FOR THE ELECTROLYTIC PRODUCTION, RECOVERY OR REFINING OF METALS; APPARATUS THEREFOR
- C25C3/00—Electrolytic production, recovery or refining of metals by electrolysis of melts
- C25C3/06—Electrolytic production, recovery or refining of metals by electrolysis of melts of aluminium
- C25C3/20—Automatic control or regulation of cells
Definitions
- This invention relates to improvements in the automated control of electrolytic smelting cells for the production of aluminium.
- the control of electrolytic cells in the production of aluminium is influenced by both short term and long term process parameter changes.
- bath superheat, alumina concentration and anode to cathode distance (ACD) need constant monitoring, while longer term control is required for metal depth and the composition and volume of the electrolyte in the cell.
- Operating abnormalities also require attention, such as sludging, anode effects and their frequency, and the short circuiting of the current between the anodes and the metal pad.
- the resistance/alumina concentration curve is used to control alumina concentration on point feed cells.
- a linear model of the cell resistance variation is set up using the resistance slope as a parameter. By fitting the model to continuous resistance measurements, the slope is estimated.
- this strategy does not ensure that the resulting slope is related only to alumina concentration, in fact it assumes this one to one relationship.
- Anode movement is included in the fitted algorithm and other disturbances are filtered by reducing the gain of the fitting functions when they occur. This procedure is very complex and could be prone to error.
- the strategy does not attempt to maintain heat balance within the cell.
- US-A-3812024 (Goodnow et al.) describes a method of controlling an alumina reduction cell wherein a base level resistance R B and a smoothed cell resistance R1 are periodically determined from the electrical parameters of the cell, the difference ⁇ R between the lowest R B value and R1 is periodically determined, and said difference is compared with a criterion difference value ⁇ R* for feeding alumina to the cell. When the measured difference exceeds ⁇ R*, alumina is fed to the cell. The criterion difference ⁇ R* is corrected for fluctuations in cell resistance, cell voltage and cell current.
- US-A-4425201 (Wilson et al ) describes a method for improved alumina mass balance control in aluminum electrolytic cells.
- the method comprises the steps of: (i) making multiple readings of cell resistance over time; (ii) carrying out a linear least-squares regression on the resistance measurements to determine an average rate of change g of the resistance and a least-squares correlation coefficient h; and (iii) comparing the average rate of change of the resistance g with a predetermined limiting value, and carrying out an alumina feed if the value of g exceeds the predetermined value and the correlation coefficient h also exceeds a predetermined value.
- US-A-4425201 deals with discontinuities in the cell resistance due to operator interventions or anode bridge adjustments by increasing the minimum value of the correlation coefficient h when an operator intervention is detected.
- Accidental break/feed operations are further reduced by defining a maximum rate of change g of the cell resistance. If the measured g exceeds the maximum value, then no break/feed operation is carried out because it is assumed that the high value of g is due to anode bridge adjustment or to operator intervention.
- DE-A-2335028 describes a method for controlling the heat balance of an aluminium smelting cell.
- the method comprises the steps of: measuring the electrical energy supplied to the cell over successive time intervals; comparing the measured energy with predetermined optimum energy supply for the same interval; adding any difference between the measured and predetermined energy values, with appropriate sign, to a cumulative total; and, when the cumulative total exceeds a predetermined value, increasing or decreasing the average interpolar distance to achieve a rate of energy supply more nearly equal to the desired rate.
- the present invention provides a process to control the operation of an aluminium smelting cell, comprising the steps of:
- the monitored cell process operations cause significant variations in the calculated resistance and the resultant resistance slope such that the latter parameter no longer provides an accurate reflection of the alumina concentration in the cell.
- the resistance value By delaying calculation during the process event for a predetermined time sufficient for the resistance value to again become relatively stable, and then recommencing calculation of the resistance slope, an 'intelligent' smoothed resistance slope can be obtained, and the electrolyte/alumina mass balance may be maintained notwithstanding the effect of the process operation.
- the predetermined time delay will vary having regard to the detected operation since different operations have different effects on the stability of the resistance value.
- the following delays have been found to be satisfactory after completion of each operation: Operation Delay ACD change : 60 sec. Alumina feed : 60 sec. Anode set : 120 sec. Beam raise : 120 sec. Bath Addition : 300 sec.
- the resistance of the cell is calculated using a known formula which compensates for the continuously calculated back EMF of the cell, as will be described further below.
- the resistance values are filtered using digital filtration techniques in a manner which smooths random and higher frequency pot noise while adequately responding to step changes and the resistance disturbances. This filtered resistance is used for automatic resistance control.
- the resistance slope is calculated from raw (unfiltered) resistance values as described further below and similar digital filtration is used to continuously calculate smoothed resistance slope values.
- the smoothed resistance slope is searched for values exceeding a predetermined slope which is chosen to indicate concentration polarisation and alumina depletion. Different forms of alumina search may be used, and these are described in greater detail in the following specification.
- the invention also provides a system for controlling the operation of an aluminium smelting cell comprising suitable means for performing each of the steps defined above.
- the cell voltage is preferably monitored to determine the existence of low frequency or high frequency noise in the voltage system.
- the invention also provides a system for controlling the operation of an aluminium smelting cell comprising suitable means programmed for performing each of the steps defined above.
- the smoothed resistance slope thresholds for low alumina concentration are raised.
- the critical slope threshold for one pot group under test was 0.025 ⁇ /min. at voltage noise levels below the noise threshold of 0.25 ⁇ /min.
- the base slope threshold is ramped by an amount proportional to the amount by which the noise signal exceeds the predetermined threshold.
- the maximum increment of the ramp is 0.05 ⁇ /min. and occurs at a low frequency noise level of 0.50 ⁇ /min.
- the filtered slope is again compared with the incremented threshold and if it is found to be greater than the threshold, the alumina inventory is then considered to determine whether or not the cell is overfed. If this determination is in the negative, the control system instructs a specific form of alumina feeding cycle to be effected - this is either an end of search or an anode effect prediction feeding cycle.
- control system embodying the invention is shown in simplified flow diagram form. Before proceeding with a detailed description of the control system, a general overview of the system will be provided.
- One aim of the control system is to maintain a cell at thermal steady state. That is, the rate of heat dissipation from the cell should be maintained at a constant, target value.
- the dynamics of the reduction cell and control system meant that maintaining an 'instantaneous' energy balance was not possible.
- the energy absorbed by a cell was calculated over ten minute intervals and anode beam movements were carried out at five minute intervals.
- responses to events were delayed by up to 15 minutes.
- the rate and range of target resistance changes were limited, and the line current variation for subsequent ten minute periods did not allow accurate elimination of an energy imbalance.
- a second additional component allowed control of the magnitude of the various discontinuous energy responses. This was necessary in order to model the thermal response of the electrolyte to localised disturbances or material additons. For example, the extra heat needed at an anode after setting is supplied to the bath volume throughout the cell and may have deleterious effects elsewhere. Also the process engineer may wish to reduce the amount of anode beam movement by damping the cell response to individual events. As a result, coefficients (range 0 to 1) were introduced to tune the instantaneous calculations (thus system responses). Energy requirements for feed, setting and additions were divided into instantaneous and background (constant) power inputs. The various background power inputs were calculated from:-
- the final necessary component of the control system was a feed control technique which permitted regular anode beam movement while monitoring alumina concentration - thereby allowing the cell energy balance to be always under control.
- Search techniques were developed with these functions, where the target alumina concentration was detected via a continuously calculated slope of resistance.
- No scheduled anode effects (AEs) were included in the feed control strategy.
- the associated large, uncontrolled energy inputs to the process would have been in conflict with the control philosophy, and are difficult to compensate for in the thermal balance.
- control system has three basic strings, the first two affecting the short term heat and mass balance of the cell, and the third affecting the medium to long term heat balance of the cell.
- the control system is implemented using a computer for monitoring the functions of the cell or pot (pot computer), such as a Micromac 6000 computer suitable for the aluminium industry, and a supervisory computer for receiving data from each of a number of pot computers and for instructing the pot computers to perform various functions.
- Initial input data to the computers includes target heat dissipation Q T , the specific current efficiency CE for the cell being controlled, the bath resistivity target range for the cell, thermodynamics data, as described in greater detail above, relating to the cell and a 'typical' back emf (EMF) of the cell calculated by regression in a known manner.
- Q T target heat dissipation
- CE specific current efficiency
- CE bath resistivity target range
- EMF 'typical' back emf
- the essential operating parameters of the cell are dynamically monitored, and these parameters include: the voltage of the cell V, the current of the cell I, alumina additions, cell bath additions, operations such as anode setting, beam raising, manual alumina addition and oreing up, and anode to cathode distance (ACD) movements.
- the resistance (R) of the cell is continually calculated from (V - EMF)/I
- the cell resistivity ⁇ is calculated from ( ⁇ R/ ⁇ ACD)A, where A is the estimated area of the anodes in the cell.
- the pot computer calculates the level of noise in the voltage signal, 0 to 0.1 Hz indicating low frequency noise and 0.1 to 1 Hz indicating higher frequency noise, and further calculates the filtered rate of change of resistance with time (smoothed resistance slope) every second.
- the basic steps in the filtered slope calculation for each time cycle are:
- Delay periods associated with other operations include: When the pot is put on "manual" for any reason, a delay of 30 seconds is introduced. When alumina is manually added, a delay of 120 seconds is introduced. Similarly when oreing-up is performed, a delay of 60 seconds is introduced.
- a pre-set delay is also implemented when step ii) of the slope calculation fails to give in-range slopes on a given number of consecutive tests. This is intended to trap the gross resistance disturbances not initiated/expected by the pot computer (e.g. sludging may cause an unpredictable resistance response).
- alumina search techniques are available on the system, stop feed search (SFS) and feed search (FDS). Both techniques terminate search on a threshold value of increasing resistance slope, implying low end point alumina concentrations and both techniques allow heat balance regulation (anode movement)during the search. The special features of each are described below.
- This technique is essentially a stop feed during which the filtered resistance slope is checked every second for values above the critical slope (critslope) indicating alumina depletion. Once the critical slope is attained on a sufficient number of consecutive readings, search is terminated by initiation of an end of search feed followed by the resumption of the previously nominated cycle (see Figure 3).
- the search can also be terminated (classed an unsuccessful search) under the following circumstances:
- the SFS technique has been applied to both breaker bar and point feed cells.
- the strategy involves following resistance slope before and during underfeeding and overfeeding periods until a target alumina concentration is achieved.
- the stages of the searching routine are as follows:
- Anode effect prediction is provided by a check on the filtered resistance slope every second during normal feeding of the cell (Fig. 3). If it exceeds a pre-set AEP slope an AEP feed cycle is initiated immediately to avoid an anode effect.
- This high resistance slope results from the critical depletion of alumina concentration in the cell during periods when alumina searching is not occurring. Resistance changes due to operations like setting, tapping and bath additions are removed by the filtered slope calculation. However, resistance changes due to metal pad instability are included in the filtered slope. Hence the pre-set AEP slope is increased if excessive low frequency noise is detected, as discussed further below, to reduce the likelihood that the system will trigger an AEP feeding cycle due to low frequency noise. It will be appreciated that low frequency, cyclic voltage variations (of less than one cycle per second) are sometimes observed due to instability in the liquid aluminium pad. The rates of resistance increase associated with these cycles can, in the case of severe instability, exceed the resistance slope thresholds above, triggering alumina feeding when this is not warranted.
- the slope thresholds for both end of search and AEP are increased by a predetermined amount when low frequency voltage noise is detected above a certain amplitude (in micro-ohms).
- the critical slope threshold for one pot under test was 0.035 u ⁇ /min. and the voltage noise threshold was 0.25 ⁇ /min.
- the critical slope threshold is ramped by an amount proportional to the amount by which the noise signal exceeds the predetermined threshold.
- the maximum increment of the ramp is 0.05 u ⁇ /min. and occurs at a low frequency noise level of 0.50 ⁇ /min.
- the filtered slope is again compared with the threshold and if it is found to be greater than the threshold, the alumina inventory is then considered to determine whether or not the cell is overfed. If this determination is in the negative, the control system instructs an AEP alumina feeding cycle to be effected.
- the operation of AEP can also be stopped for a defined period after an AEP prediction as further protection against excessive AEP triggered feeds during periods of cell instability.
- the main function of the low-frequency noise calculation is to detect noise generated by metal pad instability.
- a group of consecutive resistances are summed, then averaged.
- a ring buffer containing a time sequence of these averages are then stored for some period of time (usually less than 2 AVC periods).
- Figure 4B is an example of the resulting data in a computer; essentially it is a resistance vs time plot with the high-frequency noise removed.
- the low frequency noise is the sum of absolute differences in adjacent resistance averages minus the absolute difference between the newest and oldest averages, divided by the time interval.
- AR i is the average resistance at time t i
- Examples of idealized curves and their noise are shown in Figures 4C to E.
- the heat supplied and the heat required for aluminium production are calculated from the dynamic inputs described above (cell voltage and current, alumina additions, bath chemistry additions, operations and anode movements) and the heat available (Q AVAIL ) for dissipation by the cell is also calculated.
- the difference between available heat and the previously determined target heat (Q T ) is integrated with respect to time and from this integral a running heat inventory is calculated.
- the target resistance (R TARGET ) derived in the manner described above from Q TARGET , is regularly updated on the pot computer to adjust the heat balance of the cell to minimize the imbalance represented by the heat inventory integral.
- the target resistance must lie between the specified minimum and maximum allowable limits.
- the updated resistance target consistently falls above or below one of the allowable limits, disallowing the regulation of resistance as described above, the operating amperage, ore cover level, or bath and metal levels are reviewed so that a more flexible region of the operating envelope can be chosen for the cell.
- the set point, R TARGET is updated at regular intervals on the basis of short range heat balance calculations.
- the short range calculations require the following information:
- the calculated value of the available power dissipation is compared to the target value for the cell and the thermal imbalance ⁇ Q obtained.
- the target value (Q TARGET ) is initially determined from a steady-state computer thermal model prediction and cell operating diagram and then updated imbalance is integrated and converted directly into a ⁇ R and an R TARGET using the average value of amperage and the previous target resistance respectively.
- long term heat balance control is used to continually update the target power dissipation Q TARGET through trends in bath resistivity data. This prevents longer term changes in bath thermal conditions and chemistry which occur through breakdown of ore cover, changes in current efficiency or amperage, and variations in anode carbon quality with respect to reactivity, thermal conductivity and anode spike formation.
- Bath resistivity data is used to detect all chemistry and thermal conditions in real time.
- Bath resistivity is calculated at approximately hourly intervals, using controlled beam movements, with beam movement measured in the usual manner by a shaft counter.
- bath resistivity is calculated from the known relationship.
- R TOT ⁇ eff ACD A A + ⁇ R FIXED
- bath resistivity ⁇ eff ⁇ R.A A ⁇ ACD
- ⁇ R FIXED is the sum of the contribution of resistance values due to ohmic effects and possible reaction decomposition effects. This value is assumed to be constant for changes in ACD.
- a A is the nominal area of the anode and is assumed to be constant
- ⁇ ACD is measured using the shaft counter
- ⁇ R is the difference between cell resistance before and after the 20 decisecond buss-up.
- the bath resistivity and its rate of change is a good indication of the concentration of AlF3.
- the initial or starting value for the target heat dissipation Q T is derived as follows.
- Thermal model calculations (Finite element prediction of isotherms and flows within the cell in question) are used to determine the steady-state level of heat loss required from a particular cell design (eg the test pot referred to above is a Type VI cell design and requires 220 - 230 kW depending on metal level and alumina cover). This target or 'design heat loss' is Q CELL .
- the process energy requirement for aluminium production can be calculated in a known manner for the cell once the line amperage is known:
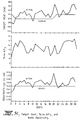
- Figures 5A and 5B show selected pot parameters over 2 months operation of a reduction cell, with constant Q TARGET .
- the % XS AlF3 varied significantly over this period and ⁇ and d ⁇ dt are seen to be good indicators of this. Twice during the period shown, manual increases to the power input were made to increase the cell superheat and reduce the % XS AlF3 (times 'B' and 'C'). In both cases high values of ⁇ and d ⁇ dt were evident before manual intervention.
- Figure 7 shows the calculated heat absorbed by the cell, broken down into it's four operational components. Fluctuations in the power required for reaction (metal production) (Fig. 7a) were due to line amperage variations. The power absorbed by alumina feeding (Fig. 7b) had a strong cyclic pattern. This pattern is accentuated because the alumina searches (SFS) included cessation of feeding (for the day shown). Figure 7c shows the effect of replacing two anodes. For setting, the energy distribution was spread over 5 hours; this was based on trial data and computer modelling of the heat absorbed by the new blocks. Figure 7d includes the energy input for a 15kg bag of AlF3. Note that 50% of feed power, 50% of setting power, and 20% of the additions power were supplied as constant background inputs, while the remainder in each case was triggered by the respective events.
- Figure 8a The calculation of the total absorbed energy is shown in Figure 8a.
- Figure 8b shows the power available for dissipation from the cell as heat (Eqn 1). Note the target dissipation rate of 240kW for this cell.
- the target and calculated actual heat dissipation clearly show the heat deficit/excess in Figure 8c.
- the cell had an energy imbalance for periods up to 2 hours. This was primarily due to the power input constraints imposed by the cell resistance control band.
- Figure 8d shows the control band of 32.5 to 38 uOhm used over the 24 hour period. Anode beam movements are clearly larger, and more frequent, than for control systems previously reported in the literature. This reflects the extent of thermal disturbance which is imposed on most reduction cells in a single day.
- Figure 9 illustrates the behaviour of the alumina feed control component of the system during a typical, successful stop feed search (SFS).
- the search period is marked in Fig. 8d.
- ACD anode cathode distance
- cell resistance cell resistance
- slope of resistance The centre channel bath temperature, measured at ten minute intervals, is also presented.
- the change in ACD was transduced using the rotation shaft counter (proximity switches) on the anode beam drive shaft.
- the resistance slope (Fig. 9d) was zeroed at the start and end of the SFS; the end of search slope was 0.025 uOhm/min.
- the search lasted approximately 90 minutes, and there was substantial beam movement throughout.
- the high resistance/ACD at the start of searching was due to the energy requirement of a 23kg alumina feed immediately beforehand. Once this energy was supplied, the control system reduced the power input.
- the control approach allowed long SFSs to be scheduled without the bath temperature or superheat increasing substantially. This allowed back-feeding and depletion of alumina to the target level.
- the stable bath temperature is clearly shown in Figure 9c, although there was a temperature fall caused by the feed before SFS.
- a bath temperature change of only +/-4C was measured during SFS. While there is some fluctuation in the dynamics of the resistance slope, the underlying trend and threshold values were reliable.
- the SFS technique achieved good feed control, consistently, with [ 0.3 AEs/day.
- the control system embodying the invention maintains a target rate of heat loss from a reduction cell via calculation of the energy absorbed by the process.
- the trial results show that the system made regular anode beam movements while maintaining good thermal balance on the cell.
- the control system described here is a building block for the optimization of reduction cell efficiency via understanding and reducing variations in the cell thermal balance.
Landscapes
- Chemical & Material Sciences (AREA)
- Engineering & Computer Science (AREA)
- Chemical Kinetics & Catalysis (AREA)
- Electrochemistry (AREA)
- Materials Engineering (AREA)
- Metallurgy (AREA)
- Organic Chemistry (AREA)
- Electrolytic Production Of Metals (AREA)
- Manufacture And Refinement Of Metals (AREA)
- Revetment (AREA)
- Steering-Linkage Mechanisms And Four-Wheel Steering (AREA)
- Treatment Of Sludge (AREA)
- Crystals, And After-Treatments Of Crystals (AREA)
- Waste-Gas Treatment And Other Accessory Devices For Furnaces (AREA)
- Crucibles And Fluidized-Bed Furnaces (AREA)
Abstract
Description
- This invention relates to improvements in the automated control of electrolytic smelting cells for the production of aluminium.
- The control of electrolytic cells in the production of aluminium is influenced by both short term and long term process parameter changes. In the short term, bath superheat, alumina concentration and anode to cathode distance (ACD) need constant monitoring, while longer term control is required for metal depth and the composition and volume of the electrolyte in the cell. Operating abnormalities also require attention, such as sludging, anode effects and their frequency, and the short circuiting of the current between the anodes and the metal pad.
- The complexity of the interrelationships between the dependent and independent variables in the smelting process are illustrated in
Chapter 9 of "Aluminium Smelter Technology" - Grjotheim and Welch - Aluminium - Verlag, 1988, and this chapter provides a useful summary of the currently utilised control strategies. This summary and the proliferation of literature on the subject further illustrate the complexity of the problem and the absence of a strategy that provides a satisfactory level of control resulting in constantly high efficiency levels. - Numerous examples of control strategy proposals are also to be found in the patent literature. Recent examples include U.S. Patent No. 4,654,129 Leroy which describes a process involving periods of over supply and under supply to maintain the alumina concentration in the cell within a narrow range by monitoring the rate of change of the resistance of the cell. This process relies for its success on the use of point feeding of alumina to the cell, and it is not therefore useful for cells without point feeders. Also, since in this strategy it is critical to maintain the alumina concentration within a narrow range, the strategy suffers if the concentration moves outside that range and it is often difficult to restore the system to its optimum operating conditions.
- U.S. Patents 4,008,142 and 4,024,034 Doring et al, use the concept of constant anode-cathode distance to adjust cell resistance according to the known or assumed electrochemical voltage breakdown. Anode-cathode distance adjustment is made in cases where current efficiency (by metal production measurement) is less than expected theoretically. Automatic adjustment of voltage/cell resistance in response to noise on the signal is also indicated. However, no attempt is made to calculate the heat or alumina balances or to make furnace adjustments on this basis, with the exception of adjustment of cell resistance on the basis of long term running metal production figures. This does not constitute a calculation of the energy balance or process energy requirement.
- In U.S. Patent 4,766,552 Aalbu et al, the resistance/alumina concentration curve is used to control alumina concentration on point feed cells. A linear model of the cell resistance variation is set up using the resistance slope as a parameter. By fitting the model to continuous resistance measurements, the slope is estimated. However, this strategy does not ensure that the resulting slope is related only to alumina concentration, in fact it assumes this one to one relationship. Anode movement is included in the fitted algorithm and other disturbances are filtered by reducing the gain of the fitting functions when they occur. This procedure is very complex and could be prone to error. In addition, the strategy does not attempt to maintain heat balance within the cell.
- US-A-3812024 (Goodnow et al.) describes a method of controlling an alumina reduction cell wherein a base level resistance RB and a smoothed cell resistance R₁ are periodically determined from the electrical parameters of the cell, the difference ΔR between the lowest RB value and R₁ is periodically determined, and said difference is compared with a criterion difference value ΔR* for feeding alumina to the cell. When the measured difference exceeds ΔR*, alumina is fed to the cell. The criterion difference ΔR* is corrected for fluctuations in cell resistance, cell voltage and cell current.
- US-A-4425201 (Wilson et al) describes a method for improved alumina mass balance control in aluminum electrolytic cells. The method comprises the steps of: (i) making multiple readings of cell resistance over time; (ii) carrying out a linear least-squares regression on the resistance measurements to determine an average rate of change g of the resistance and a least-squares correlation coefficient h; and (iii) comparing the average rate of change of the resistance g with a predetermined limiting value, and carrying out an alumina feed if the value of g exceeds the predetermined value and the correlation coefficient h also exceeds a predetermined value.
- The method of US-A-4425201 deals with discontinuities in the cell resistance due to operator interventions or anode bridge adjustments by increasing the minimum value of the correlation coefficient h when an operator intervention is detected. Accidental break/feed operations are further reduced by defining a maximum rate of change g of the cell resistance. If the measured g exceeds the maximum value, then no break/feed operation is carried out because it is assumed that the high value of g is due to anode bridge adjustment or to operator intervention.
- DE-A-2335028 describes a method for controlling the heat balance of an aluminium smelting cell. The method comprises the steps of: measuring the electrical energy supplied to the cell over successive time intervals; comparing the measured energy with predetermined optimum energy supply for the same interval; adding any difference between the measured and predetermined energy values, with appropriate sign, to a cumulative total; and, when the cumulative total exceeds a predetermined value, increasing or decreasing the average interpolar distance to achieve a rate of energy supply more nearly equal to the desired rate.
- It is an object of the present invention to provide an improved process for controlling aluminium smelting cells in which the mass balance of the cell is comprehensively controlled.
- The present invention provides a process to control the operation of an aluminium smelting cell, comprising the steps of:
- (i) continuously monitoring cell voltage and current,
- (ii) calculating the resistance of the cell from the monitored cell voltage and current,
- (iii) calculating the rate of change of cell resistance (raw resistance slope) and a smoothed value of said resistance slope,
- (iv) utilising the smoothed resistance slope values to maintain mass balance in the cell, including the step of searching the smoothed resistance slope for values exceeding a predetermined slope chosen to indicate alumina depletion.
- (v) monitoring cell process operations including alumina additions, electrolyte bath additions, anode changes, tapping, beam raising and anode beam movement,
- (vi) delaying the calculation of resistance slope and smoothed resistance slope for a predetermined time when any one of said monitored cell process operations occurs, and
- (vii) recalculating said cell resistance slope and smoothed resistance slope after said predetermined time delay so that the smoothed slope is unaffected by process changes with the exception of alumina depletion.
- It will be appreciated that the monitored cell process operations cause significant variations in the calculated resistance and the resultant resistance slope such that the latter parameter no longer provides an accurate reflection of the alumina concentration in the cell. By delaying calculation during the process event for a predetermined time sufficient for the resistance value to again become relatively stable, and then recommencing calculation of the resistance slope, an 'intelligent' smoothed resistance slope can be obtained, and the electrolyte/alumina mass balance may be maintained notwithstanding the effect of the process operation.
- The predetermined time delay will vary having regard to the detected operation since different operations have different effects on the stability of the resistance value. In one particular cell (Type VI design), the following delays have been found to be satisfactory after completion of each operation:
Operation Delay ACD change : 60 sec. Alumina feed : 60 sec. Anode set : 120 sec. Beam raise : 120 sec. Bath Addition : 300 sec. - In a preferred form, the resistance of the cell is calculated using a known formula which compensates for the continuously calculated back EMF of the cell, as will be described further below. The resistance values are filtered using digital filtration techniques in a manner which smooths random and higher frequency pot noise while adequately responding to step changes and the resistance disturbances. This filtered resistance is used for automatic resistance control. The resistance slope is calculated from raw (unfiltered) resistance values as described further below and similar digital filtration is used to continuously calculate smoothed resistance slope values.
- The smoothed resistance slope is searched for values exceeding a predetermined slope which is chosen to indicate concentration polarisation and alumina depletion. Different forms of alumina search may be used, and these are described in greater detail in the following specification.
- The invention also provides a system for controlling the operation of an aluminium smelting cell comprising suitable means for performing each of the steps defined above.
- The cell voltage is preferably monitored to determine the existence of low frequency or high frequency noise in the voltage system.
- The invention also provides a system for controlling the operation of an aluminium smelting cell comprising suitable means programmed for performing each of the steps defined above.
- It will also be noted that if low frequency voltage noise is above a predetermined threshold, the smoothed resistance slope thresholds for low alumina concentration are raised. The critical slope threshold for one pot group under test was 0.025 µΩ/min. at voltage noise levels below the noise threshold of 0.25 µΩ/min. When the low frequency noise exceeds the above threshold, the base slope threshold is ramped by an amount proportional to the amount by which the noise signal exceeds the predetermined threshold. The maximum increment of the ramp is 0.05 µΩ/min. and occurs at a low frequency noise level of 0.50 µΩ/min. The filtered slope is again compared with the incremented threshold and if it is found to be greater than the threshold, the alumina inventory is then considered to determine whether or not the cell is overfed. If this determination is in the negative, the control system instructs a specific form of alumina feeding cycle to be effected - this is either an end of search or an anode effect prediction feeding cycle.
- Long term heat balance is achieved in a further control strategy element which causes adjustment of QTARGET, based on the data derived from the resistance measurements monitoring the resistivity of the cell in the manner described in greater detail below.
- A presently preferred embodiment of the invention will now be described with reference to the accompanying drawings in which:
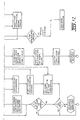
- Figure 1 is a diagrammatic representation of the three control functions and their interactions, as performed by a preferred embodiment of the control system according to the invention;
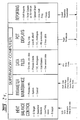
- Figure 2 is a schematic diagram showing the test control system used on an operational pot;
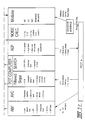
- Figure 3 is a diagrammatic graph showing one form of alumina concentration search (SFS) and anode effect prediction (AEP) performed by the system embodying the invention;
- Figure 4A is an operational graph of resistance values against time showing an alternative method of searching for alumina concentration (namely underfeed/overfeed for point feeders) by the control system embodying the invention;
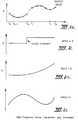
- Figures 4B to 4E are schematic graphs showing one example of low frequency noise calculation.
- Figures 5A and 5B show bath resistivity and rate of change of resistivity (

- Figure 5C shows bath resistivity, QTARGET and % excess AlF₃ of the bath over a one month period.
- Figure 6 is a diagram showing the calculated energy impact or process energy requirement (and hence compensating action) for feeding a test cell;
- Figure 7 is an operational diagram showing the breakdown of calculated energy absorbed or process energy requirement in a test cell over 24 hours;
- Figure 8 is an operational diagram showing the test cell response under the control system of the invention over 24 hours, and
- Figure 9 shows operational diagrams illustrating the detail of a stop feed search for alumina control of a test cell.
- In the following description, one embodiment of a control system under test on a working cell will be described in some detail. In describing the control system, it will be assumed that the reader is already aware of the operation of an aluminium reduction cell and the standard methods of monitoring cell voltage and current, and the standard methods of calculating the cell resistance. Accordingly these aspects will not be described further in this specification.
- Referring firstly to Figure 1 of the drawings, the control system embodying the invention is shown in simplified flow diagram form. Before proceeding with a detailed description of the control system, a general overview of the system will be provided.
- One aim of the control system is to maintain a cell at thermal steady state. That is, the rate of heat dissipation from the cell should be maintained at a constant, target value. For the control system the heat available for dissipation from the cell (QD, (kW)) may be defined as:-

- VC =
- cell voltage (V)
- RE =
- metered external resistances (eg rods, buswork) (uOhm)
- I =
- line amperage (kamps)
- QF =
- alumina dissolution power (kW)
- QS =
- anode setting power (kW)
- QA =
- power for AlF3/cryolite heating and dissolution (kW)
- QM =
- remaining process enthalpy requirements (chemical reaction for metal production) (kW)
- Note that the CE specific for the control system was made based on tapping history.
- The time over which energy is consumed by an individual process event must be defined in addition to the amount of energy consumed. In the control system this was achieved by distributing the total energy requirement of setting, feed or additions over predefined periods. Figure 6 illustrates the feed energy distribution for a Bell Bay breaker bar cell. Note that the energy balance was integrated over each 10 minute period and converted to power units.
- In addition to the calculations in the previous section, other components were required for the application of the control strategy in practice.
- Firstly, the dynamics of the reduction cell and control system meant that maintaining an 'instantaneous' energy balance was not possible. For example, during cell trials the energy absorbed by a cell was calculated over ten minute intervals and anode beam movements were carried out at five minute intervals. Hence responses to events were delayed by up to 15 minutes. Further the rate and range of target resistance changes were limited, and the line current variation for subsequent ten minute periods did not allow accurate elimination of an energy imbalance. As a result, an integral of the power imbalance was used to modify the target resistance of the cell. That is:-

- Ei =
- integral after
ith 10 minute interval (MJ) - Ei-1 =
- integral after (i-1)
th 10 interval (MJ) - c =
- integral decay factor
- QT =
- target heat dissipation (kW)
- QDi =
- heat available for dissipation for ith 10 min. interval (kW)
- A second additional component allowed control of the magnitude of the various discontinuous energy responses. This was necessary in order to model the thermal response of the electrolyte to localised disturbances or material additons. For example, the extra heat needed at an anode after setting is supplied to the bath volume throughout the cell and may have deleterious effects elsewhere. Also the process engineer may wish to reduce the amount of anode beam movement by damping the cell response to individual events. As a result, coefficients (
range 0 to 1) were introduced to tune the instantaneous calculations (thus system responses). Energy requirements for feed, setting and additions were divided into instantaneous and background (constant) power inputs. The various background power inputs were calculated from:- - (1) Feed - line amperage, CE (monthly average).
- (2) Additions - line amperage, CE, addition rate per kg of metal (monthly average).
- (3) Anode Setting - anode size, number of anodes, setting 'rota'.
- The final necessary component of the control system was a feed control technique which permitted regular anode beam movement while monitoring alumina concentration - thereby allowing the cell energy balance to be always under control. Search techniques were developed with these functions, where the target alumina concentration was detected via a continuously calculated slope of resistance. No scheduled anode effects (AEs) were included in the feed control strategy. The associated large, uncontrolled energy inputs to the process would have been in conflict with the control philosophy, and are difficult to compensate for in the thermal balance.
- Referring again to Figure 1 of the drawings, the control system has three basic strings, the first two affecting the short term heat and mass balance of the cell, and the third affecting the medium to long term heat balance of the cell. The control system is implemented using a computer for monitoring the functions of the cell or pot (pot computer), such as a Micromac 6000 computer suitable for the aluminium industry, and a supervisory computer for receiving data from each of a number of pot computers and for instructing the pot computers to perform various functions.
- Initial input data to the computers includes target heat dissipation QT, the specific current efficiency CE for the cell being controlled, the bath resistivity target range for the cell, thermodynamics data, as described in greater detail above, relating to the cell and a 'typical' back emf (EMF) of the cell calculated by regression in a known manner.
- The essential operating parameters of the cell are dynamically monitored, and these parameters include: the voltage of the cell V, the current of the cell I, alumina additions, cell bath additions, operations such as anode setting, beam raising, manual alumina addition and oreing up, and anode to cathode distance (ACD) movements. From these dynamic inputs, the resistance (R) of the cell is continually calculated from (V - EMF)/I, and the cell resistivity ρ is calculated from (δR/δACD)A, where A is the estimated area of the anodes in the cell.
- In the first control string, the pot computer calculates the level of noise in the voltage signal, 0 to 0.1 Hz indicating low frequency noise and 0.1 to 1 Hz indicating higher frequency noise, and further calculates the filtered rate of change of resistance with time (smoothed resistance slope) every second. The basic steps in the filtered slope calculation for each time cycle are:
- (i) Raw Resistance Slope Calculation.
Raw slope is calculated from the following equation:
- S₀ =
- raw slope at (t + Δt)
- R₀ =
- raw resistance at time (t + Δt)
- R₁ =
- single stage filtered resistance at time t
- Δt =
- time interval of resistance polling
- γ =
- filter constant for filtered resistance (R₁).
- (ii) Box filter for out of range raw slopes:
The raw slope is checked to determine if it is within the present box filter limits. If this test fails, no further calculations are made in this cycle - the slope value is assumed not to be associated with changes in alumina concentration. In the case of the pot under test, the box filter limits were -2.0 and 2.0 micro-ohms/minute. - (iii)Filtered resistance is recalculated (for use in the next time cycle).

- (iv) A three-stage filter is used to find the filtered resistance slope (called smoothslope). For the ith stage:

where γi is the pre-set filter constant of the ith stage. In the case of one pot under test, typical filtration constants are 0.100, 0.050 and 0.095 for γ₁, γ₂ and γ₃ respectively. - The above operations adequately filter high frequency noise from the resistance signal to produce a realistic filtered slope (with some lag from the three stage filter). In addition, a delay mechanism (discussed above) is included in the calculations to remove the effects of pot operations on the slope, including:
- (i) break and feed (normal cycles, AEP*)
- (ii) anode movement
- (iii)bath additions
- (iv) tapping*
- (v) anode setting*
- (vi) beam raising*
- Slope calculations are stopped during these operations, and for a pre-set period afterwards. Near the end of these delay periods, the first stage filtered resistance (R₁) is re-set to the mean of a specified number of raw resistance values. For the cases marked *, S₁ to S₃ are also zeroed. In the case of the pot under test, the respective delays following each of the above operations are:
- i) 60 seconds
- ii) 120 seconds
- iii) 300 seconds
- iv) 10 minutes
- v) 120 seconds
- vi) 120 seconds
- Delay periods associated with other operations include: When the pot is put on "manual" for any reason, a delay of 30 seconds is introduced.
When alumina is manually added, a delay of 120 seconds is introduced.
Similarly when oreing-up is performed, a delay of 60 seconds is introduced. - A pre-set delay is also implemented when step ii) of the slope calculation fails to give in-range slopes on a given number of consecutive tests. This is intended to trap the gross resistance disturbances not initiated/expected by the pot computer (e.g. sludging may cause an unpredictable resistance response).
- Different cells will require different delays depending on their operational characteristics and specific bath volumes, and the delay involved for each operation will be empirically determined by a skilled operator for input into the pot computer.
- Two alumina search techniques are available on the system, stop feed search (SFS) and feed search (FDS). Both techniques terminate search on a threshold value of increasing resistance slope, implying low end point alumina concentrations and both techniques allow heat balance regulation (anode movement)during the search. The special features of each are described below.
- This technique is essentially a stop feed during which the filtered resistance slope is checked every second for values above the critical slope (critslope) indicating alumina depletion. Once the critical slope is attained on a sufficient number of consecutive readings, search is terminated by initiation of an end of search feed followed by the resumption of the previously nominated cycle (see Figure 3).
- The search can also be terminated (classed an unsuccessful search) under the following circumstances:
- Cancelled due to time limitation (max search time).
- Cancelled due to anode setting, tapping, oreing-up, bath additions.
- Cancelled if cell is switched to MANUAL.
- The unique features of the SFS with respect to the present invention are:
- 1. the ability to monitor and interpret the resistance slope through all phases of the search.
- 2. the ability to move the anodes freely through all phases of the search.
- 3. the crit slope in the search is a function of the voltage noise in the cell.
- The SFS technique has been applied to both breaker bar and point feed cells.
- This is a more complex search procedure but one which has the potential for fine alumina concentration control on point feed cells. The strategy involves following resistance slope before and during underfeeding and overfeeding periods until a target alumina concentration is achieved.
- The stages of the searching routine are as follows:
- (a) After commencement of searching, the filtered resistance slope is monitored for a short time period and compared with a parameter, base search slope, near the minimum point on the resistance-time curve in Figure 4A. The objective is to adjust alumina concentration to this base level.
- (b) As the alumina concentration of the cell decreases, the resistance slope increases from a negative value up to the value of the base search slope. Thus slopes more negative than base search slope indicate a higher than 'base-level' alumina concentration and are actioned by changing to x % underfeed. Slopes more positive than base search slope indicate a lower than base-level concentration and cause a y % overfeed cycle to begin.
- (c) When the filtered slope passes through base search slope (or the under/overfeeding period times out - whichever is first), a feedrate of x % underfeed is selected for the remainder of the search period.
- (d) The filtered slope is then monitored until its value increases positively to target search slope. At this stage the alumina concentration has been adjusted to its target operating level. FDS is terminated and the previously selected (nominal or fixed) feedrate is resumed immediately.
- By gradually increasing base search slope towards the target value (target search slope), it is possible to minimize the absolute variation in alumina concentration during FDS under point feeding of alumina. Additionally, if the percent under and overfeed are decreased to small values (such as 10%), the proportion of time spent on search will increase - allowing very close feed control for most of the operation.
- Anode effect prediction (AEP) is provided by a check on the filtered resistance slope every second during normal feeding of the cell (Fig. 3). If it exceeds a pre-set AEP slope an AEP feed cycle is initiated immediately to avoid an anode effect.
- This high resistance slope results from the critical depletion of alumina concentration in the cell during periods when alumina searching is not occurring. Resistance changes due to operations like setting, tapping and bath additions are removed by the filtered slope calculation. However, resistance changes due to metal pad instability are included in the filtered slope. Hence the pre-set AEP slope is increased if excessive low frequency noise is detected, as discussed further below, to reduce the likelihood that the system will trigger an AEP feeding cycle due to low frequency noise. It will be appreciated that low frequency, cyclic voltage variations (of less than one cycle per second) are sometimes observed due to instability in the liquid aluminium pad. The rates of resistance increase associated with these cycles can, in the case of severe instability, exceed the resistance slope thresholds above, triggering alumina feeding when this is not warranted. To guard against this occurrence the slope thresholds for both end of search and AEP are increased by a predetermined amount when low frequency voltage noise is detected above a certain amplitude (in micro-ohms). The critical slope threshold for one pot under test was 0.035 uΩ/min. and the voltage noise threshold was 0.25 µΩ/min. When the low frequency noise exceeds the above threshold, the critical slope threshold is ramped by an amount proportional to the amount by which the noise signal exceeds the predetermined threshold. The maximum increment of the ramp is 0.05 uΩ/min. and occurs at a low frequency noise level of 0.50 µΩ/min. The filtered slope is again compared with the threshold and if it is found to be greater than the threshold, the alumina inventory is then considered to determine whether or not the cell is overfed. If this determination is in the negative, the control system instructs an AEP alumina feeding cycle to be effected. The operation of AEP can also be stopped for a defined period after an AEP prediction as further protection against excessive AEP triggered feeds during periods of cell instability.
- Both high and low frequency noise calculations are performed continuously in this module. While the high frequency calculation is a simple 1 Hz, minimum R/maximum R relationship, the low frequency characteristic needs further explanation and this is given below.
- The main function of the low-frequency noise calculation is to detect noise generated by metal pad instability. In this novel formulation, a group of consecutive resistances are summed, then averaged. A ring buffer containing a time sequence of these averages are then stored for some period of time (usually less than 2 AVC periods). Figure 4B is an example of the resulting data in a computer; essentially it is a resistance vs time plot with the high-frequency noise removed. The low frequency noise is the sum of absolute differences in adjacent resistance averages minus the absolute difference between the newest and oldest averages, divided by the time interval.

where ARi is the average resistance at time ti Examples of idealized curves and their noise are shown in Figures 4C to E. - The calculation of noise with the addition of each new mean resistance (and the elimination of the oldest resistance) requires less calculation time than standard noise calculations. In the case of one test pot trial the mean resistances are calculated over 10 seconds, and 30 values (5 minutes history) are stored.
- In the second control string the heat supplied and the heat required for aluminium production are calculated from the dynamic inputs described above (cell voltage and current, alumina additions, bath chemistry additions, operations and anode movements) and the heat available (QAVAIL) for dissipation by the cell is also calculated. The difference between available heat and the previously determined target heat (QT) is integrated with respect to time and from this integral a running heat inventory is calculated. The target resistance (RTARGET), derived in the manner described above from QTARGET, is regularly updated on the pot computer to adjust the heat balance of the cell to minimize the imbalance represented by the heat inventory integral. The target resistance must lie between the specified minimum and maximum allowable limits. These limits are, for example, 32-40 uΩ, for a typical pot under test, i.e. a band of about 6 to 8 uΩ. If the average actual resistance over the resistance regulation (AVC) period is significantly different (outside a specified dead band) from the new target resistance, the pot computer then issues a beam raise or lower signal to move the cell resistance back into the dead band. This instruction is limited to a pre-set amount (ΔR max.).
- If the updated resistance target consistently falls above or below one of the allowable limits, disallowing the regulation of resistance as described above, the operating amperage, ore cover level, or bath and metal levels are reviewed so that a more flexible region of the operating envelope can be chosen for the cell.
- The set point, RTARGET, is updated at regular intervals on the basis of short range heat balance calculations. The short range calculations require the following information:
- Real time clock - for scheduling and distributing intermittent power absorbed functions during operations.
- Vi, Ii, Ri - one minute average voltage, current and resistance.
- PCELL - Cell Power input (heat balance interval average).
- Current efficiency - based on cumulative metal tap.
- Software switches - indicating commencement of a cell operation.
- Alumina dump counters - metering alumina actually fed to the cell.
- PABSORB - power absorbed calculation
- QAVAIL - The available power dissipation over the previous period.
- R - The average actual cell resistance over the previous period.
- I - The average cell amperage over a longer time period (default period is one hour).
- The calculated value of the available power dissipation is compared to the target value for the cell and the thermal imbalance ΔQ obtained. (The target value (QTARGET) is initially determined from a steady-state computer thermal model prediction and cell operating diagram and then updated imbalance is integrated and converted directly into a ΔR and an RTARGET using the average value of amperage and the previous target resistance respectively.
- As mentioned earlier, resistance regulation maintains cell resistance at or near the target value calculated in the heat balance program. Also, as will be discussed, anode movements do not in any way affect the mechanics of feed control on the cell. Functionally, the implications of these strategy requirements are as follows:
- i) resistance regulation is prohibited on three occasions only:
- during beam raising
- during anode setting
- during tapping when TVC is operative.
- ii) resistance regulation frequency is increased so that the interval between resistance regulation is reduced to five minutes or less.
- iii) The proportionality constants for resistance regulation buzz time (decisec/micro-ohm) are set as close as possible to the reciprocal product of resistance/cm of ACD and beam speed (up or down). This ensures that one resistance regulation attempt moves the resistance to its target value - eliminating kilowatt errors from this source.
- iv) The dead band for resistance regulation is tight (± 0.20 micro-ohm).
- In the final control string, long term heat balance control is used to continually update the target power dissipation QTARGET through trends in bath resistivity data. This prevents longer term changes in bath thermal conditions and chemistry which occur through breakdown of ore cover, changes in current efficiency or amperage, and variations in anode carbon quality with respect to reactivity, thermal conductivity and anode spike formation.
- Bath resistivity data is used to detect all chemistry and thermal conditions in real time.
- Bath resistivity is calculated at approximately hourly intervals, using controlled beam movements, with beam movement measured in the usual manner by a shaft counter.
- Using the average change in cell resistance before and after the beam movement sequence, bath resistivity is calculated from the known relationship.


- ΣRFIXED is the sum of the contribution of resistance values due to ohmic effects and possible reaction decomposition effects. This value is assumed to be constant for changes in ACD.
- AA is the nominal area of the anode and is assumed to be constant
- δACD is measured using the shaft counter
- δΔR is the difference between cell resistance before and after the 20 decisecond buss-up.
- The bath resistivity and its rate of change is a good indication of the concentration of AlF₃. There is a lag time between a rise in % XS AlF₃ and a rise in bath resistivity. This characteristic depends on liquid bath volume, anode and cathode condition, and other pot characteristics. Freezing in a cell occurs when the bath super->heat drops below a certain level and is identifiable by an increase in % XS AlF₃. After taking the lag time into consideration, if the bath resistivity is increasing to a level where electrolyte freezing and increases in % XS Alf₃ are occurring, the Q TARGET is adjusted in the system so that more power is supplied to the cell. This causes a greater rate of heat dissipation throuth the electrolyte and increases its superheat, reducing its tendency to freeze. The response must be tuned to the lag time of the resistivity measurement as well as to the QDISS/Superheat relationship, so that QTARGET does not overshoot its correct value.
- The initial or starting value for the target heat dissipation QT is derived as follows.
- Thermal model calculations (Finite element prediction of isotherms and flows within the cell in question) are used to determine the steady-state level of heat loss required from a particular cell design (eg the test pot referred to above is a Type VI cell design and requires 220 - 230 kW depending on metal level and alumina cover). This target or 'design heat loss' is QCELL.
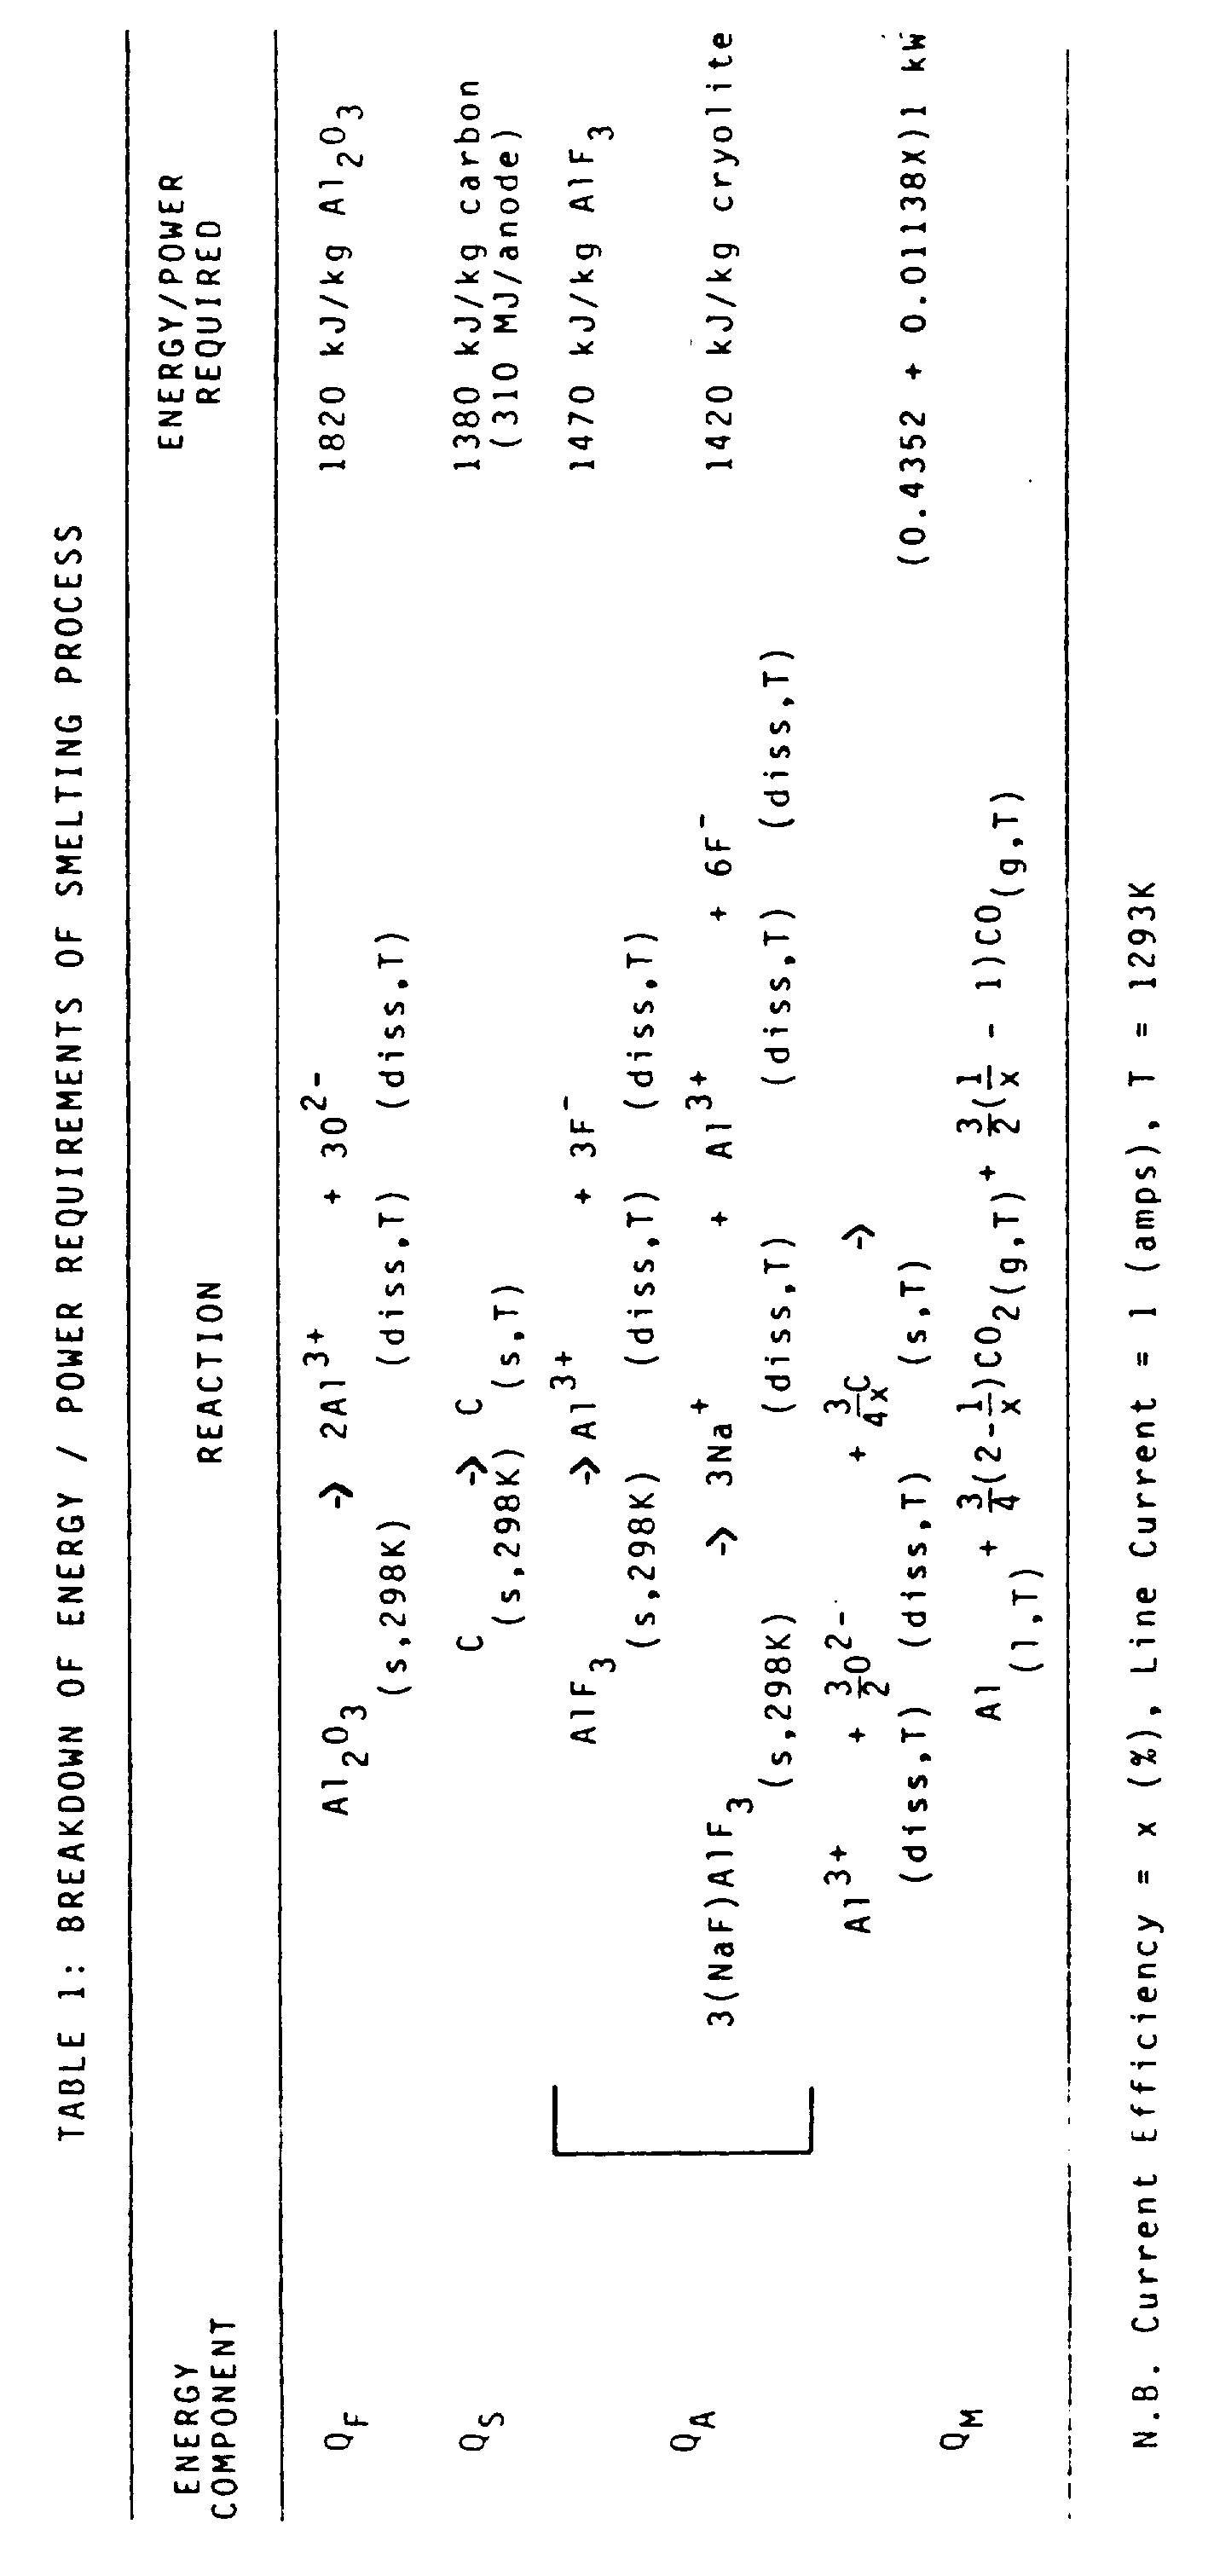
- The process energy requirement for aluminium production can be calculated in a known manner for the cell once the line amperage is known:

- In Table 1 this is calculated to be 1.956 Volts x I at 95% current efficiency (CE) for a typical test cell at Bell Bay (At 90% efficiency this figure is 1.841 Volts x I).
- Adding to this the power loss from the bus bar around the cell:


TABLE 1 At I = 87 kA ; PTOTAL = 170.2 kW + 225 kW + 18.2 kW and 95% CE = 413.4 kW REXT = 2.4 on Pot under test QCELL = 225kW VABSORB = 1.956V 


- Figures 5A and 5B show selected pot parameters over 2 months operation of a reduction cell, with constant QTARGET. The % XS AlF₃ varied significantly over this period and ρ and


- Such observations resulted in the development and testing of a closed-loop control system in which the target energy input to the cell (QTARGET) was changed based on ρ and/or

days 4, 11, 19 and 29 correspond with high ρ values. The resultant increased power inputs controlled the high % XS AlF₃ excursions, making manual intervention unnecessary. - Frequent VAVC action maintains the actual resistance close to the continually updated target value, and the magnitude of its allowable resistance changes are specified as a heat balance parameter - within absolute resistance limits as discussed earlier. More importantly, AVC will not be disallowed during operations unless it is physically unreasonable to perform beam movement. These occasions are during tapping, anode setting and beam raising.
- An extended trial of the above described control system has been made on a group of cells at one of the applicant's smelters. For the trial the CE and 'QT' for each cell were selected based on long-term data computer modelling and cell condition. It should be noted that cell condition fluctuates due to factors such as cell ore cover, seasonal temperatures, alumina properties, bath composition and cell age. Hence the parameters should be updated on a regular basis.
- Calculation of the power absorbed for the control system used the following hardware inputs:-
- voltage and amperage (1Hz)
- a switch to indicate anode setting (at cell)
- keyboard input for bath additions in kg (adjacent to cell)
- keyboard input for manual alumina addition and oreing-up
- The results presented in Figures 7 and 8 show the behaviour of a cell under the control system over 24 hours.
- Figure 7 shows the calculated heat absorbed by the cell, broken down into it's four operational components. Fluctuations in the power required for reaction (metal production) (Fig. 7a) were due to line amperage variations. The power absorbed by alumina feeding (Fig. 7b) had a strong cyclic pattern. This pattern is accentuated because the alumina searches (SFS) included cessation of feeding (for the day shown). Figure 7c shows the effect of replacing two anodes. For setting, the energy distribution was spread over 5 hours; this was based on trial data and computer modelling of the heat absorbed by the new blocks. Figure 7d includes the energy input for a 15kg bag of AlF3. Note that 50% of feed power, 50% of setting power, and 20% of the additions power were supplied as constant background inputs, while the remainder in each case was triggered by the respective events.
- The calculation of the total absorbed energy is shown in Figure 8a. Figure 8b shows the power available for dissipation from the cell as heat (Eqn 1). Note the target dissipation rate of 240kW for this cell. The target and calculated actual heat dissipation clearly show the heat deficit/excess in Figure 8c. The cell had an energy imbalance for periods up to 2 hours. This was primarily due to the power input constraints imposed by the cell resistance control band. Figure 8d shows the control band of 32.5 to 38 uOhm used over the 24 hour period. Anode beam movements are clearly larger, and more frequent, than for control systems previously reported in the literature. This reflects the extent of thermal disturbance which is imposed on most reduction cells in a single day.
- Figure 9 illustrates the behaviour of the alumina feed control component of the system during a typical, successful stop feed search (SFS). (The search period is marked in Fig. 8d.) One minute averages of anode cathode distance (ACD), cell resistance and slope of resistance are shown. The centre channel bath temperature, measured at ten minute intervals, is also presented. The change in ACD was transduced using the rotation shaft counter (proximity switches) on the anode beam drive shaft. The resistance slope (Fig. 9d) was zeroed at the start and end of the SFS; the end of search slope was 0.025 uOhm/min. The search lasted approximately 90 minutes, and there was substantial beam movement throughout. The high resistance/ACD at the start of searching was due to the energy requirement of a 23kg alumina feed immediately beforehand. Once this energy was supplied, the control system reduced the power input. The control approach allowed long SFSs to be scheduled without the bath temperature or superheat increasing substantially. This allowed back-feeding and depletion of alumina to the target level. The stable bath temperature is clearly shown in Figure 9c, although there was a temperature fall caused by the feed before SFS. Typically, a bath temperature change of only +/-4C was measured during SFS. While there is some fluctuation in the dynamics of the resistance slope, the underlying trend and threshold values were reliable. The SFS technique achieved good feed control, consistently, with [ 0.3 AEs/day.
- The trial results demonstrate a number of inherent advantages in the control system. Since the energy requirements were calculated from basic information (eg line amperage, alumina dumps, thermodynamic data), changes to the operating environment were catered for automatically. If a variation in potline amperage occurred, the control system automatically adjusted the resistance targets of the cell. The mean resistance at which the cell operated over longer periods were also varied if the long-term amperage was changed. Similarly, any decision to change the number of dumps for each feed, the timing of SFSs or the number/size of anodes set was catered for easily. Fundamentally, this was due to the control system being based on the real operating target and component energy requirements of the smelting process rather than the less direct measures of target voltage or resistance. This same mechanistic approach can also reinforce the understanding of the process for those operating it.
- There are, of course, some practical constraints imposed on the control system by the process. If the potline amperage is reduced significantly for a sufficient period, each cell will experience a substantial energy deficit. Thus all cells in the potline will attempt to operate at their maximum target resistance simultaneously. The potline voltage may then exceed the rectifier limits. This problem can be overcome by including safety factors in the control system which limit the closure of energy balance attempted under extreme potline conditions. On an individual pot basis there may also be variations in heat dissipation, current efficiency and the integrity of the top cover/crust, requiring individualization of the QT targets for each cell.
- The control system embodying the invention maintains a target rate of heat loss from a reduction cell via calculation of the energy absorbed by the process. The trial results show that the system made regular anode beam movements while maintaining good thermal balance on the cell. The control system described here is a building block for the optimization of reduction cell efficiency via understanding and reducing variations in the cell thermal balance.
- The overall configuration of a typical control system is shown in Figure 2. The physical location of each control module on the system in this implementation has been determined by the computing power available at the pot computer and supervisory computer levels respectively. Thus the more complex heat balance control module has been placed on a Microvax supervisory computer. This also has the advantage of providing an interactive human interface to the control function for diagnostics and further development. As a general strategy, however, all essential control functions in a distributed potline system should be located at the lowest intelligent level - the pot computer in this case - so that maximum safety and redundancy can be built into the system.
- The computer control functions detailed in Figure 2 will be recognised by persons of skill in the art and since many of the functions are not critical to the invention, they will not be further described in this specification.
Claims (10)
- A process to control the operation of an aluminium smelting cell, comprising the steps of:(i) continuously monitoring cell voltage and current,(ii) calculating the resistance of the cell from the monitored cell voltage and current,(iii) calculating the rate of change of cell resistance (raw resistance slope) and a smoothed value of said resistance slope,(iv) utilising the smoothed resistance slope values to maintain mass balance in the cell, including the step of searching the smoothed resistance slope for values exceeding a predetermined slope chosen to indicate alumina depletion.(v) monitoring cell process operations including alumina additions, electrolyte bath additions, anode changes, tapping, beam raising and anode beam movement,(vi) delaying the calculation of resistance slope and smoothed resistance slope for a predetermined time when any one of said monitored cell process operations occurs, and(vii) recalculating said cell resistance slope and smoothed resistance slope after said predetermined time delay so that the smoothed slope is unaffected by process changes with the exception of alumina depletion.
- The process of claim 1, wherein the step of calculating the rate of change of cell resistance includes the step of calculating a raw resistance slope from the equation:
 SO = raw slope at time (t + Δt)RO = raw resistance at (t + Δt)R₁ = single stage filtered resistance at time tΔt = time interval of resistance pollingγ = filter constant for filtered resistance (R₁).
 - A process according to claim 1 or 2 further comprising the step of checking to determine whether the raw resistance slope falls within predetermined limits and rejecting any value falling outside such limits.
- A process according to claim 2 or 3 wherein said smoothed value of the resistance slope is calculated from the equation


- A process according to any preceding claim, comprising the further steps of continuously monitoring said cell voltage or resistance to determine the existence of low frequency or high frequency noise in the voltage signal, determining whether said low frequency voltage noise exists above a predetermined threshold, and increasing the smoothed resistance slope threshold in the event that said low frequency noise is above said predetermined threshold.
- A process according to claim 5, wherein said smoothed resistance slope threshold is increased along a ramp having a maximum increase in resistance slope threshold not exceeding a predetermined value.
- An apparatus when suitably programmed for carrying out the process of any of claims 1 to 6 for controlling the operation of an aluminium smelting cell, said system comprising:(i) means to continuously monitor cell voltage and current;(ii) means to calculate the resistance of the cell from the monitored cell voltage and current;(iii) means to calculate the rate of change of cell resistance (raw resistance slope) and a smoothed value of said resistance slope;(iv) means to utilize the smoothed resistance slope values to maintain mass balance in the cell, including means to search the smoothed resistance slope for values exceeding a predetermined slope chosen to indicate alumina depletion;(v) means to monitor cell process operations including alumina additions, electrolyte bath additions, anode changes, tapping, beam raising and anode beam movement;(vi) means to delay the calculation of resistance slope and smoothed resistance slope for a predetermined time when any one of said monitored cell process operations occurs; and(vii) means to recalculate said cell resistance slope and smoothed resistance slope after said predetermined time delay so that the smoothed slope is unaffected by process changes with the exception of alumina depletion.
- An apparatus according to claim 7 further comprising means to continuously monitor said cell voltage or resistance to determine the existence of low frequency or high frequency noise in the voltage signal, means to determine whether said low frequency voltage noise exists above a predetermined threshold, and means to increase the smoothed resistance slope threshold in the event that said low frequency noise is above said predetermined threshold.
Priority Applications (1)
| Application Number | Priority Date | Filing Date | Title |
|---|---|---|---|
| EP95201436A EP0671488A3 (en) | 1989-02-24 | 1990-02-19 | Process for controlling aluminium smelting cells. |
Applications Claiming Priority (2)
| Application Number | Priority Date | Filing Date | Title |
|---|---|---|---|
| AU2938/89 | 1989-02-24 | ||
| AUPJ293889 | 1989-02-24 |
Related Child Applications (2)
| Application Number | Title | Priority Date | Filing Date |
|---|---|---|---|
| EP95201436.3 Division-Into | 1990-02-19 | ||
| EP95201436A Division EP0671488A3 (en) | 1989-02-24 | 1990-02-19 | Process for controlling aluminium smelting cells. |
Publications (3)
| Publication Number | Publication Date |
|---|---|
| EP0386899A2 EP0386899A2 (en) | 1990-09-12 |
| EP0386899A3 EP0386899A3 (en) | 1991-02-06 |
| EP0386899B1 true EP0386899B1 (en) | 1996-01-31 |
Family
ID=3773750
Family Applications (2)
| Application Number | Title | Priority Date | Filing Date |
|---|---|---|---|
| EP95201436A Ceased EP0671488A3 (en) | 1989-02-24 | 1990-02-19 | Process for controlling aluminium smelting cells. |
| EP90301748A Expired - Lifetime EP0386899B1 (en) | 1989-02-24 | 1990-02-19 | Process for controlling aluminium smelting cells |
Family Applications Before (1)
| Application Number | Title | Priority Date | Filing Date |
|---|---|---|---|
| EP95201436A Ceased EP0671488A3 (en) | 1989-02-24 | 1990-02-19 | Process for controlling aluminium smelting cells. |
Country Status (9)
| Country | Link |
|---|---|
| US (1) | US5089093A (en) |
| EP (2) | EP0671488A3 (en) |
| AT (1) | ATE133721T1 (en) |
| BR (1) | BR9000830A (en) |
| CA (1) | CA2010322C (en) |
| DE (1) | DE69025080D1 (en) |
| IS (1) | IS3551A7 (en) |
| NO (1) | NO982803D0 (en) |
| NZ (1) | NZ232580A (en) |
Families Citing this family (34)
| Publication number | Priority date | Publication date | Assignee | Title |
|---|---|---|---|---|
| IS3943A (en) * | 1991-11-07 | 1993-05-08 | Comalco Aluminium Limited | Anode with constant combustion or curing |
| FR2749858B1 (en) * | 1996-06-17 | 1998-07-24 | Pechiney Aluminium | METHOD FOR REGULATING THE ALUMINUM CONTENT OF THE BATH OF ELECTROLYSIS TANKS FOR THE PRODUCTION OF ALUMINUM |
| NO311623B1 (en) * | 1998-03-23 | 2001-12-17 | Norsk Hydro As | Process for controlling aluminum oxide supply to electrolysis cells for aluminum production |
| US6136177A (en) * | 1999-02-23 | 2000-10-24 | Universal Dynamics Technologies | Anode and cathode current monitoring |
| RU2220231C2 (en) * | 1999-06-10 | 2003-12-27 | Норск Хюдро Аса | Process of control over feed of aluminum oxide into electrolytic cells to win aluminum |
| RU2202004C1 (en) * | 2001-11-19 | 2003-04-10 | Борзых Сергей Дмитриевич | Procedure of control over aluminum electrolyzer |
| RU2204629C1 (en) * | 2001-12-28 | 2003-05-20 | Закрытое акционерное общество "ТоксСофт" | Method for controlling technological process in aluminium cell |
| US6837982B2 (en) | 2002-01-25 | 2005-01-04 | Northwest Aluminum Technologies | Maintaining molten salt electrolyte concentration in aluminum-producing electrolytic cell |
| RU2217528C1 (en) * | 2002-07-05 | 2003-11-27 | Открытое акционерное общество "Всероссийский алюминиево-магниевый институт" | Method of control of thermal conditions of aluminum electrolyzer |
| US6866767B2 (en) * | 2002-10-23 | 2005-03-15 | Alcan International Limited | Process for controlling anode effects during the production of aluminum |
| RU2255149C1 (en) * | 2004-05-05 | 2005-06-27 | Общество с ограниченной ответственностью "Инженерно-технологический центр" | Method for controlling aluminum cell at changing alumina dissolution rate |
| US7036097B1 (en) | 2004-11-30 | 2006-04-25 | Alcan International Limited | Method for designing a cascade of digital filters for use in controling an electrolysis cell |
| RU2303658C1 (en) * | 2005-11-02 | 2007-07-27 | Общество с ограниченной ответственностью "Русская инжиниринговая компания" | Method for controlling technological process in aluminum cell with roasted anodes |
| RU2009102517A (en) * | 2006-06-27 | 2010-08-10 | Алкоа Инк. (Us) | SYSTEMS AND METHODS USEFUL WHEN MANAGING THE OPERATION OF ELECTROLYZERS FOR THE PRODUCTION OF METAL |
| US20100292825A1 (en) * | 2006-08-09 | 2010-11-18 | Auckland Uniservices Limited | Process control of an industrial plant |
| AU2007333769A1 (en) * | 2006-12-19 | 2008-06-26 | Michael Schneller | Aluminum production process control |
| EP2135975A1 (en) * | 2008-06-16 | 2009-12-23 | Alcan International Limited | Method of producing aluminium in an electrolysis cell |
| CN102517610A (en) * | 2011-12-26 | 2012-06-27 | 贵阳铝镁设计研究院有限公司 | On-line monitoring system of furnace edge shape of aluminium electrolytic tank |
| CN103628095A (en) * | 2013-11-29 | 2014-03-12 | 湖北迅迪科技有限公司 | Online monitoring device for aluminium cell cathode current |
| RU2593560C1 (en) * | 2015-03-25 | 2016-08-10 | Общество с ограниченной ответственностью "Логическое управление алюминиевым электролизером" | Method of controlling aluminium electrolytic cell at minimum power |
| CN105463513B (en) * | 2015-05-28 | 2018-04-27 | 贵阳铝镁设计研究院有限公司 | Aluminum electrolysis alumina concentration on-line monitoring method and its monitoring device |
| EP3266904B1 (en) | 2016-07-05 | 2021-03-24 | TRIMET Aluminium SE | Molten salt electrolysis system and control method for operation of the same |
| US10627787B2 (en) | 2017-11-01 | 2020-04-21 | International Business Machines Corporation | Manufacturing process control based on multi-modality and multi-resolution time series data |
| CN108360020B (en) * | 2018-04-10 | 2020-03-06 | 中南大学 | Low frequency cell noise monitoring method and equipment for aluminum electrolytic cell process control |
| CN108914162B (en) * | 2018-08-07 | 2020-01-14 | 北方工业大学 | Method and system for controlling feeding amount of aluminum oxide |
| CN109554728B (en) * | 2018-12-27 | 2021-04-27 | 中国神华能源股份有限公司 | Aluminum oxide electrolysis control method, storage medium, and electronic device |
| CN112210794B (en) * | 2019-07-10 | 2021-12-21 | 郑州轻冶科技股份有限公司 | Aluminum electrolysis energy balance adjusting method and system based on molecular ratio and aluminum electrolysis cell |
| CN112210795B (en) * | 2019-07-10 | 2021-12-21 | 郑州轻冶科技股份有限公司 | Aluminum electrolysis energy balance adjusting method and system based on superheat degree and aluminum electrolysis cell |
| CN110453248B (en) * | 2019-08-27 | 2021-03-02 | 神华准能资源综合开发有限公司 | Thermal balance adjusting device and method for electrolytic cell |
| CN110699709A (en) * | 2019-10-10 | 2020-01-17 | 重庆旗能电铝有限公司 | Aluminum yield inventory method for aluminum electrolysis single cell |
| CN111996557B (en) * | 2020-08-11 | 2023-06-23 | 杨晓东 | A method for concentrated pole change and continuous pole shutdown in an aluminum electrolytic cell |
| CN114182296A (en) * | 2020-09-12 | 2022-03-15 | 四川省平武锰业(集团)有限公司 | Energy consumption monitoring and controlling method in manganese preparation process |
| CN116024614B (en) * | 2023-03-01 | 2024-01-30 | 湖南力得尔智能科技股份有限公司 | An automated energy-saving control system for tank control machines based on industrial network |
| CN121161370B (en) * | 2025-09-20 | 2026-04-21 | 沈阳联科科技有限公司 | A method and system for precise temperature control in aluminum smelting process |
Family Cites Families (22)
| Publication number | Priority date | Publication date | Assignee | Title |
|---|---|---|---|---|
| US3573179A (en) * | 1965-12-14 | 1971-03-30 | Ibm | Method and apparatus for the control of electrolytic refining cells |
| US3660256A (en) * | 1967-12-07 | 1972-05-02 | Gen Electric | Method and apparatus for aluminum potline control |
| US3712857A (en) * | 1968-05-20 | 1973-01-23 | Reynolds Metals Co | Method for controlling a reduction cell |
| US3625842A (en) * | 1968-05-24 | 1971-12-07 | Kaiser Aluminium Chem Corp | Alumina feed control |
| US4035251A (en) | 1968-08-21 | 1977-07-12 | Reynolds Metals Company | Method and apparatus for reduction cell control |
| US3622475A (en) | 1968-08-21 | 1971-11-23 | Reynolds Metals Co | Reduction cell control system |
| US3632488A (en) * | 1969-01-23 | 1972-01-04 | Reynolds Metals Co | Reduction cell control system |
| US3812024A (en) * | 1972-03-20 | 1974-05-21 | Kaiser Aluminium Chem Corp | Control of an aluminum reduction cell |
| CH560765A5 (en) * | 1972-07-18 | 1975-04-15 | Alusuisse | |
| CH576530A5 (en) | 1972-07-18 | 1976-06-15 | Alusuisse | |
| US3878070A (en) | 1972-10-18 | 1975-04-15 | Southwire Co | Apparatus for and method of producing metal |
| US4024034A (en) | 1973-07-25 | 1977-05-17 | Siemens Aktiengesellschaft | Method for operating the furnaces of an electrolysis plant |
| AT329893B (en) * | 1973-07-25 | 1976-06-10 | Vaw Ver Aluminium Werke Ag | PROCEDURE AND ARRANGEMENT FOR OPERATING AN ELECTROLYSIS PLANT, IN PARTICULAR AN ALUMINUM ELECTROLYSIS PLANT |
| RO75812A (en) | 1974-06-05 | 1981-02-28 | Aluminium Pechiney,Fr | METHOD FOR THE CONTINUOUS DETERMINATION OF INTERNAL RESISTANCE OF AN ELECTROLYSIS UNIT AND INSTALLATION FOR APPLICATION OF THE PROCESS |
| FR2487386A1 (en) * | 1980-07-23 | 1982-01-29 | Pechiney Aluminium | METHOD AND APPARATUS FOR PRECISELY REGULATING THE INTRODUCTION RATE AND THE ALUMINUM CONTENT OF AN IGNATED ELECTROLYSIS TANK, AND APPLICATION TO THE PRODUCTION OF ALUMINUM |
| US4333803A (en) | 1980-10-03 | 1982-06-08 | Aluminum Company Of America | Method and apparatus for controlling the heat balance in aluminum reduction cells |
| JPS57181390A (en) | 1981-04-28 | 1982-11-08 | Mitsubishi Keikinzoku Kogyo Kk | Measuring method for counter electromotive force of aluminum electrolytic cell |
| US4425201A (en) * | 1982-01-27 | 1984-01-10 | Reynolds Metals Company | Method for improved alumina control in aluminum electrolytic cells |
| NO166821C (en) | 1985-02-21 | 1991-09-04 | Aardal & Sunndal Verk As | PROCEDURE FOR CONTROL OF THE ALUMINUM OXYDE SUPPLY TO ELECTRIC OVERS FOR ALUMINUM MANUFACTURING. |
| FR2581660B1 (en) | 1985-05-07 | 1987-06-05 | Pechiney Aluminium | PROCESS FOR THE PRECISION OF A LOW ALUMINUM CONTENT IN AN IGNATED ELECTROLYSIS TANK FOR THE PRODUCTION OF ALUMINUM |
| US4654130A (en) | 1986-05-15 | 1987-03-31 | Reynolds Metals Company | Method for improved alumina control in aluminum electrolytic cells employing point feeders |
| US4814050A (en) * | 1986-10-06 | 1989-03-21 | Aluminum Company Of America | Estimation and control of alumina concentration in hall cells |
-
1990
- 1990-02-19 EP EP95201436A patent/EP0671488A3/en not_active Ceased
- 1990-02-19 EP EP90301748A patent/EP0386899B1/en not_active Expired - Lifetime
- 1990-02-19 IS IS3551A patent/IS3551A7/en unknown
- 1990-02-19 AT AT90301748T patent/ATE133721T1/en not_active IP Right Cessation
- 1990-02-19 DE DE69025080T patent/DE69025080D1/en not_active Expired - Lifetime
- 1990-02-19 CA CA002010322A patent/CA2010322C/en not_active Expired - Fee Related
- 1990-02-19 NZ NZ232580A patent/NZ232580A/en unknown
- 1990-02-20 US US07/481,845 patent/US5089093A/en not_active Expired - Fee Related
- 1990-02-21 BR BR909000830A patent/BR9000830A/en not_active Application Discontinuation
-
1998
- 1998-06-18 NO NO982803A patent/NO982803D0/en unknown
Also Published As
| Publication number | Publication date |
|---|---|
| EP0671488A2 (en) | 1995-09-13 |
| ATE133721T1 (en) | 1996-02-15 |
| EP0671488A3 (en) | 1996-01-17 |
| NO982803L (en) | 1990-08-27 |
| IS3551A7 (en) | 1990-08-25 |
| BR9000830A (en) | 1991-02-05 |
| CA2010322C (en) | 1998-08-18 |
| CA2010322A1 (en) | 1990-08-24 |
| EP0386899A3 (en) | 1991-02-06 |
| US5089093A (en) | 1992-02-18 |
| NZ232580A (en) | 1992-12-23 |
| DE69025080D1 (en) | 1996-03-14 |
| NO982803D0 (en) | 1998-06-18 |
| EP0386899A2 (en) | 1990-09-12 |
Similar Documents
| Publication | Publication Date | Title |
|---|---|---|
| US5089093A (en) | Process for controlling aluminum smelting cells | |
| US4814050A (en) | Estimation and control of alumina concentration in hall cells | |
| Homsi et al. | Overview of process control in reduction cells and potlines | |
| US4126525A (en) | Method of controlling feed of alumina to an aluminum electrolytic cell | |
| US8052859B2 (en) | Aluminum production process control | |
| US4035251A (en) | Method and apparatus for reduction cell control | |
| EP2315863B1 (en) | Method of producing aluminium in an electrolysis cell | |
| US7378009B2 (en) | Method of controlling an aluminum cell with variable alumina dissolution rate | |
| US3712857A (en) | Method for controlling a reduction cell | |
| US4654130A (en) | Method for improved alumina control in aluminum electrolytic cells employing point feeders | |
| US4425201A (en) | Method for improved alumina control in aluminum electrolytic cells | |
| US4654129A (en) | Process for accurately maintaining a low alumina content in an electrolytic smelting cell for the production of aluminum | |
| US20070095672A1 (en) | Method of controlling aluminum reduction cell with prebaked anodes | |
| RU2113552C1 (en) | Method controlling technological process in aluminum electrolyzer | |
| US5930284A (en) | Multiple input electrode gap controller | |
| CA2266279A1 (en) | A method for controlling the feed of alumina to electrolysis cells for production of aluminium | |
| AU622283B2 (en) | Process for controlling aluminium smelting cells | |
| US5882499A (en) | Process for regulating the temperature of the bath of an electrolytic pot for the production of aluminium | |
| AU633227B2 (en) | Process for controlling aluminium smelting cells | |
| RU2023058C1 (en) | Method to control process of electrolytic aluminium production in an electrolyzer | |
| US7175749B2 (en) | Method and device for detecting anode effects of an electrolytic cell for aluminum production | |
| SI9700163A (en) | Amount regulation process of bauxite in the electrolytic tubs bath for obtaining aluminium | |
| US4867851A (en) | Process for regulating the acidity of all-Heelectrolytic cells | |
| RU2220231C2 (en) | Process of control over feed of aluminum oxide into electrolytic cells to win aluminum | |
| US3616316A (en) | Reduction cell control system |
Legal Events
| Date | Code | Title | Description |
|---|---|---|---|
| PUAI | Public reference made under article 153(3) epc to a published international application that has entered the european phase |
Free format text: ORIGINAL CODE: 0009012 |
|
| AK | Designated contracting states |
Kind code of ref document: A2 Designated state(s): AT DE ES FR GB GR IT NL |
|
| PUAL | Search report despatched |
Free format text: ORIGINAL CODE: 0009013 |
|
| AK | Designated contracting states |
Kind code of ref document: A3 Designated state(s): AT DE ES FR GB GR IT NL |
|
| 17P | Request for examination filed |
Effective date: 19910102 |
|
| 17Q | First examination report despatched |
Effective date: 19930212 |
|
| GRAA | (expected) grant |
Free format text: ORIGINAL CODE: 0009210 |
|
| AK | Designated contracting states |
Kind code of ref document: B1 Designated state(s): AT DE ES FR GB GR IT NL |
|
| PG25 | Lapsed in a contracting state [announced via postgrant information from national office to epo] |
Ref country code: ES Free format text: THE PATENT HAS BEEN ANNULLED BY A DECISION OF A NATIONAL AUTHORITY Effective date: 19960131 Ref country code: AT Effective date: 19960131 Ref country code: GR Free format text: LAPSE BECAUSE OF FAILURE TO SUBMIT A TRANSLATION OF THE DESCRIPTION OR TO PAY THE FEE WITHIN THE PRESCRIBED TIME-LIMIT Effective date: 19960131 Ref country code: IT Free format text: LAPSE BECAUSE OF FAILURE TO SUBMIT A TRANSLATION OF THE DESCRIPTION OR TO PAY THE FEE WITHIN THE PRE;WARNING: LAPSES OF ITALIAN PATENTS WITH EFFECTIVE DATE BEFORE 2007 MAY HAVE OCCURRED AT ANY TIME BEFORE 2007. THE CORRECT EFFECTIVE DATE MAY BE DIFFERENT FROM THE ONE RECORDED.SCRIBED TIME-LIMIT Effective date: 19960131 |
|
| REF | Corresponds to: |
Ref document number: 133721 Country of ref document: AT Date of ref document: 19960215 Kind code of ref document: T |
|
| XX | Miscellaneous (additional remarks) |
Free format text: TEILANMELDUNG 95201436.3 EINGEREICHT AM 19/02/90. |
|
| REF | Corresponds to: |
Ref document number: 69025080 Country of ref document: DE Date of ref document: 19960314 |
|
| PG25 | Lapsed in a contracting state [announced via postgrant information from national office to epo] |
Ref country code: DE Effective date: 19960501 |
|
| ET | Fr: translation filed | ||
| PLBE | No opposition filed within time limit |
Free format text: ORIGINAL CODE: 0009261 |
|
| STAA | Information on the status of an ep patent application or granted ep patent |
Free format text: STATUS: NO OPPOSITION FILED WITHIN TIME LIMIT |
|
| 26N | No opposition filed | ||
| PGFP | Annual fee paid to national office [announced via postgrant information from national office to epo] |
Ref country code: FR Payment date: 19990209 Year of fee payment: 10 |
|
| PGFP | Annual fee paid to national office [announced via postgrant information from national office to epo] |
Ref country code: GB Payment date: 19990218 Year of fee payment: 10 |
|
| PGFP | Annual fee paid to national office [announced via postgrant information from national office to epo] |
Ref country code: NL Payment date: 19990224 Year of fee payment: 10 |
|
| PG25 | Lapsed in a contracting state [announced via postgrant information from national office to epo] |
Ref country code: GB Free format text: LAPSE BECAUSE OF NON-PAYMENT OF DUE FEES Effective date: 20000219 |
|
| PG25 | Lapsed in a contracting state [announced via postgrant information from national office to epo] |
Ref country code: NL Free format text: LAPSE BECAUSE OF NON-PAYMENT OF DUE FEES Effective date: 20000901 |
|
| GBPC | Gb: european patent ceased through non-payment of renewal fee |
Effective date: 20000219 |
|
| PG25 | Lapsed in a contracting state [announced via postgrant information from national office to epo] |
Ref country code: FR Free format text: LAPSE BECAUSE OF NON-PAYMENT OF DUE FEES Effective date: 20001031 |
|
| NLV4 | Nl: lapsed or anulled due to non-payment of the annual fee |
Effective date: 20000901 |
|
| REG | Reference to a national code |
Ref country code: FR Ref legal event code: ST |