EP0357191B1 - Method of color selection for display and printing - Google Patents
Method of color selection for display and printing Download PDFInfo
- Publication number
- EP0357191B1 EP0357191B1 EP89306774A EP89306774A EP0357191B1 EP 0357191 B1 EP0357191 B1 EP 0357191B1 EP 89306774 A EP89306774 A EP 89306774A EP 89306774 A EP89306774 A EP 89306774A EP 0357191 B1 EP0357191 B1 EP 0357191B1
- Authority
- EP
- European Patent Office
- Prior art keywords
- color
- intensity
- cells
- intensity level
- matrix
- Prior art date
- Legal status (The legal status is an assumption and is not a legal conclusion. Google has not performed a legal analysis and makes no representation as to the accuracy of the status listed.)
- Expired - Lifetime
Links
- 238000000034 method Methods 0.000 title claims description 25
- 239000011159 matrix material Substances 0.000 claims description 47
- 239000003086 colorant Substances 0.000 claims description 32
- 238000009826 distribution Methods 0.000 claims description 5
- 210000004027 cell Anatomy 0.000 description 83
- 239000000976 ink Substances 0.000 description 11
- 238000004364 calculation method Methods 0.000 description 5
- 238000003860 storage Methods 0.000 description 4
- 238000010894 electron beam technology Methods 0.000 description 2
- 210000004460 N cell Anatomy 0.000 description 1
- 239000000654 additive Substances 0.000 description 1
- 230000000996 additive effect Effects 0.000 description 1
- 238000009125 cardiac resynchronization therapy Methods 0.000 description 1
- 238000006243 chemical reaction Methods 0.000 description 1
- 230000001419 dependent effect Effects 0.000 description 1
- 230000008030 elimination Effects 0.000 description 1
- 238000003379 elimination reaction Methods 0.000 description 1
- 230000007773 growth pattern Effects 0.000 description 1
- 238000002372 labelling Methods 0.000 description 1
- 230000005055 memory storage Effects 0.000 description 1
- 229920006395 saturated elastomer Polymers 0.000 description 1
- 238000003892 spreading Methods 0.000 description 1
- 210000000352 storage cell Anatomy 0.000 description 1
Images

Classifications
-
- H—ELECTRICITY
- H04—ELECTRIC COMMUNICATION TECHNIQUE
- H04N—PICTORIAL COMMUNICATION, e.g. TELEVISION
- H04N1/00—Scanning, transmission or reproduction of documents or the like, e.g. facsimile transmission; Details thereof
- H04N1/46—Colour picture communication systems
- H04N1/52—Circuits or arrangements for halftone screening
Definitions
- This invention relates to a method of color selection for display or printing of electronic color images.
- this invention relates to the conversion and storage of electrical images suitable for display on a color raster scan cathode ray tube (CRT) or for use in a color printer, such as an ink jet or other color graphic printer, for example, a laser scanning printer system.
- CTR color raster scan cathode ray tube
- a color printer such as an ink jet or other color graphic printer, for example, a laser scanning printer system.
- halftone dot patterns or color matrices
- these matrices look like discrete dot patterns, but will look to a viewer like the desired palette color when viewed from a normal viewing distance.
- the invention provides a method for selecting the intensity level of each of the primary colors for displaying or printing a predetermined, desired color to be composed of a specified percent of each of the primary colors.
- Each primary color has available a predetermined number of discrete intensity levels ranging from minimum to maximum, and is to be displayed on a matrix having a predetermined number of cells N.
- the method of the invention comprises (1) selecting an intensity level for each primary color from a plurality of predetermined discrete energy levels and selecting the number of cells of the matrix which are to display that color at the desired intensity level; and (2) arranging the selected cells of each primary color in the matrix in a predetermined ordering to display the desired color, the sequence of the ordering being predetermined and the same for each primary color, the starting point of the sequence for one of the primary colors being fixed, but the starting point for the sequence for each successive primary color is determined based upon the ending cell location of the sequence of cells for the preceding color.
- each primary color is represented by two discrete intensity levels which approximate the specified percent for that color, one level L being below or equal to the specified percent and the other level H being above or equal to the specified percent.
- the cells of intensity level H and the cells of intensity level L are arranged in the matrix in a predetermined ordering to display the desired color, the sequence of ordering being predetermined and the same for each primary color.
- the starting point of the sequence for one of the sets of cells for one of the intensity levels of the first of the primary colors is fixed, but the starting point for the sets of cells of the one intensity level for each successive primary color being dependent upon the ending cell location of the set of cells for that same intensity level for the preceding color.
- the discrete intensity level for each primary color is selected from a predetermined set of available intensity levels for that color.
- the product of the numbers of available intensity levels for each primary color is less than or equal to the number of storage cells available for the storage of color selection information.
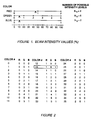
- FIG. 1 is a graph relating beam intensity values to the selected discrete possible color intensity levels for each color.
- FIG. 2 is a table of colors for a particular example of the invention.
- FIG. 3 is a table of intensity levels for an example of the invention.
- FIG. 4 is a 3 X 3 matrix of colors in accordance with an example of the invention.
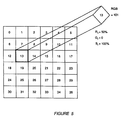
- FIG. 5 shows the relationship between the available color palette from a color table and the selected beam intensities.
- the method of this invention is used to select the intensity level of each of the primary colors for displaying or printing a predetermined, desired color to be composed of a specified percent of each of the three primary colors.
- each primary color has available a predetermined number of discrete intensity levels ranging from minimum intensity, which may be zero, to a maximum intensity, which may be the maximum power that the electron beam is capable of delivering, or, in the case of a printer, the amount of that color which fills a particular area with ink of the desired color.
- the intensity of each color is normally controlled by a voltage.
- that voltage is used to control the intensity of an electron beam for that color.
- the voltage controls the flow of ink and thus the size of the ink drop which is deposited. The control of ink jet printers is described in U.S. Patent 4,412,225, referenced earlier.
- a CRT has one beam for each of the three primary colors, red, green and blue.
- black ink in addition to the primary color inks, there may also be a supply of black ink because it is more efficient to use black ink for the color black than to combine the three primary colors, red, green and blue to achieve a black color.
- the usual primary colors are red, green and blue, it is sometimes preferable to use additive or subtractive primary colors, such a magenta, cyan and yellow, as employed in the method of color representation described in U.S. Patent 4,412,225.
- the example selected for explanation in connection with this invention employs the normal primary colors red, green and blue.
- the eye is more sensitive to certain colors than it is to other colors. In the case of the primaries, the eye is most sensitive to green, less sensitive to blue, with red being somewhere in the middle. Accordingly, if you have a limited number of discrete intensity level possibilities, it is preferable to have more gradations of green, for example, than of blue. The human eye will be better able to discern green gradations than it will gradations of blue or red.
- the intensity levels were selected using equal, discrete intensity intervals. However, they would not have to have been selected with equal intervals.
- the six green beam intensity levels were selected at 20%, 40%, 60%, 80% and 100%, as shown in the table. However, these intervals could have equally well been selected non-linearly, or logarithmically, as desired. As will be explained later, it makes no difference to the method of the invention whether each of the intensity levels are equally spaced from the preceding and succeeding ones, or not.
- the color red has three possible discrete intensity levels, 0, 1 and 2.
- Intensity level 0 corresponds to 0% beam intensity
- intensity level 1 corresponds to 50% beam intensity
- intensity level 2 corresponds to 100% beam intensity, as shown in the table.
- Green has six intensities, 0, 1, 2, 3, 4 and 5, corresponding to 0%, 20%. 40%, 60%, 80% and 100%.
- Intensity level 1 is equivalent to a beam intensity of 100 percent.
- N R for red, N G for green and N B for blue are shown at the right side of the graph.
- N R equals 3
- N G equals 6
- N B equals 2
- the total number of combinations of intensity levels for the three primary colors is the product of these three numbers, or 36.
- FIG. 2 is a table of 36 possible colors which combine the available discrete intensity levels of red, green and blue. Since there are only two possible blue intensity levels, the blue "B" column in FIG. 2 is binary, changing only from 0 to 1, the radix number being 2. Since there are six possible values of green, the green column varies from 0 to 5, the radix number being 6. With three possibilities of red, the red column varies from 0 to 2 and the radix number is 3.
- FIG. 3 For illustration, the example shown in FIG. 3 will be used. It is assumed that the method of the invention is to be used to display a selected color as closely as possible, which is a combination of a red intensity of 45%, a green intensity of 10% and a blue intensity of 10%. Looking back at FIG. 1, it is apparent that there is no available discrete red intensity level of 45%. The pointer below the red line just to the left of intensity level 1 indicates where on the red intensity level of 45% would lie. Since no discrete level exists at 45%, this pointer lies between 0 and 50%, or 0 and 1 on the red line. Similar pointers show where the 10 percent intensity level lies for each of green and blue. Like red, neither green nor blue has a discrete, possible intensity level of 10% available.
- the nearest lower adjacent intensity level to 45% is 0%.
- the nearest higher percent intensity level is 50% corresponding to the number 1.
- the nearest lower intensity level is 0 and the nearest higher intensity level is 20%, corresponding to the number 1.
- the nearest lower percent again is 0, and the nearest higher percent is 100%, corresponding to the number 1.
- N L an integral number of cells of intensity level L (the lower intensity) and an integral number of cells N H of intensity level H (the higher intensity level) where N H equals N-N L , N being the total number of cells in the matrix.
- a 3 X 3 matrix is used, having a total of 9 cells.
- N 9 cells.
- N 9 cells.
- a calculation is performed to ascertain how many of the 9 cells should contain, for each color, a beam of the higher intensity level, and how many should contain a beam of the lower intensity level.
- P N L *L + (N-N L )*H N
- the lower intensity nearest to 10% is 0 and the higher adjacent intensity is 20%. This results in 4 of the 9 cells of the matrix being of the lower intensity and the other 5 being of the higher intensity. Obviously, since 10% falls exactly at the midpoint between 0% and 20%, it makes no difference whether the larger number of cells is used for the higher intensity or for the lower. Indeed, the actual calculated result depends on when you do the rounding.
- An important aspect of the invention is the arrangement within the matrix of the higher and lower intensity beams.
- a unique arrangement algorithm is employed. First, it is necessary to choose a predetermined random arrangement pattern for the 9 cells of the matrix. Obviously the matrix need not have nine cells, and could have any number of cells, use any desired arrangement and need not be square.
- One possible arrangement of the cells within the matrix is to start the first cell in a corner, for example, the lower left-hand corner, labeling that cell as cell 1 (as shown in the lower right-hand corner of cell 1 shown in FIG. 4), and then to move as a knight moves on a chessboard.
- Knights move in an L-shaped pattern, either two squares in one direction and one square in the orthogonal direction, or vice versa.
- Starting at the lower left square 1 of the matrix of FIG. 4 if you move up two squares and to the right one square, you reach cell 2 of the matrix. Moving from cell 2 to the right one square and down two squares, just like the knight on a chessboard, you arrive at the lower right-hand cell 3. Moving up one square and to the left two squares brings you to cell 4. This continues in L-shaped moves to cell 8, leaving all the cells numbered except the center cell, which therefore, by process of elimination, must be cell 9.
- the unique aspect of this invention will be evident when the second color, green, is disbursed.
- the higher adjacent intensity level H for green also happens to be a 1.
- 5 high intensity level cells, or 1s are required.
- green according to the invention, one does not start putting the 1s in cell 1 at the lower left-hand corner of the matrix as one did for the first color red. Instead, one starts at the next cell after the previous color left off.
- the last H, or 1 for the red color was placed in cell 8. Therefore the first H or 1 for the green color will be placed, as shown, in cell 9. Since cell 9 is the last cell of the 9 cells in the matrix, then the next number 1 for green is to be placed in cell 1, starting the count over again, as shown in FIG. 4.
- 1s are also placed for higher intensity green in cells 2, 3 and 4, the next cells in the predetermined series, making a total of 5 green cells having the higher intensity level H or 1.
- the half-tone appearance of the matrix to the eye will be the predetermined selected color shown in FIG. 3, having a red intensity of 45%, a green intensity of 10% and a blue intensity of 10%.
- the reproduction will be extremely faithful even though only 36 possible combinations of colors are used in this example for each cell of the matrix.
- the intensity levels used in the specific example described above all turned out to be a lower intensity of 0 and a higher intensity of 1, it is apparent from FIGS. 1 and 2 that other values could have been employed.
- the desired intensity level for green had been 63 percent
- the selected lower and upper adjacent intensity levels would have been 3 and 4, respectively, rather than 0 and 1 as was the case in the example.
- some fraction of the cells of the 9-cell matrix would have required a green beam of intensity 60%, or 3, and the remainder of the cells would have required the green beam of intensity level 4, or 80 percent, the calculation of these numbers being made as described above.
- the 36 color palette shown in FIG. 2 can be stored in a 36 element array.
- six binary bits are required, representing the color data for each color of the color table shown in FIG. 2. Referring to FIGS. 2 and 5, and in particular to color 13, that color corresponds to a red intensity level of 1, a green intensity level of 0 and a blue intensity level of 1. Therefore, address 13 corresponding to the radix number 13 in the array of FIG. 5 will contain color data for color 1-0-1 which is stored in the color table shown in FIG. 2. At that address, the color corresponding to 1-0-1 for radix number 13 is stored. If the color table of FIG.
- N R VAL x (N G x N B ) + G VAL (N B ) + B VAL , where N G and N B are the number of possible intensity levels of green and blue, respectively, as shown in FIG. 1.
- the radix number 13 is arrived at for the above 1-0-1 example by multiplying the red value 1 by 12 (the product of the number of possible green levels 6 times the number of possible blue levels 2), and adding the green value 0 times the number of possible blue levels 2, plus the blue value 1.
Landscapes
- Engineering & Computer Science (AREA)
- Multimedia (AREA)
- Signal Processing (AREA)
- Facsimile Image Signal Circuits (AREA)
- Digital Computer Display Output (AREA)
- Image Generation (AREA)
- Color Image Communication Systems (AREA)
- Dot-Matrix Printers And Others (AREA)
Description
- This invention relates to a method of color selection for display or printing of electronic color images. In particular, this invention relates to the conversion and storage of electrical images suitable for display on a color raster scan cathode ray tube (CRT) or for use in a color printer, such as an ink jet or other color graphic printer, for example, a laser scanning printer system.
- Most color graphic systems require a large color palette. Generally, the more color variations a system can display or print, the better it is. Digital displays and printers currently available offer very dense displays or rasters, commonly 1,000 by 1,000 pixels. Of each pixel is to be capable of displaying or storing any single discrete color of a palette, for example, one having 256 colors, there must be sufficient color memory available to store those colors. Assuming each color corresponds to the voltages on the three separate electron guns of a CRT or the controls of an ink jet, one for each primary color, three bytes of storage may be required for the color of each pixel. If three bytes is needed for each of a million pixels, a total of 3 megabytes of RAM is needed for solely color storage.
- To reduce the memory needs and yet still provide adequate color gradations, halftone dot patterns, or color matrices, are used. If greatly magnified, these matrices look like discrete dot patterns, but will look to a viewer like the desired palette color when viewed from a normal viewing distance.
- Most prior art halftone or "dithering" techniques have used halftone matrices having certain pixels in the matrix turned on and certain pixels turned off. One example of such a system is described in U.S. Patent 4,308,553 issued on December 29, 1981. More recent advances in halftone color printing and display have not only turned pixels on and off, but also have varied the color intensity of each pixel. Such a system is described in U.S. Patent 4,412,225 issued on October 25, 1983. The halftone matrix technique used in this patent, as shown in FIGS. 7A and 7B, starts each color at a different corner of the matrix and increases the amount of that color, both by increasing the intensity of each pixel of the matrix and by increasing the number of cells of the matrix used for that color, in a growth pattern from the starting corner diagonally across the matrix until the matrix is saturated.
- The problem with this type of a spreading algorithm is that it will produce an intensity imbalance even when viewed from a distance. Moreover, this system, with an intensity variation of 0 to 7, using a 3
X 3 matrix, requires at least over ten bytes of color memory for each matrix. For a 1K X 1K display, more than a megabyte of memory would be necessary. - It would thus be desirable to have a color display system which uses substantially less memory, but still provides as good or better color and intensity uniformity over the entire display or raster.
- Briefly, the invention provides a method for selecting the intensity level of each of the primary colors for displaying or printing a predetermined, desired color to be composed of a specified percent of each of the primary colors. Each primary color has available a predetermined number of discrete intensity levels ranging from minimum to maximum, and is to be displayed on a matrix having a predetermined number of cells N. The method of the invention comprises (1) selecting an intensity level for each primary color from a plurality of predetermined discrete energy levels and selecting the number of cells of the matrix which are to display that color at the desired intensity level; and (2) arranging the selected cells of each primary color in the matrix in a predetermined ordering to display the desired color, the sequence of the ordering being predetermined and the same for each primary color, the starting point of the sequence for one of the primary colors being fixed, but the starting point for the sequence for each successive primary color is determined based upon the ending cell location of the sequence of cells for the preceding color.
- In a preferred embodiment of the invention, each primary color is represented by two discrete intensity levels which approximate the specified percent for that color, one level L being below or equal to the specified percent and the other level H being above or equal to the specified percent. For each primary color, the method of the invention requires selecting the number of cells NL of the matrix of intensity level L and the number of cells NH of the matrix of intensity level H, wherein the number of cells in the matrix N=NL+NH. For each primary color, the cells of intensity level H and the cells of intensity level L are arranged in the matrix in a predetermined ordering to display the desired color, the sequence of ordering being predetermined and the same for each primary color. The starting point of the sequence for one of the sets of cells for one of the intensity levels of the first of the primary colors is fixed, but the starting point for the sets of cells of the one intensity level for each successive primary color being dependent upon the ending cell location of the set of cells for that same intensity level for the preceding color.
- In order to determine the integral number of cells NL of the N-cell matrix of intensity level L, and the integral number of cells NH of the matrix of intensity level H, where NH equals N-NL the method of the invention uses the formula:

to arrive at the nearest approximation of the desired intensity level P for the primary color, wherein P equals the desired percent intensity for the primary color expressed as a number from 0 to 100. - In a preferred embodiment, the discrete intensity level for each primary color is selected from a predetermined set of available intensity levels for that color. The product of the numbers of available intensity levels for each primary color is less than or equal to the number of storage cells available for the storage of color selection information.
- Using the method of this invention, it has been found possible to obtain a very uniform color intensity distribution. Moreover, the amount of memory required to store the data representing a palette of colors is substantially reduced from what was required in the prior art. Using the techniques described herein, a very large, fine-grain palette of colors may be faithfully reproduced from a relatively small amount of digital color data.
- The following patents, while failing to disclose the method described and claimed herein, describe various techniques for representing halftone images: United States patent Nos. 4,308,553; 4,367,482; 4,412,225; 4,614,967; 4,674,861; 4,680,596; and 4,680,625.
- FIG. 1 is a graph relating beam intensity values to the selected discrete possible color intensity levels for each color.
- FIG. 2 is a table of colors for a particular example of the invention.
- FIG. 3 is a table of intensity levels for an example of the invention;
- FIG. 4 is a 3
X 3 matrix of colors in accordance with an example of the invention; and - FIG. 5 shows the relationship between the available color palette from a color table and the selected beam intensities.
- The method of this invention is used to select the intensity level of each of the primary colors for displaying or printing a predetermined, desired color to be composed of a specified percent of each of the three primary colors. In the method of the invention, each primary color has available a predetermined number of discrete intensity levels ranging from minimum intensity, which may be zero, to a maximum intensity, which may be the maximum power that the electron beam is capable of delivering, or, in the case of a printer, the amount of that color which fills a particular area with ink of the desired color. In ink jet printers, like CRTs, the intensity of each color is normally controlled by a voltage. In the case of a CRT, that voltage is used to control the intensity of an electron beam for that color. In the case of an ink jet printer, the voltage controls the flow of ink and thus the size of the ink drop which is deposited. The control of ink jet printers is described in U.S. Patent 4,412,225, referenced earlier.
- Most commonly, a CRT has one beam for each of the three primary colors, red, green and blue. In the case of a printer, in addition to the primary color inks, there may also be a supply of black ink because it is more efficient to use black ink for the color black than to combine the three primary colors, red, green and blue to achieve a black color. Moreover, although the usual primary colors are red, green and blue, it is sometimes preferable to use additive or subtractive primary colors, such a magenta, cyan and yellow, as employed in the method of color representation described in U.S. Patent 4,412,225. The example selected for explanation in connection with this invention, however, employs the normal primary colors red, green and blue.
- It is well known that the eye is more sensitive to certain colors than it is to other colors. In the case of the primaries, the eye is most sensitive to green, less sensitive to blue, with red being somewhere in the middle. Accordingly, if you have a limited number of discrete intensity level possibilities, it is preferable to have more gradations of green, for example, than of blue. The human eye will be better able to discern green gradations than it will gradations of blue or red.
- In the color table example illustrated in FIG. 1, the intensity levels were selected using equal, discrete intensity intervals. However, they would not have to have been selected with equal intervals. Referring to FIG. 1, the six green beam intensity levels were selected at 20%, 40%, 60%, 80% and 100%, as shown in the table. However, these intervals could have equally well been selected non-linearly, or logarithmically, as desired. As will be explained later, it makes no difference to the method of the invention whether each of the intensity levels are equally spaced from the preceding and succeeding ones, or not.
- Referring to FIG. 1, the color red has three possible discrete intensity levels, 0, 1 and 2.
Intensity level 0 corresponds to 0% beam intensity;intensity level 1 corresponds to 50% beam intensity; andintensity level 2 corresponds to 100% beam intensity, as shown in the table. In the case of blue, only two intensity levels are used,intensity level 0 andlevel 1. Green has six intensities, 0, 1, 2, 3, 4 and 5, corresponding to 0%, 20%. 40%, 60%, 80% and 100%.Intensity level 1 is equivalent to a beam intensity of 100 percent. - The number of possible discrete intensity levels for each color, NR for red, NG for green and NB for blue are shown at the right side of the graph. In the example where NR equals 3, NG equals 6 and NB equals 2, the total number of combinations of intensity levels for the three primary colors is the product of these three numbers, or 36. A table using a numbering system based upon the possible number of intensity levels, having as the radix number for each color the number of possible intensity levels for that color, is shown in FIG. 2. Note that FIG. 2 is a table of 36 possible colors which combine the available discrete intensity levels of red, green and blue. Since there are only two possible blue intensity levels, the blue "B" column in FIG. 2 is binary, changing only from 0 to 1, the radix number being 2. Since there are six possible values of green, the green column varies from 0 to 5, the radix number being 6. With three possibilities of red, the red column varies from 0 to 2 and the radix number is 3.
- For illustration, the example shown in FIG. 3 will be used. It is assumed that the method of the invention is to be used to display a selected color as closely as possible, which is a combination of a red intensity of 45%, a green intensity of 10% and a blue intensity of 10%. Looking back at FIG. 1, it is apparent that there is no available discrete red intensity level of 45%. The pointer below the red line just to the left of
intensity level 1 indicates where on the red intensity level of 45% would lie. Since no discrete level exists at 45%, this pointer lies between 0 and 50%, or 0 and 1 on the red line. Similar pointers show where the 10 percent intensity level lies for each of green and blue. Like red, neither green nor blue has a discrete, possible intensity level of 10% available. - According to the method of this invention, for each primary color, it is necessary to determine the two nearest discrete intensity levels approximating the specified percent for that color. One such level L lies below or equal to the specified percent, and the other such level, H, lies above or equal to the specified percent. Accordingly, for red, the nearest lower adjacent intensity level to 45% is 0%. The nearest higher percent intensity level is 50% corresponding to the
number 1. For green, the nearest lower intensity level is 0 and the nearest higher intensity level is 20%, corresponding to thenumber 1. For blue, the nearest lower percent again is 0, and the nearest higher percent is 100%, corresponding to thenumber 1. - Next, according to the method of the invention, for each primary color one selects an integral number of cells NL of a matrix of cells of intensity level L (the lower intensity) and an integral number of cells NH of intensity level H (the higher intensity level) where NH equals N-NL, N being the total number of cells in the matrix.
- In the example illustrated, a 3
X 3 matrix is used, having a total of 9 cells. Thus N equals 9. For displaying each primary color, each of those cells is filled with that color at an intensity level corresponding either to the higher or lower adjacent intensity levels H or L. A calculation is performed to ascertain how many of the 9 cells should contain, for each color, a beam of the higher intensity level, and how many should contain a beam of the lower intensity level. - The formula useful in making this calculation is:

where P equals the specified percent intensity for the selected primary color. For example, if one is calculating the cell distribution for red, whose desired intensity is 45%, the desired P equals 45. L is the closest lower intensity percent for the red beam, which in this example is 0. H is the closest higher intensity percent, which for the red beam is 50. Solving the equation for NL, with N=9, results in NL=0.9. Rounding that to an integer tells one to use one cell of the lower intensity (0% in the case of red) for the red beam. N-NL equals 8. This tells one to use 8 of the 9 cells with the red beam at the higher adjacent intensity, which in this example is 50 percent. The actual P for red is 400/9, or 44.4%. - Making the same calculation for the green beam, the lower intensity nearest to 10% is 0 and the higher adjacent intensity is 20%. This results in 4 of the 9 cells of the matrix being of the lower intensity and the other 5 being of the higher intensity. Obviously, since 10% falls exactly at the midpoint between 0% and 20%, it makes no difference whether the larger number of cells is used for the higher intensity or for the lower. Indeed, the actual calculated result depends on when you do the rounding.
- In the case of the blue beam, H equals 100% and L equals 0. Solving the equation for blue, NL equals 8.1 which rounds to 8. Accordingly, for blue, one uses 8 cells of the lower (0%) intensity and 1 cell of the higher (100%) intensity.
- An important aspect of the invention is the arrangement within the matrix of the higher and lower intensity beams. In this invention, a unique arrangement algorithm is employed. First, it is necessary to choose a predetermined random arrangement pattern for the 9 cells of the matrix. Obviously the matrix need not have nine cells, and could have any number of cells, use any desired arrangement and need not be square.
- One possible arrangement of the cells within the matrix is to start the first cell in a corner, for example, the lower left-hand corner, labeling that cell as cell 1 (as shown in the lower right-hand corner of
cell 1 shown in FIG. 4), and then to move as a knight moves on a chessboard. Knights move in an L-shaped pattern, either two squares in one direction and one square in the orthogonal direction, or vice versa. Starting at the lowerleft square 1 of the matrix of FIG. 4, if you move up two squares and to the right one square, you reachcell 2 of the matrix. Moving fromcell 2 to the right one square and down two squares, just like the knight on a chessboard, you arrive at the lower right-hand cell 3. Moving up one square and to the left two squares brings you tocell 4. This continues in L-shaped moves tocell 8, leaving all the cells numbered except the center cell, which therefore, by process of elimination, must becell 9. - Many other sequences, random or sequential, may also be used. For example, it is possible to start counting in the center cell and wind around clockwise or counterclockwise to the outside. It isn't important what pattern is chosen, as long as it is followed consistently.
- According to the previous calculations, it was determined that for red, 8 cells were to be designated at the
higher intensity 1 and one cell at thelower intensity 0. For the color green, 5 cells are to be at thehigher intensity lower intensity 0. For the color blue, one cell is to be at thehigher intensity 1 and the remaining 8 cells at thelower intensity 0. - It is a matter of choice which color you start out with in the matrix. In this example, assume one started with the color red. The higher intensity for red is shown on the color table of FIG. 1 as a 1. Note that the red beam in FIG. 4 is the upper center beam of the triangle R-G-B shown at the right of the Figure. This arrangement of the three colors is uniform throughout the nine cells. The algorithm determined that 8 red cells were to be at the higher intensity level. The higher intensity level of red is illustrated with the
number 1, and it appears incells cell 9, at the top center, that a 0 appears, indicating the lower intensity for the red beam. The order of these 8 selected higher intensity cells is the predetermined order in accordance with the L-shaped selection algorithm described above. - The unique aspect of this invention will be evident when the second color, green, is disbursed. The higher adjacent intensity level H for green also happens to be a 1. For green, 5 high intensity level cells, or 1s, are required. For this second color, green, according to the invention, one does not start putting the 1s in
cell 1 at the lower left-hand corner of the matrix as one did for the first color red. Instead, one starts at the next cell after the previous color left off. The last H, or 1 for the red color was placed incell 8. Therefore the first H or 1 for the green color will be placed, as shown, incell 9. Sincecell 9 is the last cell of the 9 cells in the matrix, then thenext number 1 for green is to be placed incell 1, starting the count over again, as shown in FIG. 4. Similarly 1s are also placed for higher intensity green incells - If each of the three beams for each of the cells of the matrix of FIG. 4 is illuminated with its appropriate intensity, the half-tone appearance of the matrix to the eye will be the predetermined selected color shown in FIG. 3, having a red intensity of 45%, a green intensity of 10% and a blue intensity of 10%. The reproduction will be extremely faithful even though only 36 possible combinations of colors are used in this example for each cell of the matrix.
- Finally, for blue, only one cell of high intensity level H, or 1 is required. Since the series of Hs for the green cells left off at
cell 4, this one H or 1 for the blue cell will be placed incell 5. - It has been found that using the algorithm of this invention, following the selected intensity level pattern of one primary color from the previous, rather than starting over each time at
cell 1, provides a substantially more uniform intensity distribution than could be accomplished using the techniques of the prior art. - Although the intensity levels used in the specific example described above all turned out to be a lower intensity of 0 and a higher intensity of 1, it is apparent from FIGS. 1 and 2 that other values could have been employed. For example, if the desired intensity level for green had been 63 percent, the selected lower and upper adjacent intensity levels would have been 3 and 4, respectively, rather than 0 and 1 as was the case in the example. Depending on where the desired green intensity was to be, between 60 and 80%, some fraction of the cells of the 9-cell matrix would have required a green beam of
intensity 60%, or 3, and the remainder of the cells would have required the green beam ofintensity level - To reduce memory storage required, the 36 color palette shown in FIG. 2 can be stored in a 36 element array. To store each of the 36 colors, six binary bits are required, representing the color data for each color of the color table shown in FIG. 2. Referring to FIGS. 2 and 5, and in particular to
color 13, that color corresponds to a red intensity level of 1, a green intensity level of 0 and a blue intensity level of 1. Therefore, address 13 corresponding to theradix number 13 in the array of FIG. 5 will contain color data for color 1-0-1 which is stored in the color table shown in FIG. 2. At that address, the color corresponding to 1-0-1 forradix number 13 is stored. If the color table of FIG. 2 is stored in the CRT, the color 1-0-1 red=1, green=0, blue=1) is then translated by the CRT hardware to a red beam intensity of 50%, a green beam intensity of 0 and a blue beam intensity of 100%. In order to calculate any color number, which corresponds to a radix number N, it is only necessary to use the formula N = RVAL x (NG x NB) + GVAL (NB) + BVAL, where NG and NB are the number of possible intensity levels of green and blue, respectively, as shown in FIG. 1. Theradix number 13 is arrived at for the above 1-0-1 example by multiplying thered value 1 by 12 (the product of the number of possiblegreen levels 6 times the number of possible blue levels 2), and adding thegreen value 0 times the number of possibleblue levels 2, plus theblue value 1. - Similarly, it is possible to translate the upper left-
hand cell number 7 in FIG. 4, which uses a red intensity value of 1, and green and blue intensity values of 0, to aradix number 12 corresponding to color 12 in FIG. 2. Similarly,cell 2 translates to color 14 in FIG. 2.
Claims (4)
- A method for selecting the intensity level of each of the primary colors for displaying or printing a predetermined, desired color to be composed of a specified per cent of each of the primary colors, wherein each primary color has available a predetermined number of discrete intensity levels ranging from minimum to maximum, and wherein each primary color is to be displayed on a matrix having a predetermined number of cells, characterised by:
selecting an intensity level for each primary color from a plurality of predetermined discrete energy levels, and selecting the number of cells of said matrix which are to display that color at said intensity level;
arranging the selected cells of each primary color in said matrix in a predetermined ordering to display the desired color, the sequence of the ordering being predetermined and the same for each primary color, the starting point of said sequence for one of said primary colors being fixed, but the starting point for the sequence for each successive primary color is determined based upon the ending cell location of the sequence of cells for the preceding color. - The method of claim 1 for selecting the intensity level of each of the primary colors for displaying or printing a predetermined, desired color further characterized in that:
the desired intensity level for each primary color is made up of two discrete intensity levels approximating the specified per cent for that color, one level L being below or equal to the specified per cent and the other level H being above or equal to the specified per cent;
for each primary color, the number of cells of the matrix of intensity level L and the number of cells of the matrix of intensity level H are selected; and
the starting point of the sequence of ordering for one of the sets of cells of one of the intensity levels of the first of the primary colors is fixed, but the starting point for the set of cells of that intensity level for each successive primary color is determined based upon the ending cell location of the set of cells of that same intensity level for the preceding color. - The method of claim 2 for selecting the intensity level of each of the primary colors for displaying or printing a predetermined, desired color further characterized in that:
the predetermined number of cells in N;
the two discrete intensity levels most closely approximate the specified per cent for that color; and
for each primary color, the integral number of cells of the matrix of intensity level L selected is NL and the integral number of cells of the matrix of intensity level H selected is NH, where NH = N - NL, using the formula
- The method of claim 2 for selecting the intensity level of each of the primary colors for the display or printing of a predetermined, desired color further characterized in that:
the discrete intensity levels are selected from a predetermined set of available intensity levels for each color; and
for each primary color, the number and distribution of cells of the matrix of intensity level L and the number and distribution of cells of the matrix of intensity level H are made to create an average intensity of each primary color over the matrix so that, when the primary colors are combined in the matrix, the image of the desired color is reproduced.
Applications Claiming Priority (2)
| Application Number | Priority Date | Filing Date | Title |
|---|---|---|---|
| US07/239,299 US4837613A (en) | 1988-09-01 | 1988-09-01 | Method of color selection for display and printing |
| US239299 | 1988-09-01 |
Publications (3)
| Publication Number | Publication Date |
|---|---|
| EP0357191A2 EP0357191A2 (en) | 1990-03-07 |
| EP0357191A3 EP0357191A3 (en) | 1991-11-06 |
| EP0357191B1 true EP0357191B1 (en) | 1995-02-22 |
Family
ID=22901553
Family Applications (1)
| Application Number | Title | Priority Date | Filing Date |
|---|---|---|---|
| EP89306774A Expired - Lifetime EP0357191B1 (en) | 1988-09-01 | 1989-07-04 | Method of color selection for display and printing |
Country Status (5)
| Country | Link |
|---|---|
| US (1) | US4837613A (en) |
| EP (1) | EP0357191B1 (en) |
| JP (1) | JP2840960B2 (en) |
| CA (1) | CA1316615C (en) |
| DE (1) | DE68921267T2 (en) |
Families Citing this family (29)
| Publication number | Priority date | Publication date | Assignee | Title |
|---|---|---|---|---|
| US5138303A (en) * | 1989-10-31 | 1992-08-11 | Microsoft Corporation | Method and apparatus for displaying color on a computer output device using dithering techniques |
| US5031050A (en) * | 1990-02-26 | 1991-07-09 | Hewlett-Packard Company | Method and system for reproducing monochromatic and color images using ordered dither and error diffusion |
| US5485558A (en) * | 1990-05-22 | 1996-01-16 | Microsoft Corporation | Method and system for displaying color on a computer output device using dithering techniques |
| US5287195A (en) * | 1990-09-17 | 1994-02-15 | Phoenix Technologies Ltd. | Image display apparatus and method using halftone super cells |
| US5309246A (en) * | 1991-09-18 | 1994-05-03 | Eastman Kodak Company | Technique for generating additional colors in a halftone color image through use of overlaid primary colored halftone dots of varying size |
| US5748195A (en) * | 1992-10-29 | 1998-05-05 | International Business Machines Corporation | Method and means for evaluating a tetrahedral linear interpolation function |
| US5432892A (en) * | 1992-11-25 | 1995-07-11 | International Business Machines Corporation | Volummetric linear interpolation |
| US5390035A (en) * | 1992-12-23 | 1995-02-14 | International Business Machines Corporation | Method and means for tetrahedron/octahedron packing and tetrahedron extraction for function approximation |
| US5751926A (en) * | 1992-12-23 | 1998-05-12 | International Business Machines Corporation | Function approximation using a centered cubic packing with tetragonal disphenoid extraction |
| AUPM440994A0 (en) * | 1994-03-11 | 1994-04-14 | Canon Information Systems Research Australia Pty Ltd | A luminance weighted discrete level display |
| US5528377A (en) * | 1994-03-29 | 1996-06-18 | E. I. Du Pont De Nemours And Company | Extended density color printing |
| WO1996004748A1 (en) * | 1994-07-29 | 1996-02-15 | The Harlequin Group Limited | Image display using evenly distributed intensity clusters |
| US5579457A (en) * | 1994-07-29 | 1996-11-26 | The Harlequin Group Ltd. | Image display apparatus and method using irregularly placed curving structures |
| US6137494A (en) * | 1995-08-18 | 2000-10-24 | International Business Machines Corporation | Method and means for evaluating a tetrahedral linear interpolation function |
| US6646759B1 (en) * | 1996-05-15 | 2003-11-11 | Canon Kabushiki Kaisha | Printing apparatus and image output control apparatus for processing image data using a dither pattern |
| US5898436A (en) * | 1997-12-05 | 1999-04-27 | Hewlett-Packard Company | Graphical user interface for digital image editing |
| US7054038B1 (en) | 2000-01-04 | 2006-05-30 | Ecole polytechnique fédérale de Lausanne (EPFL) | Method and apparatus for generating digital halftone images by multi color dithering |
| US7375844B2 (en) * | 2000-12-22 | 2008-05-20 | Seiko Epson Corporation | Method for generating a print data file, method for storing print data, a data storage medium therefor, and an apparatus for generating a data storage file |
| US7283275B2 (en) * | 2000-12-28 | 2007-10-16 | Seiko Epson Corporation | Logo data generating apparatus, logo data generating method, and data storage medium |
| US7085006B2 (en) * | 2000-12-28 | 2006-08-01 | Seiko Epson Corporation | Apparatus for generating two color printing data, a method for generating two color printing data and recording media |
| US7428074B2 (en) * | 2000-12-28 | 2008-09-23 | Seiko Epson Corporation | Logo data generating apparatus, logo data generating method, and data storage medium |
| US7292369B2 (en) * | 2000-12-28 | 2007-11-06 | Seiko Epson Corporation | Logo data generating method and system |
| US7280258B2 (en) * | 2001-01-05 | 2007-10-09 | Seiko Epson Corporation | Logo data generating system, logo data generating method, and data storage medium |
| US6847377B2 (en) * | 2001-01-05 | 2005-01-25 | Seiko Epson Corporation | System, method and computer program converting pixels to luminance levels and assigning colors associated with luminance levels in printer or display output devices |
| TWI238637B (en) * | 2001-01-10 | 2005-08-21 | Ibm | Method and system for processing of documents with electronic signatures |
| JP2007318672A (en) * | 2006-05-29 | 2007-12-06 | Canon Inc | Image processing apparatus and image processing method |
| EP3370782A4 (en) | 2015-11-02 | 2019-07-24 | Pura Scents, Inc. | DISTRIBUTION OF FRAGRANCE |
| USD816506S1 (en) | 2015-11-02 | 2018-05-01 | Pura Scents, Inc. | Vial for a scent dispenser |
| USD809116S1 (en) | 2015-11-02 | 2018-01-30 | Pura Scents | Dispenser |
Family Cites Families (6)
| Publication number | Priority date | Publication date | Assignee | Title |
|---|---|---|---|---|
| DE1772367C3 (en) * | 1968-05-04 | 1974-10-31 | Dr.-Ing. Rudolf Hell Gmbh, 2300 Kiel | Process for the rasterized reproduction of halftone images |
| JPS58219867A (en) * | 1982-06-14 | 1983-12-21 | Canon Inc | Color reproduction method |
| JPS59205876A (en) * | 1983-05-10 | 1984-11-21 | Canon Inc | Method and apparatus for processing color picture |
| US4771275A (en) * | 1983-11-16 | 1988-09-13 | Eugene Sanders | Method and apparatus for assigning color values to bit map memory display locations |
| US4730185A (en) * | 1984-07-06 | 1988-03-08 | Tektronix, Inc. | Graphics display method and apparatus for color dithering |
| US4680596A (en) * | 1984-08-02 | 1987-07-14 | Metromedia Company | Method and apparatus for controlling ink-jet color printing heads |
-
1988
- 1988-09-01 US US07/239,299 patent/US4837613A/en not_active Expired - Lifetime
-
1989
- 1989-07-04 DE DE68921267T patent/DE68921267T2/en not_active Expired - Lifetime
- 1989-07-04 EP EP89306774A patent/EP0357191B1/en not_active Expired - Lifetime
- 1989-08-28 JP JP1218766A patent/JP2840960B2/en not_active Expired - Lifetime
- 1989-08-31 CA CA000609993A patent/CA1316615C/en not_active Expired - Fee Related
Also Published As
| Publication number | Publication date |
|---|---|
| EP0357191A2 (en) | 1990-03-07 |
| EP0357191A3 (en) | 1991-11-06 |
| DE68921267T2 (en) | 1995-07-06 |
| CA1316615C (en) | 1993-04-20 |
| JPH02113329A (en) | 1990-04-25 |
| US4837613A (en) | 1989-06-06 |
| DE68921267D1 (en) | 1995-03-30 |
| JP2840960B2 (en) | 1998-12-24 |
Similar Documents
| Publication | Publication Date | Title |
|---|---|---|
| US4837613A (en) | Method of color selection for display and printing | |
| US4680596A (en) | Method and apparatus for controlling ink-jet color printing heads | |
| US5734369A (en) | Method and apparatus for dithering images in a digital display system | |
| US4930018A (en) | Method and system for enhancing the quality of both color and black and white images produced by ink jet printers | |
| US4509043A (en) | Method and apparatus for displaying images | |
| US5012257A (en) | Ink jet color graphics printing | |
| US5187578A (en) | Tone display method and apparatus reducing flicker | |
| US4736254A (en) | Method and apparatus for generating pseudo-halftone dots by comparing gray scale values of an original with dither threshold values stored in cells of a matrix array divided into imaginary matrices of elemental areas each containing one cell | |
| KR100454786B1 (en) | Gradation display method of television image signal and apparatus therefor | |
| US3843959A (en) | Matrix type display driving system | |
| US6297788B1 (en) | Half tone display method of display panel | |
| US5553165A (en) | Parallel error diffusion method and apparatus | |
| US5175807A (en) | Video signal processing with added probabilistic dither | |
| US4071843A (en) | Video color display system | |
| WO1986005901A1 (en) | Apparatus and method for modifying color digital images | |
| EP0270259B1 (en) | Improvements relating to video signal processing systems | |
| EP0004797A2 (en) | Video display control apparatus | |
| US4743962A (en) | Method of creating a representation of a colored image | |
| GB2032740A (en) | Programmable color mapping | |
| KR100720347B1 (en) | Color image display method | |
| EP0346090B1 (en) | Graphic dot flare apparatus | |
| JPH0355829B2 (en) | ||
| KR100524542B1 (en) | An addressing process and device for plasma panels | |
| EP0954164B1 (en) | Printer with progressive column error diffusion system and method of using the same for improved printer throughput | |
| US7158155B2 (en) | Subfield coding circuit and subfield coding method |
Legal Events
| Date | Code | Title | Description |
|---|---|---|---|
| PUAI | Public reference made under article 153(3) epc to a published international application that has entered the european phase |
Free format text: ORIGINAL CODE: 0009012 |
|
| AK | Designated contracting states |
Kind code of ref document: A2 Designated state(s): DE FR GB IT NL SE |
|
| PUAL | Search report despatched |
Free format text: ORIGINAL CODE: 0009013 |
|
| AK | Designated contracting states |
Kind code of ref document: A3 Designated state(s): DE FR GB IT NL SE |
|
| 17P | Request for examination filed |
Effective date: 19920505 |
|
| 17Q | First examination report despatched |
Effective date: 19930927 |
|
| GRAA | (expected) grant |
Free format text: ORIGINAL CODE: 0009210 |
|
| AK | Designated contracting states |
Kind code of ref document: B1 Designated state(s): DE FR GB IT NL SE |
|
| PG25 | Lapsed in a contracting state [announced via postgrant information from national office to epo] |
Ref country code: IT Free format text: LAPSE BECAUSE OF FAILURE TO SUBMIT A TRANSLATION OF THE DESCRIPTION OR TO PAY THE FEE WITHIN THE PRE;WARNING: LAPSES OF ITALIAN PATENTS WITH EFFECTIVE DATE BEFORE 2007 MAY HAVE OCCURRED AT ANY TIME BEFORE 2007. THE CORRECT EFFECTIVE DATE MAY BE DIFFERENT FROM THE ONE RECORDED.SCRIBED TIME-LIMIT Effective date: 19950222 |
|
| REF | Corresponds to: |
Ref document number: 68921267 Country of ref document: DE Date of ref document: 19950330 |
|
| ET | Fr: translation filed | ||
| PG25 | Lapsed in a contracting state [announced via postgrant information from national office to epo] |
Ref country code: SE Effective date: 19950522 |
|
| PLBE | No opposition filed within time limit |
Free format text: ORIGINAL CODE: 0009261 |
|
| STAA | Information on the status of an ep patent application or granted ep patent |
Free format text: STATUS: NO OPPOSITION FILED WITHIN TIME LIMIT |
|
| 26N | No opposition filed | ||
| PGFP | Annual fee paid to national office [announced via postgrant information from national office to epo] |
Ref country code: NL Payment date: 19970625 Year of fee payment: 9 |
|
| PG25 | Lapsed in a contracting state [announced via postgrant information from national office to epo] |
Ref country code: NL Free format text: LAPSE BECAUSE OF NON-PAYMENT OF DUE FEES Effective date: 19990201 |
|
| NLV4 | Nl: lapsed or anulled due to non-payment of the annual fee |
Effective date: 19990201 |
|
| PGFP | Annual fee paid to national office [announced via postgrant information from national office to epo] |
Ref country code: FR Payment date: 20000619 Year of fee payment: 12 |
|
| PGFP | Annual fee paid to national office [announced via postgrant information from national office to epo] |
Ref country code: GB Payment date: 20010621 Year of fee payment: 13 |
|
| REG | Reference to a national code |
Ref country code: GB Ref legal event code: IF02 |
|
| PG25 | Lapsed in a contracting state [announced via postgrant information from national office to epo] |
Ref country code: FR Free format text: LAPSE BECAUSE OF NON-PAYMENT OF DUE FEES Effective date: 20020329 |
|
| REG | Reference to a national code |
Ref country code: FR Ref legal event code: ST |
|
| PG25 | Lapsed in a contracting state [announced via postgrant information from national office to epo] |
Ref country code: GB Free format text: LAPSE BECAUSE OF NON-PAYMENT OF DUE FEES Effective date: 20020704 |
|
| GBPC | Gb: european patent ceased through non-payment of renewal fee |
Effective date: 20020704 |
|
| PGFP | Annual fee paid to national office [announced via postgrant information from national office to epo] |
Ref country code: DE Payment date: 20080829 Year of fee payment: 20 |