EP0269371B1 - Noise reduction in magnetic resonance images - Google Patents
Noise reduction in magnetic resonance images Download PDFInfo
- Publication number
- EP0269371B1 EP0269371B1 EP87310227A EP87310227A EP0269371B1 EP 0269371 B1 EP0269371 B1 EP 0269371B1 EP 87310227 A EP87310227 A EP 87310227A EP 87310227 A EP87310227 A EP 87310227A EP 0269371 B1 EP0269371 B1 EP 0269371B1
- Authority
- EP
- European Patent Office
- Prior art keywords
- intensity values
- pulse
- nominal
- corrected
- application
- Prior art date
- Legal status (The legal status is an assumption and is not a legal conclusion. Google has not performed a legal analysis and makes no representation as to the accuracy of the status listed.)
- Expired - Lifetime
Links
- PQDJLRSJOVLIOK-UHFFFAOYSA-N C1C2=[O]C1CCC2 Chemical compound C1C2=[O]C1CCC2 PQDJLRSJOVLIOK-UHFFFAOYSA-N 0.000 description 1
- 0 C1COC*C1 Chemical compound C1COC*C1 0.000 description 1
Images

Classifications
-
- G—PHYSICS
- G01—MEASURING; TESTING
- G01R—MEASURING ELECTRIC VARIABLES; MEASURING MAGNETIC VARIABLES
- G01R33/00—Arrangements or instruments for measuring magnetic variables
- G01R33/20—Arrangements or instruments for measuring magnetic variables involving magnetic resonance
- G01R33/44—Arrangements or instruments for measuring magnetic variables involving magnetic resonance using nuclear magnetic resonance [NMR]
- G01R33/48—NMR imaging systems
- G01R33/54—Signal processing systems, e.g. using pulse sequences ; Generation or control of pulse sequences; Operator console
- G01R33/56—Image enhancement or correction, e.g. subtraction or averaging techniques, e.g. improvement of signal-to-noise ratio and resolution
-
- G—PHYSICS
- G01—MEASURING; TESTING
- G01R—MEASURING ELECTRIC VARIABLES; MEASURING MAGNETIC VARIABLES
- G01R33/00—Arrangements or instruments for measuring magnetic variables
- G01R33/20—Arrangements or instruments for measuring magnetic variables involving magnetic resonance
- G01R33/44—Arrangements or instruments for measuring magnetic variables involving magnetic resonance using nuclear magnetic resonance [NMR]
- G01R33/48—NMR imaging systems
- G01R33/54—Signal processing systems, e.g. using pulse sequences ; Generation or control of pulse sequences; Operator console
- G01R33/56—Image enhancement or correction, e.g. subtraction or averaging techniques, e.g. improvement of signal-to-noise ratio and resolution
- G01R33/5608—Data processing and visualization specially adapted for MR, e.g. for feature analysis and pattern recognition on the basis of measured MR data, segmentation of measured MR data, edge contour detection on the basis of measured MR data, for enhancing measured MR data in terms of signal-to-noise ratio by means of noise filtering or apodization, for enhancing measured MR data in terms of resolution by means for deblurring, windowing, zero filling, or generation of gray-scaled images, colour-coded images or images displaying vectors instead of pixels
Definitions
- This invention is concerned with magnetic resonance (MR) systems such as magnetic resonance imaging (MRI) or spectroscopy (MRS) systems. More particularly this invention is concerned with improving signal to noise ratio (SNR) in such systems; especially, when using echo procedures for obtaining data.
- MR magnetic resonance
- MRI magnetic resonance imaging
- MRS spectroscopy
- SNR signal to noise ratio
- the usable signals obtained by MR systems are extremely small.
- the signals from the systems are derived when nuclei that are aligned by a Strong static magnetic field are perturbed by a pulse or pulses comprising a magnetic field rotating at a radio frequency (RF).
- RF radio frequency
- the perturbed nuclear magnetization precesses at the resonant frequency and tends to return to the unperturbed orientation.
- the precessing nuclear magnetizatiion transmits a signal, albeit small, that is detected and used for spectroscopy or imaging; for example.
- gradient magnetic fields are also used for locating the source of the signal - that is the location of the precessing and reverting perturbed nuclei in the subject being imaged.
- One of the more popular methods of acquiring data for imaging is through the utilization of echos.
- a scan sequence that is known as the "Spin Echo" sequence.
- the 90 degree RF pulse perturbs the aligned nuclei in the subject by 90 degress to move the nuclei to a plane (such as X-Y) that is perpendicular to the axis (Z) of the strong static magnetic field.
- the 180 degree RF pulse reverses the planar movement of the perturbed nuclei.
- the nuclei when first perturbed to the X-Y plane are substantially all aligned; however, they tend to spread or disburse in the X-Y plane and rotate around the Z axis at different speeds and in different directions, i.e. clockwise and counter clockwise because of such things as the inhomogeneity of the strong static magnetic field.
- nuclei rotate faster than other of the nuclei and hence move further from the originally perturbed position in the X-Y plane.
- the nuclei are moved 180 degrees in the X-Y plane so that all of the nuclei are moving towards realignment, 180 degrees from the original aligned position in the X-Y plane. Since the nuclei that are furthest from the original aligned position in the X-Y plane are the fastest moving nuclei it is apparent that the nuclei will again substantially all realign.
- the realignment occurs at a time equal to the time difference between the application of the 90 degrees pulse and the 180 pulse.
- the realignment causes a relatively strong signal known as an "echo".
- Each subsequent echo signal is slightly smaller than the previous echo signal, and the difference in size is a good estimate of the decay or relaxation time T2.
- the echo signals are very small as are all of the free induction (FID) signals. Thus, any means for improving the SNR is worthwhile.
- the basic reason for synthesizing as described in the article is to obtain the value of T2 and a multiplicity of values of PD after measuring only a few values of Si at different echo times.
- the synthesis is accomplished by fitting a curve to the measured values (more than two) to provide further values of the pseudo-density and the relaxation time T2.
- the reason for the incorrect image is, among other things, that the values of T2 obtained by synthesization fails to take into account the actual slice profile. Accordingly, synthesized images contain errors because among other things of the differences in the actual slice profile and the ideal slice profile.
- Echo signal corrections are performed by the use of gradient magnetic fields before and after the odd refocusing pulses to suppress the artifacts generated by the incorrect RF pulses.
- the article discloses that the use of the function Fn( ⁇ ) for correcting imperfections can be extended so that the results include selective RF pulses.
- the invention provides a method and an arrangement for improving signal-to-noise ratio in MR systems, as defined in Claims 1 and 5 below.
- the method of the present invention preferably further includes measuring the intensity values by acquiring data from at least a single slice, said slice preferably being perpendicular to the Z-axis of the MR system, and being divided into unit areas corresponding to pixels of said images; and
- the received signals Si are the FID signals or echo signals commonly used in magnetic resonance system for either spectroscopy or imaging purposes. In the case of the use of this system for SNR improvement, then particular emphasis is given to the scan sequences that provide echo signals.
- the "i" of the signals Si indicates the number of the echo, from 1,2...n.
- the received signals Si are connected to a divide unit 18 where they are divided by a correction factor CFi provided by unit 19. This system and method can be used in conjunction with more sophisticated scan procedures such as (but not limited to) multi-slice imaging or fast scan imaging within the scope of the invention.
- the output of divider unit 18 are the corrected signals Sci as shown at 21.
- the corrected signals are then operated on by a best fit computer 22 to provide the best fit image data indicated as Pi - where Pi-is the intensity of the signal after the correction and after the application of the best fit procedure.
- the output from unit 22 also includes the values Ai and T2 - where Ai is a composite value made up of such intrinsic parameters as the magnetization, the relaxation time T1 and the transverse relaxation time T2.
- Inputted into the I/O unit 16 through input unit 14 may be such extrinsic values as the repetition rate TR and the echo times TEi. In other words the operator controls the repetition rate and/or the echo times with controls applied at 14.
- Pi Aie -TEi/Td where Td, in a perfectly homogeneous environment is the monoexponential relaxation time T2.
- the best fit computer (22) first obtains the values Ai and T2. From these values with the known echo times (TEi), the value of Pi are computed. The Pi values are used by placing them in the image processor matrix from which the image is constructed.
- the output of the best fit computer 22 is shown at block 23. It provides among other things input to the image processor 24 which provides the image on the display unit 26. In the past, the synthesized images where made relatively noise free but did not give the true image values, and therefore were really not much use to the diagnostician or the physician.
- the original received signals Si indicated at 17 are not accurate because of errors such as those due to the shape of the slice profile. Theoretically; the slice profile should be a rectangle. In actual practice it differs from the rectangle. To correct for this, correction factors from unit 19 are used as divisors with the received signals Si being the dividends.
- Fig 2 shows details of one particular derivation of the correction factors CFi of block 19.
- a multiplying unit 27 is provided with three inputs. They are the gyromagnetic constant for the element being imaged, B(Z)90 ⁇ 180 the effective magnetic field on the nuclei in the X-Y plane of the voxel producing the pixel values during the 90 degree and the 180 degree RF pulses, and ⁇ t.
- the value of ⁇ t is obtained by subtracting time "to", from time "t1" in the first step, and time “t1 from time "t2" in the second step, etc.
- the differences are obtained from subtraction unit 28. In one embodiment time differences of 10 microsecondes are used.
- the output product ⁇ t ⁇ B(Z) from block 27 is multiplied in multiplication unit 29 first by M ⁇ o, the original magnetization vector and subsequently by M ⁇ 1, M ⁇ 2 ... M ⁇ n, the magnetization vectors related to the time differences.
- the product output of unit 29 is ⁇ M which is used as a dividend input to divide unit 32.
- the divisor input ⁇ t ⁇ B(Z) is obtained from multiplication unit 27.
- the output ⁇ M of unit 29 is added in unit 30 to the values Mo, M1.... Mn to provide the values M1, M2, M3, ...Mn which are sequentially used as inputs to units 29 and 30 after the original input Mo has been used.
- the output of the divide unit 32 is cos ⁇ (Z)90 ⁇ 180.
- the value of ⁇ is determined by taking the arc cosine of the cos ⁇ as indicated at block 33.
- the angle 0 is then divided by 2 as shown at block 34 and sin 0/2 is computed at block 36.
- the value of sin ⁇ /2 is multiplied by itself as shown at block 37 to provide sin 0/2. This is done both for the 90 degree pulse and 180 degree pulses.
- the output, that is sin ⁇ /2 is then raised to the "ith" power, where i is the echo number.
- the multiplication for the raising of the sin ( ⁇ /2) to the "ith" power is indicated at block 38.
- the output of block 38 is then multiplied by dZ in multiplication unit 39.
- the multiplication unit 39 has another input for sin 0 as indicated at block 41.
- the output of the block 41 is then coupled to unit 39.
- the output of unit 39 is intergrated as indicated at the block 42.
- the output of the integrator block 42 is connected to divide unit 43 as the divident.
- the divisor is obtained by multiplying sin( ⁇ /2) by sin ⁇ and by the dz value as indicated at block 44 and integrating as indicated at block 46.
- the output of block 43 is the correction factor CFi.
- the correction factor may be used for many purposes but as described herein it is used to improve image synthesization by using corrected measured amplitude signals.
- the improved synthesization procedure provides not only a relatively noise free image but also an image that provides true image intensity values.
- Fig 3 is a graph of the SNR vs echo delay time TE.
- the time T is porportional to the echo number.
- the corrected SNR is significantly improved as compared with the "conventional" SNR.
- the difference between the SNR corrected and uncorrected is dramatic.
- the SNR in the output as with uncorrected values is shown at 51.
- the corrected SNR of the output is shown at 52.
- the invention thus provides a means for correcting for errors such as those caused by the differences between the ideal slice profile and the actual slice profile.
- the difference effects the apparent relaxation time T2 in particular.
- the differences in the profile are caused by the inhomogeneities in the field, the complicated algorithms, and the acutal input RF signal discrepancies as compared to the ideal input RF signal. In fact presently there is no known method of obtaining a square output profile. In fact many scientists believe a square output profile will never be achieved.
- the received signal corrected using the correction factor is for use with image synthesization processes, whereby a received image is processed and synthesized so that not only is an image with an improved SNR provided but in addition the resulting image is free from bias or errors due to the slicing process.
Landscapes
- Physics & Mathematics (AREA)
- Health & Medical Sciences (AREA)
- General Health & Medical Sciences (AREA)
- Nuclear Medicine, Radiotherapy & Molecular Imaging (AREA)
- Radiology & Medical Imaging (AREA)
- Engineering & Computer Science (AREA)
- Signal Processing (AREA)
- High Energy & Nuclear Physics (AREA)
- Condensed Matter Physics & Semiconductors (AREA)
- General Physics & Mathematics (AREA)
- Magnetic Resonance Imaging Apparatus (AREA)
Description
- This invention is concerned with magnetic resonance (MR) systems such as magnetic resonance imaging (MRI) or spectroscopy (MRS) systems. More particularly this invention is concerned with improving signal to noise ratio (SNR) in such systems; especially, when using echo procedures for obtaining data.
- The usable signals obtained by MR systems are extremely small. The signals from the systems are derived when nuclei that are aligned by a Strong static magnetic field are perturbed by a pulse or pulses comprising a magnetic field rotating at a radio frequency (RF). After the termination of the RF pulse or pulses the perturbed nuclear magnetization precesses at the resonant frequency and tends to return to the unperturbed orientation. During the reverting process, the precessing nuclear magnetizatiion transmits a signal, albeit small, that is detected and used for spectroscopy or imaging; for example. For imaging purposes gradient magnetic fields are also used for locating the source of the signal - that is the location of the precessing and reverting perturbed nuclei in the subject being imaged.
- The inherent low amplitude of the signal increases the importance of improving the SNR. Accordingly, scientists in the field are continuously searching for ways and means of improving the SNR of the received signals.
- One of the more popular methods of acquiring data for imaging is through the utilization of echos. For example, there is a scan sequence that is known as the "Spin Echo" sequence. In that scan sequence, first a 90 degree RF pulse is applied to the subject simultaneously with the application of a selection gradient pulse. The 90 degree RF pulse perturbs the aligned nuclei in the subject by 90 degress to move the nuclei to a plane (such as X-Y) that is perpendicular to the axis (Z) of the strong static magnetic field. (X, Y, Z are the so called "rotating" Cartesian Coordinates normally used to define MR systems.) After a certain defined time period a second RF pulse is applied, designed to further perturb the already
perturbed nuclei 180 degrees in the same plane (X-Y). - The 180 degree RF pulse reverses the planar movement of the perturbed nuclei. The nuclei when first perturbed to the X-Y plane are substantially all aligned; however, they tend to spread or disburse in the X-Y plane and rotate around the Z axis at different speeds and in different directions, i.e. clockwise and counter clockwise because of such things as the inhomogeneity of the strong static magnetic field.
- At any rate, certain nuclei rotate faster than other of the nuclei and hence move further from the originally perturbed position in the X-Y plane. When the 180 degree RF pulse is applied, the nuclei are moved 180 degrees in the X-Y plane so that all of the nuclei are moving towards realignment, 180 degrees from the original aligned position in the X-Y plane. Since the nuclei that are furthest from the original aligned position in the X-Y plane are the fastest moving nuclei it is apparent that the nuclei will again substantially all realign. As a matter of fact the realignment occurs at a time equal to the time difference between the application of the 90 degrees pulse and the 180 pulse. The realignment causes a relatively strong signal known as an "echo".
- Multiple echoes are obtained by applying multiple 180 degree pulses. Each subsequent echo signal is slightly smaller than the previous echo signal, and the difference in size is a good estimate of the decay or relaxation time T2.
- There are other ways of generating the echo signals which are well known to those skilled in the art. The echo signals are used to provide images of a subject. Magnetic gradients as mentioned before are used to locate the source of the echo signals based upon the Larmor equation, which is:

- f is the frequency of the received signal;
- γ is the gyro magnetic constant based on the nuclear isotope from which the echo is received;
- Bo is the magnetic intensity of the field at the point from which the echo is received; and
- π is the constant 3.1416.
- The echo signals are very small as are all of the free induction (FID) signals. Thus, any means for improving the SNR is worthwhile.
- Synthesization has been suggested as a means of improving the SNR. For example, an article entitled "An Analysis of Noise Propogation in Computed T2, Pseudodensity and Synthetic Spin-echo Images" by James R. MacFall et al published in the Medical Physics Journal,
Volume 13, at PP 285-292 in May/June 1986 alludes to the fact that under many circumstances a signal synthesized at some echo time can have an SNR superior to that of a directly acquired signal. As described in the article, the synthesis of spin-echo signals assumes a model wherein;
- Si
- is a set of spin echo signals;
- i
- is a number from 1 to N;
- PD
- is the pseudo-density incorporating the nuclear density and all T1 (longitudinal or spin-lattice relaxation time) related items;
- TEi
- is the set of echo times used in obtaining the set Si; and
- T2
- is the transverse relaxation time.
- The basic reason for synthesizing as described in the article is to obtain the value of T2 and a multiplicity of values of PD after measuring only a few values of Si at different echo times. The synthesis is accomplished by fitting a curve to the measured values (more than two) to provide further values of the pseudo-density and the relaxation time T2. Thus through synthesization, selected points in a matrix are obtained by actual measurements. More measurements are taken than there are unknowns. Therefore, methods such as least square fitting can be used for extrapolating and interpolating the measured points to obtain virtual images at TE values for which no actual measurements were taken.
- It is noted in the previously mentioned article that image synthesization might in certain cases, improve the SNR of said virtual images. However, synthesization does not provide a really accurate T2 time. Accordingly although the image synthesization process provides a relatively noise free image, it does not provide a truly correct image.
- The reason for the incorrect image is, among other things, that the values of T2 obtained by synthesization fails to take into account the actual slice profile. Accordingly, synthesized images contain errors because among other things of the differences in the actual slice profile and the ideal slice profile.
- In an article published in Magnetic Resonance in Medicine, Vol. 3, pp. 397-417 (1986) entitled "Errors in the Measurements of T2 Using Multiple-Echo MRI Techniques" by S.M. Majumdar et al, the authors examine the effects of imperfections in the 180° RF pulses and what occurs when they do not completely invert transverse magnetization so that the magnitude of the transverse component is reduced and the longitudinal component is generated. The article identifies an equation relating the magnetism of the spin echo to the original echo times as a decaying function times a function Fm(Θ) where the Fm(Θ) is the required modification of the echo signal caused by using pulses of an inappropriate amplitude and/or duration. Echo signal corrections are performed by the use of gradient magnetic fields before and after the odd refocusing pulses to suppress the artifacts generated by the incorrect RF pulses. The article discloses that the use of the function Fn(Θ) for correcting imperfections can be extended so that the results include selective RF pulses.
- In an article entitled "Multiple Spin Echo Imaging with a 2-D Fourier Method" by R. Graumann et al published in the Journal of Magnetic Resonance in Medicine, Vol. 3, 1986, pp. 707-721 the authors report on a suggested sequence modifying the Carr-Purcell multiple echo sequence to overcome centreline and mirror artifacts caused by imperfect rotations by RF pulses in the Carr-Purcell sequence. The sequence uses alternating phase shifts that enable multiple slice and multiple echo imaging at the same time and reduces the artifacts. The article essentially shows a modified Carr-Purcell multiple echo sequence. It discloses the features of the pre-characterizing portions of Claims 1 and 5.
- Accordingly, it is an object of the present invention to make corrections, in general, on the T2 values obtained using MR echo procedures.
- It is a further object of the present invention to utilize the method of correcting the T2 time along with image synthesization in order to obtain images with improved SNR and having true T2 values, and then for example to enable replacement of the originally acquired set of images with a new set of images having improved fidelity; i.e., closer to an ideal set.
- The invention provides a method and an arrangement for improving signal-to-noise ratio in MR systems, as defined in Claims 1 and 5 below.
- The method of the present invention preferably further includes measuring the intensity values by acquiring data from at least a single slice, said slice preferably being perpendicular to the Z-axis of the MR system, and being divided into unit areas corresponding to pixels of said images; and
- forming a set of pixel intensities Ii for each pixel position in the image; where Ii is the echo number equal to 1,2,....m.
- The method includes correcting the pixel intensities and obtaining a corrected pixel intensity set: Pi = Ii/CFi
where: i = 1,2,....n (in a preferred embodiment n=8). - The correction factor per pixel at the ith echo is given by:

- where:
- θ(Z) is the angle through which the nuclei are perturbed by the 90 degree or the 180 degree R.F. pulses, and

- where:
- Mz (Z) is the Z component of the magnetization


- where:
- the initial conditions (t=0) are


- The above named and other objects and features of the present invention will be better understood by reference to the following detailed description of an embodiment of the invention by way of example only, when considered in connection with the accompanying drawings, wherein:
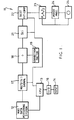
- Fig. 1 is a block diagram showing an MRI system embodying the invention,
- Fig. 2 is a block diagram showing details of
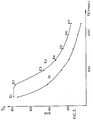
block 19 of Fig. 1, and - Fig. 3 is a graphical showing of the improvement in SNR achieved using the inventive method.
- Fig. 1 at 11 shows an MRI data acquisition and processing system particularly useful for obtaining the true images with improved SNR.
Block 12 represents an MRI data acquistion system. Such data is acquired in a preferred embodiment using a superconducting magnet to provide a large relatively homogeneous magnetic field with associated gradient coils and RF transmitting and receiving coils. The system is under the control of a central processing unit (CPU) 13 which enables among other things input by a user as indicated atinput 14.Input 14 is attached toCPU 13 through an interfacing unit (I/O) 16. The CPU is connected to and controls the system. - The received signals Si , indicated at 17, are the FID signals or echo signals commonly used in magnetic resonance system for either spectroscopy or imaging purposes. In the case of the use of this system for SNR improvement, then particular emphasis is given to the scan sequences that provide echo signals. The "i" of the signals Si indicates the number of the echo, from 1,2...n.The received signals Si are connected to a
divide unit 18 where they are divided by a correction factor CFi provided byunit 19. This system and method can be used in conjunction with more sophisticated scan procedures such as (but not limited to) multi-slice imaging or fast scan imaging within the scope of the invention. - The output of
divider unit 18 are the corrected signals Sci as shown at 21. The corrected signals are then operated on by a bestfit computer 22 to provide the best fit image data indicated as Pi - where Pi-is the intensity of the signal after the correction and after the application of the best fit procedure. - The output from
unit 22 also includes the values Ai and T2 - where Ai is a composite value made up of such intrinsic parameters as the magnetization, the relaxation time T1 and the transverse relaxation time T2. - Inputted into the I/
O unit 16 throughinput unit 14 may be such extrinsic values as the repetition rate TR and the echo times TEi. In other words the operator controls the repetition rate and/or the echo times with controls applied at 14. In actual practice Pi = Aie-TEi/Td where Td, in a perfectly homogeneous environment is the monoexponential relaxation time T2. - The best fit computer (22) first obtains the values Ai and T2. From these values with the known echo times (TEi), the value of Pi are computed. The Pi values are used by placing them in the image processor matrix from which the image is constructed.
- The output of the best
fit computer 22 is shown atblock 23. It provides among other things input to theimage processor 24 which provides the image on thedisplay unit 26. In the past, the synthesized images where made relatively noise free but did not give the true image values, and therefore were really not much use to the diagnostician or the physician. - As is well known, the original received signals Si indicated at 17 are not accurate because of errors such as those due to the shape of the slice profile. Theoretically; the slice profile should be a rectangle. In actual practice it differs from the rectangle. To correct for this, correction factors from
unit 19 are used as divisors with the received signals Si being the dividends. - There are several ways to obtain the necessary correction factors, and once these are obtained and made available as output in
unit 19, the computation proceeds as described above. - Fig 2 shows details of one particular derivation of the correction factors CFi of
block 19. - Therein a multiplying
unit 27 is provided with three inputs. They are the gyromagnetic constant for the element being imaged, B(Z)⁹⁰ʼ¹⁸⁰ the effective magnetic field on the nuclei in the X-Y plane of the voxel producing the pixel values during the 90 degree and the 180 degree RF pulses, and Δt. The value of Δt is obtained by subtracting time "to", from time "t1" in the first step, and time "t1 from time "t2" in the second step, etc. The differences are obtained from subtraction unit 28. In one embodiment time differences of 10 microsecondes are used. - The output product γ·Δt·B(Z) from
block 27 is multiplied in multiplication unit 29 first by


unit 32. The divisor input γ·Δt·B(Z) is obtained frommultiplication unit 27. - The output ΔM of unit 29 is added in
unit 30 to the values Mo, M1.... Mn to provide the values M1, M2, M3, ...Mn which are sequentially used as inputs tounits 29 and 30 after the original input Mo has been used. - The output of the
divide unit 32 is cos θ(Z)⁹⁰ʼ¹⁸⁰. The value of θ is determined by taking the arc cosine of the cos θ as indicated atblock 33. Theangle 0 is then divided by 2 as shown atblock 34 andsin 0/2 is computed atblock 36. The value of sin θ/2 is multiplied by itself as shown atblock 37 to providesin 0/2. This is done both for the 90 degree pulse and 180 degree pulses. The output, that is sinθ/2 is then raised to the "ith" power, where i is the echo number. The multiplication for the raising of the sin (θ/2) to the "ith" power is indicated atblock 38. - The output of
block 38 is then multiplied by dZ inmultiplication unit 39. Themultiplication unit 39 has another input forsin 0 as indicated atblock 41. The output of theblock 41 is then coupled tounit 39. The output ofunit 39 is intergrated as indicated at theblock 42. The output of theintegrator block 42 is connected to divideunit 43 as the divident. - The divisor is obtained by multiplying sin(θ/2) by sin θ and by the dz value as indicated at
block 44 and integrating as indicated atblock 46. The output ofblock 43 is the correction factor CFi. - The correction factor may be used for many purposes but as described herein it is used to improve image synthesization by using corrected measured amplitude signals. The improved synthesization procedure provides not only a relatively noise free image but also an image that provides true image intensity values.
- It should be understood that while hardware has been described herein for providing and using the correction factors CFi, software or combinations of hardware and software could be used for such purposes. In a preferred embodiment software is used. There are other methods of finding correction factors.
- The improvement in the signal to noise ratio is shown in the graph of Fig 3 which is a graph of the SNR vs echo delay time TE. The time T is porportional to the echo number. As shown in Fig. 3, even at the first echo, the corrected SNR is significantly improved as compared with the "conventional" SNR. Subsequently, the difference between the SNR corrected and uncorrected is dramatic. The SNR in the output as with uncorrected values is shown at 51. The corrected SNR of the output is shown at 52.
- The invention thus provides a means for correcting for errors such as those caused by the differences between the ideal slice profile and the actual slice profile. The difference effects the apparent relaxation time T2 in particular. The differences in the profile are caused by the inhomogeneities in the field, the complicated algorithms, and the acutal input RF signal discrepancies as compared to the ideal input RF signal. In fact presently there is no known method of obtaining a square output profile. In fact many scientists believe a square output profile will never be achieved.
- In the particular use emphasized herein, the received signal corrected using the correction factor is for use with image synthesization processes, whereby a received image is processed and synthesized so that not only is an image with an improved SNR provided but in addition the resulting image is free from bias or errors due to the slicing process.
- While the invention has been described in relation to particular embodiments it should be understood that the described embodiments are made by way of example only and not as limitations of the scope of the invention, which is defined in the following claims:
Claims (10)
- A method of improving signal-to-noise ratio in magnetic resonance (MR) systems, said method comprising the steps of:measuring intensity values [12. 17] of at least three sequential echoes, using the measured intensity values to synthesize a set of intensity values per pixel with improved SNR characteristics and using those synthetic intensity values to obtain images.acquiring data from at least a single slice, said slice being perpendicular to the Z-axis of the MR system and being divided into unit areas corresponding to pixels of said images;forming a set of intensity values Ii, for each pixel position of said unit areas in the image where i is the echo number equal to 1, 2...n;said method characterized in that the measuring step includes:correcting the measured intensity values by operating on each of the measured intensity values with a correcting factor to obtain corrected measured intensity values, said correcting factors correcting for differences between an actual slice profile and an ideal slice profile, andusing said corrected measured intensity values by fitting a characteristic curve based on a desired model to the corrected measured intensity values to obtain a set Pi=Ii/CFi of corrected intensity values having improved SNR characteristics, those corrected intensity values being the synthetic values used to obtain images, where:where:
 CFi is the correction factor;θ(Z) is the angle through which the nuclei are perturbed by the nominal 90° or the nominal 180° RF pulses, andcos θ(Z)⁹⁰ʼ¹⁸⁰ =Mz(Z)⁹⁰ʼ¹⁸⁰ :Mz(Z)⁹⁰ʼ¹⁸⁰ is the Z component of the 90,180 magnetization M(Z)⁹⁰ʼ¹⁸⁰ which is obtained by solving numerically for

the initial conditions at (t=0) are


- The method according to Claim 1, wherein said desired model is the curve characterized by the equation:
 Si is a set of spin echo signals;i is a number from 1 to N;PD is the pseudo-density incorporating the nuclear density and all T1 (longitudinal or spin lattice relaxation time) related items;TEi is the set of echo times used in obtaining the set Si of spin echo signals; andT2 is the transverse relaxation time.
 - The method according to Claim 1 of improving signal-to-noise ratio in magnetic resonance (MR) systems, said method comprising the steps of:subjecting a subject to a large static magnetic field;applying a nominal 90° radio frequency (RF) pulse rotating at the Larmor frequency;applying a selecting gradient pulse during the application of the nominal 90° RF pulse;applying a phase encoding pulse after the application of the nominal 90° RF pulse;applying a nominal 180° RF pulse during the application of another selecting gradient pulse;applying a read gradient pulse;receiving a first echo signal during the application of the read gradient pulse and at a time τ2 after the application of the nominal 180° RF pulse equal to the time τ1 between the application of the nominal 90° RF pulse and the nominal 180° RF pulse;applying another nominal 180° RF pulse during the application of another selecting gradient pulse,receiving a second echo signal during the application of another read gradient pulse;applying still another nominal 180° RF pulse during the application of still another gradient selecting pulse;receiving a third echo signal during the application of yet another read gradient;those echo signals being those whose intensity values are measured and corrected; andbest fitting a characteristic curve to the corrected intensity values Pi to obtain a set of corrected intensity values taken from desired places along the best fitted characteristic curve.
- The method of Claim 2 wherein the set of corrected intensity values is used for obtaining corrected values of T2.
- An arrangement [11] for improving signal-to-noise ratio in magnetic resonance (MR) systems, said arrangement comprising:means arranged to measure intensity values of at least three sequential echoes [12, 17];means [18, 19, 21, 22 and 23] arranged to synthesize from the measured intensity values a set of corrected intensity values per pixel having improved SNR characteristics,means [24] arranged to use the set of corrected intensity values to obtain images;means [12] arranged to acquire data from at least a single slice, said slice preferably being perpendicular to the Z-axis of the MR system and being divided into unit areas corresponding to pixels of said images:means [23] arranged to form a set of intensity values Ii with an intensity value for each unit area position, where i is the echo number equal to 1, 2...n:the arrangement characterized by:correcting means [18] arranged to operate on each of the measured intensity values [17] with correcting factors [19] to obtain corrected measured intensity values [21], said correcting factors correcting for differences between an actual slice profile and an ideal slice profile, and bymeans [22] arranged to use said corrected measured intensity values by fitting a characteristic curve based on a desired model to the corrected measure intensity values to obtain the set [23] Pi=Ii/CFi of corrected intensity values having improved SNR characteristics, those corrected intensity values being synthetic values used to obtain images;wherein:
 CFi is the correction factor;θ(Z) is the angle through which the nuclei are perturbed by the nominal 90° or the nominal 180° RF pulses, andcos θ(Z)⁹⁰ʼ¹⁸⁰ =Mz(Z)⁹⁰ʼ¹⁸⁰;Mz(Z)⁹⁰ʼ¹⁸⁰ is the Z component of the magnetizationwhere: the initial conditions (t=0) are


with
- The arrangement of Claim 5 wherein said desired model is the curve characterized by the equation:
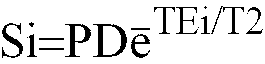 Si is a set of spin echo signals;i is a number from 1 to N;PD is the pseudo-density incorporating the nuclear density and all Tl (longitudinal or spin-lattice relaxation time) related items;TEi is the set of echo times used in obtaining the set Si of spin echo signals; andT2 is the transverse relaxation.
 - The arrangement of Claim 5 for improving the signal-to-noise ratio in magnetic resonance (MR) systems, said means [12] arranged to measure intensity values of at least three sequential echoes comprising:means arranged to expose a subject to a large static magnetic field;means arranged to apply a nominal 90° radio frequency (RF) pulse rotating at the Larmor frequency to the subject;means arranged to apply a slice selecting gradient pulse during the application of the nominal 90° RF pulse;means arranged to apply a nominal 180° pulse during the application of another slice selecting pulse;means arranged to apply a read gradient pulse to the subject;means arranged to receive a first echo signal during the application of the read gradient pulse;means arranged to apply another nominal 180° RF pulse during the application of another slice selecting gradient pulse;means arranged to receive a second echo signal during the application of another read gradient pulse;means arranged to apply still another nominal 180° RF pulse during the application of still another gradient selecting pulse;means arranged to receive a third echo signal during the application of the still another read gradient pulse;wherein said means arranged to use a set of corrected intensity values derived from the measured intensity values is characterized by:means arranged to apply a phase encoding pulse after the application of the nominal 90° RF pulse;the means arranged to receive the first echo signal being arranged to receive it at time τ2 after the application of the nominal 180° pulse equal to the time τ1 between the application of the nominal 90° RF pulse and the nominal 180° RF pulse;means [18] arranged to divide each of the measured intensity values by a correcting factor correcting for the errors caused by differences between an actual slice profile and an ideal slice profile to obtain corrected intensity values, andmeans [22] arranged to best fit a characteristic curve to the corrected intensity values to obtain a set [23] of corrected intensity values taken from desired places along the best fitted characteristic curve.
- The arrangement of Claim 7 wherein means [24] are arranged to use the set of corrected intensity values for obtaining corrected values of T2.
- The arrangement of Claim 7 wherein means [24] are arranged to use the set of corrected intensity values for obtaining a corrected image.
- The arrangement of Claim 9 wherein said means arranged to obtain said correction factor includes:means [27] arranged to multiply γ, the gyromagnetic constant based on the nuclei from which the echoes are received by B(Z), the effective magnetic field acting on the nuclei at the Z plane of a voxel containing the said pixels during the application of the nominal 90° and 180° RF pulses to obtain a first product (γ.B(Z)),means [27] arranged to multiply the first product by Δt where Δt initially is (t1-t0) and subsequently is sequentially (t₂-t₁), (t₃-t₂)...(tn-tn-1) to obtain a second product (ΔB(z).Δt),means [29] arranged to obtain the vector cross product of the second product and the initial vector component of magnetization Mo and subsequently sequential vector components M1, M2...Mn;means [32] arranged to divide the vector cross product by the second product to obtain cos θ(Z);means [33] arranged to determine the value of θ obtained responsive to nominal 90° pulse and nominal 180° pulses from the cos θ:means [34] arranged to divide θ by 2;means [36] arranged to take the sin of θ/2;means [37] arranged to square the sin θ/2;means [38] arranged to raise the squared value to the power i;means [39] arranged to multiply the squared value raised to power i by sin θ and by d(Z) to obtain a third product;means [42] arranged to integrate the third product from +∞ to -∞ to obtain a first integral; andmeans [43] arranged to divide the first integral by the integral of the product of sin (θ/2)¹⁸⁰ and sin θ d(Z)⁹⁰ to obtain the correction factor.
Applications Claiming Priority (2)
| Application Number | Priority Date | Filing Date | Title |
|---|---|---|---|
| IL80727 | 1986-11-21 | ||
| IL80727A IL80727A (en) | 1986-11-21 | 1986-11-21 | Noise reduction in magnetic resonance images |
Publications (3)
| Publication Number | Publication Date |
|---|---|
| EP0269371A2 EP0269371A2 (en) | 1988-06-01 |
| EP0269371A3 EP0269371A3 (en) | 1989-08-09 |
| EP0269371B1 true EP0269371B1 (en) | 1996-04-10 |
Family
ID=11057313
Family Applications (1)
| Application Number | Title | Priority Date | Filing Date |
|---|---|---|---|
| EP87310227A Expired - Lifetime EP0269371B1 (en) | 1986-11-21 | 1987-11-19 | Noise reduction in magnetic resonance images |
Country Status (5)
| Country | Link |
|---|---|
| US (1) | US4825161A (en) |
| EP (1) | EP0269371B1 (en) |
| JP (1) | JP2703545B2 (en) |
| DE (1) | DE3751771T2 (en) |
| IL (1) | IL80727A (en) |
Families Citing this family (6)
| Publication number | Priority date | Publication date | Assignee | Title |
|---|---|---|---|---|
| NL8801731A (en) * | 1988-07-08 | 1990-02-01 | Philips Nv | METHOD AND NUCLEAR SPIN RESONANCE DEVICE FOR QUICK DETERMINATION OF THE CROSS RELAXATION TIME CONSTANT T2. |
| DE4024164A1 (en) * | 1989-08-11 | 1991-02-14 | Siemens Ag | METHOD FOR IMPROVING THE SIGNAL-NOISE RATIO IN A CORE SPIN TOMOGRAPHY DEVICE |
| US5185573A (en) * | 1991-04-16 | 1993-02-09 | Hewlett-Packard Company | Method for focusing of magnetic resonance images |
| US5517122A (en) * | 1993-11-04 | 1996-05-14 | The Regents Of University Of California | T2 restoration and noise suppression of hybrid MR images using Wiener and linear prediction techniques |
| JP3510542B2 (en) * | 1999-10-22 | 2004-03-29 | ジーイー・メディカル・システムズ・グローバル・テクノロジー・カンパニー・エルエルシー | Phase distribution measuring method and apparatus, phase correcting method and apparatus, and magnetic resonance imaging apparatus |
| US20080068014A1 (en) * | 2005-02-11 | 2008-03-20 | Koninklijke Philips Electronics N.V. | Magnetic Resonance Imaging With Adjustment for Magnetic Resonance Decay |
Family Cites Families (6)
| Publication number | Priority date | Publication date | Assignee | Title |
|---|---|---|---|---|
| GB1584949A (en) * | 1978-05-25 | 1981-02-18 | Emi Ltd | Imaging systems |
| US4579121A (en) * | 1983-02-18 | 1986-04-01 | Albert Macovski | High speed NMR imaging system |
| US4532474A (en) * | 1983-09-09 | 1985-07-30 | General Electric Company | Nuclear magnetic resonance imaging using pulse sequences combining selective excitation and driven free precession |
| US4591789A (en) * | 1983-12-23 | 1986-05-27 | General Electric Company | Method for correcting image distortion due to gradient nonuniformity |
| JPS61168342A (en) * | 1985-01-21 | 1986-07-30 | 横河電機株式会社 | Prevention of artifact of nmr tomographic apparatus |
| US4651096A (en) * | 1985-02-19 | 1987-03-17 | Resonex | Imaging method for nuclear magnetic resonance utilizing balanced gradient fields |
-
1986
- 1986-11-21 IL IL80727A patent/IL80727A/en unknown
-
1987
- 1987-11-12 US US07/119,483 patent/US4825161A/en not_active Expired - Lifetime
- 1987-11-19 EP EP87310227A patent/EP0269371B1/en not_active Expired - Lifetime
- 1987-11-19 DE DE3751771T patent/DE3751771T2/en not_active Expired - Fee Related
- 1987-11-21 JP JP62294997A patent/JP2703545B2/en not_active Expired - Lifetime
Also Published As
| Publication number | Publication date |
|---|---|
| DE3751771D1 (en) | 1996-05-15 |
| IL80727A0 (en) | 1987-02-27 |
| DE3751771T2 (en) | 1996-10-31 |
| EP0269371A3 (en) | 1989-08-09 |
| JP2703545B2 (en) | 1998-01-26 |
| US4825161A (en) | 1989-04-25 |
| JPS63220856A (en) | 1988-09-14 |
| IL80727A (en) | 1990-06-10 |
| EP0269371A2 (en) | 1988-06-01 |
Similar Documents
| Publication | Publication Date | Title |
|---|---|---|
| US4665365A (en) | Method for reversing residual transverse magnetization due to phase-encoding magnetic field gradients | |
| US6263228B1 (en) | Method and apparatus for providing separate water-dominant and fat-dominant images from single scan single point dixon MRI sequences | |
| US5758646A (en) | Magnetic resonance imaging method with pulse sequence optimization and device for such method | |
| US4709212A (en) | Method of enhancing image signal-to-noise ratio by combining NMR images of differing pulse sequence timing | |
| US6459922B1 (en) | Post data-acquisition method for generating water/fat separated MR images having adjustable relaxation contrast | |
| EP0445151B1 (en) | Reducing motion artifacts in nmr images | |
| US4318043A (en) | Method and apparatus for rapid NMR imaging of nuclear densities within an object | |
| US4297637A (en) | Method and apparatus for mapping lines of nuclear density within an object using nuclear magnetic resonance | |
| US4549140A (en) | Method utilizing combined, interleaved pulse sequences for reducing motion artifacts in computed T1,T2 and M0 NMR imaging | |
| US7235971B2 (en) | Shimming of MRI scanner involving fat suppression and/or black blood preparation | |
| US6559642B2 (en) | Calibration method for use with sensitivity encoding MRI acquisition | |
| US4689567A (en) | NMR Fourier imaging from multiple echoes | |
| US4549139A (en) | Method of accurate and rapid NMR imaging of computed T1 and spin density | |
| Talagala et al. | Introduction to magnetic resonance imaging | |
| EP0152879A2 (en) | Composite pulses for time reversal in NMR imaging | |
| EP0347990B1 (en) | Method of and device for the volume-selective determination of an MR spectrum by means of selective polarization transfer pulse sequence | |
| US4649346A (en) | Complex quotient nuclear magnetic resonance imaging | |
| US4604579A (en) | Method and apparatus for enhanced T1 NMR measurements using repetition intervals TR related to one another by integer multiples | |
| US7197353B2 (en) | Sensitivity encoding MRI acquisition method | |
| US4891595A (en) | Restricted volume imaging | |
| US5101156A (en) | Rapid flow measurement using an nmr imaging system | |
| US4954779A (en) | Correction for eddy current caused phase degradation | |
| US4706027A (en) | Method for correcting phase errors in magnetic resonance imaging data | |
| US4855679A (en) | Magnetic resonance studies of restricted volumes | |
| US4825161A (en) | Noise reduction in magnetic resonance images |
Legal Events
| Date | Code | Title | Description |
|---|---|---|---|
| PUAI | Public reference made under article 153(3) epc to a published international application that has entered the european phase |
Free format text: ORIGINAL CODE: 0009012 |
|
| AK | Designated contracting states |
Kind code of ref document: A2 Designated state(s): DE FR GB NL |
|
| PUAL | Search report despatched |
Free format text: ORIGINAL CODE: 0009013 |
|
| AK | Designated contracting states |
Kind code of ref document: A3 Designated state(s): DE FR GB NL |
|
| 17P | Request for examination filed |
Effective date: 19900104 |
|
| 17Q | First examination report despatched |
Effective date: 19920224 |
|
| GRAH | Despatch of communication of intention to grant a patent |
Free format text: ORIGINAL CODE: EPIDOS IGRA |
|
| GRAA | (expected) grant |
Free format text: ORIGINAL CODE: 0009210 |
|
| AK | Designated contracting states |
Kind code of ref document: B1 Designated state(s): DE FR GB NL |
|
| PG25 | Lapsed in a contracting state [announced via postgrant information from national office to epo] |
Ref country code: FR Effective date: 19960410 |
|
| REF | Corresponds to: |
Ref document number: 3751771 Country of ref document: DE Date of ref document: 19960515 |
|
| EN | Fr: translation not filed | ||
| PGFP | Annual fee paid to national office [announced via postgrant information from national office to epo] |
Ref country code: GB Payment date: 19961111 Year of fee payment: 10 |
|
| PLBE | No opposition filed within time limit |
Free format text: ORIGINAL CODE: 0009261 |
|
| STAA | Information on the status of an ep patent application or granted ep patent |
Free format text: STATUS: NO OPPOSITION FILED WITHIN TIME LIMIT |
|
| 26N | No opposition filed | ||
| PG25 | Lapsed in a contracting state [announced via postgrant information from national office to epo] |
Ref country code: GB Free format text: LAPSE BECAUSE OF NON-PAYMENT OF DUE FEES Effective date: 19971119 |
|
| GBPC | Gb: european patent ceased through non-payment of renewal fee |
Effective date: 19971119 |
|
| PGFP | Annual fee paid to national office [announced via postgrant information from national office to epo] |
Ref country code: NL Payment date: 19981126 Year of fee payment: 12 |
|
| PGFP | Annual fee paid to national office [announced via postgrant information from national office to epo] |
Ref country code: DE Payment date: 19981130 Year of fee payment: 12 |
|
| PG25 | Lapsed in a contracting state [announced via postgrant information from national office to epo] |
Ref country code: NL Free format text: LAPSE BECAUSE OF NON-PAYMENT OF DUE FEES Effective date: 20000601 |
|
| NLV4 | Nl: lapsed or anulled due to non-payment of the annual fee |
Effective date: 20000601 |
|
| PG25 | Lapsed in a contracting state [announced via postgrant information from national office to epo] |
Ref country code: DE Free format text: LAPSE BECAUSE OF NON-PAYMENT OF DUE FEES Effective date: 20000901 |