EP0165816B1 - Gas analysis apparatus and method - Google Patents
Gas analysis apparatus and method Download PDFInfo
- Publication number
- EP0165816B1 EP0165816B1 EP85304410A EP85304410A EP0165816B1 EP 0165816 B1 EP0165816 B1 EP 0165816B1 EP 85304410 A EP85304410 A EP 85304410A EP 85304410 A EP85304410 A EP 85304410A EP 0165816 B1 EP0165816 B1 EP 0165816B1
- Authority
- EP
- European Patent Office
- Prior art keywords
- interference pattern
- gas
- pattern
- values
- gas analyser
- Prior art date
- Legal status (The legal status is an assumption and is not a legal conclusion. Google has not performed a legal analysis and makes no representation as to the accuracy of the status listed.)
- Expired
Links
- 238000000034 method Methods 0.000 title claims description 16
- 238000004868 gas analysis Methods 0.000 title description 3
- 239000007789 gas Substances 0.000 claims description 48
- 239000000203 mixture Substances 0.000 claims description 18
- 238000006073 displacement reaction Methods 0.000 claims description 9
- 239000000470 constituent Substances 0.000 claims description 8
- 238000012545 processing Methods 0.000 claims description 7
- 238000004458 analytical method Methods 0.000 claims description 4
- GQPLMRYTRLFLPF-UHFFFAOYSA-N Nitrous Oxide Chemical compound [O-][N+]#N GQPLMRYTRLFLPF-UHFFFAOYSA-N 0.000 description 22
- QVGXLLKOCUKJST-UHFFFAOYSA-N atomic oxygen Chemical compound [O] QVGXLLKOCUKJST-UHFFFAOYSA-N 0.000 description 14
- 229910052760 oxygen Inorganic materials 0.000 description 14
- 239000001301 oxygen Substances 0.000 description 14
- 239000001272 nitrous oxide Substances 0.000 description 11
- 230000003444 anaesthetic effect Effects 0.000 description 8
- 230000006870 function Effects 0.000 description 7
- 230000003287 optical effect Effects 0.000 description 6
- 206010002091 Anaesthesia Diseases 0.000 description 4
- 238000001949 anaesthesia Methods 0.000 description 4
- 230000037005 anaesthesia Effects 0.000 description 4
- 238000005259 measurement Methods 0.000 description 4
- 238000012360 testing method Methods 0.000 description 3
- 238000010586 diagram Methods 0.000 description 2
- 230000000694 effects Effects 0.000 description 2
- 238000004817 gas chromatography Methods 0.000 description 2
- 238000004949 mass spectrometry Methods 0.000 description 2
- 230000008569 process Effects 0.000 description 2
- 230000000241 respiratory effect Effects 0.000 description 2
- MYMOFIZGZYHOMD-UHFFFAOYSA-N Dioxygen Chemical compound O=O MYMOFIZGZYHOMD-UHFFFAOYSA-N 0.000 description 1
- 238000004566 IR spectroscopy Methods 0.000 description 1
- 238000010521 absorption reaction Methods 0.000 description 1
- 230000009471 action Effects 0.000 description 1
- 239000000654 additive Substances 0.000 description 1
- 230000000996 additive effect Effects 0.000 description 1
- 238000013459 approach Methods 0.000 description 1
- 230000008901 benefit Effects 0.000 description 1
- 230000008859 change Effects 0.000 description 1
- 238000006243 chemical reaction Methods 0.000 description 1
- 238000012937 correction Methods 0.000 description 1
- 230000003247 decreasing effect Effects 0.000 description 1
- 230000001419 dependent effect Effects 0.000 description 1
- 238000013461 design Methods 0.000 description 1
- 230000001066 destructive effect Effects 0.000 description 1
- 239000003814 drug Substances 0.000 description 1
- 239000011521 glass Substances 0.000 description 1
- BCQZXOMGPXTTIC-UHFFFAOYSA-N halothane Chemical compound FC(F)(F)C(Cl)Br BCQZXOMGPXTTIC-UHFFFAOYSA-N 0.000 description 1
- 229960003132 halothane Drugs 0.000 description 1
- 230000005408 paramagnetism Effects 0.000 description 1
- 230000002093 peripheral effect Effects 0.000 description 1
- 238000003969 polarography Methods 0.000 description 1
- 230000035945 sensitivity Effects 0.000 description 1
- 238000000926 separation method Methods 0.000 description 1
- WFKWXMTUELFFGS-UHFFFAOYSA-N tungsten Chemical compound [W] WFKWXMTUELFFGS-UHFFFAOYSA-N 0.000 description 1
- 229910052721 tungsten Inorganic materials 0.000 description 1
- 239000010937 tungsten Substances 0.000 description 1
Images





Classifications
-
- G—PHYSICS
- G01—MEASURING; TESTING
- G01N—INVESTIGATING OR ANALYSING MATERIALS BY DETERMINING THEIR CHEMICAL OR PHYSICAL PROPERTIES
- G01N21/00—Investigating or analysing materials by the use of optical means, i.e. using sub-millimetre waves, infrared, visible or ultraviolet light
- G01N21/17—Systems in which incident light is modified in accordance with the properties of the material investigated
- G01N21/41—Refractivity; Phase-affecting properties, e.g. optical path length
- G01N21/45—Refractivity; Phase-affecting properties, e.g. optical path length using interferometric methods; using Schlieren methods
-
- G—PHYSICS
- G01—MEASURING; TESTING
- G01N—INVESTIGATING OR ANALYSING MATERIALS BY DETERMINING THEIR CHEMICAL OR PHYSICAL PROPERTIES
- G01N2201/00—Features of devices classified in G01N21/00
- G01N2201/12—Circuits of general importance; Signal processing
- G01N2201/124—Sensitivity
- G01N2201/1245—Averaging several measurements
Definitions
- This invention relates to an apparatus and method for analysing the constitution of a mixture of gases. It has particular application in the analysis of mixtures of gases and vapours used in medicine, for example in respirators and anaesthesia machines.
- Prior interferometric devices involve the measurement of interference fringes and this may be done by manually moving a travelling microscope or the like to count fringes relative to a graticule. This procedure is time consuming and prone to errors.
- An automatic refractometer has been described in which the fringes fall on a pair of photocells and compensating optics are driven by a moving coil or stepper motor to move the beam. These mechanical components may wear or fail and further, it is possible for a simple device to be inconsistent in its selection of a fringe and so give a false reading.
- a gas analyser of the kind adapted to produce an interference pattern, displacements of the interference pattern being indicative of changes of the constitution of a gas being analysed comprising an array of photo-sensitive elements arranged to receive the interference pattern, means for providing respective digital indications of the intensity of the interference pattern falling on the elements, and digital processing means arranged to determine the best fit of the digital indications with stored values intended to represent at least part of the interference pattern, so as to determine the position of at least one maximum or minimum in the interference pattern.
- the invention is applicable to interferometers of the kind employing a broad band source of light which produces an interference pattern of non-uniform shape in which it is possible to distinguish the various peaks by their shapes.
- the stored values are selected to reflect the shape (the variation of the intensity with distance of the peak) of the chosen principal peak and by use of the best fit method it is possible to identify unambiguously a particular peak and thus measure its displacement.
- the best fit is preferably determined by correlating the stored values with a number of digital indications from successive elements starting with one particular element, and then correlating the stored values with the same number of digital indications starting with the next element, and so on, and comparing the resulting correlation values to determine at which starting element the best fit occurs.
- the number of elements used is small relative to the total number of elements, this method is considerably more accurate than a procedure in which the minimum or maximum intensity is identified by a single measurement because a number of values are involved in the determination and so the procedure tolerates individual errors or failures in elements of the photosensitive array.
- the apparatus is arranged to determine the positions of two principal peaks, preferably the minima adjacent the central maximum peak. This allows an automatic test to be performed as to the separation of the minima so as to check that it falls within an expected range.
- the position of the central peak from the positions of the adjacent minima by calculating the centroid or mean position of the two minima.
- the digital indications of the intensities from all of the elements falling between the two minima are employed to determine the position of the centroid of the area of the central peak.
- the use of the two minima has the further advantage that "bias" errors (i.e. a graduall increasing or decreasing intensity error across the interference pattern or the output of the photosensitive array) can be compensated.
- the compensation is performed by calculating the average intensity value of the two minima, subtracting them to determine the amount of bias error therebetween, and using the bias error so determined to correct the intensity values of the elements of the central peak. This gives a very accurate indication of the true position of the centre of the central peak, which involves the use of a large number of the digital indications and so the process is highly insensitive to errors.
- the position of the fringe pattern on the array may be determined by a simplified method of convolution, in which the prestored pattern (or template) represents a large portion of the fringe pattern, typically centered on the principal maximum and extending some way beyond the principal minima.
- This prestored pattern would be stored with a resolution (pixel spacing) which is typically 1 or 2 orders of magnitude finer than the resolution of the measured data. In this way the convolution would determine the position of best fit accurately to a small fraction of the pixel spacing, without the need to correct for bias or calculate the centroid of an area. (Increasing the number of points on the template means the convolution will take longer to perform.
- the position of the central peak (in units of the element spacing) will be stored for comparison with a previous or subsequent fringe position to provide an indication of the displacement of the fringe pattern and hence of changes in the constitution of the gas.
- the position of the interference pattern is first determined using a sample consisting purely of one constituent of the mixture, then the position is determined using a sample including the other constituent, and the displacement of the interference pattern is used to determine the concentration of the other constituent.
- a calibration run may be performed using pure oxygen and then fresh respiratory gas consisting of a mixture of nitrous oxide and oxygen may be supplied to the gas analyser, so as to provide an indication of the concentration of nitrous oxide.
- the concentration of an anaesthetic vapour in the respiratory gas may be determined.
- the relation between the displacement of the interference pattern and the concentration of a constituent of the mixture depends on the difference in the optical path lengths through the interferometer which itself depends on the refractive index of the sample and hence on its constitution.
- the relation may be determined empirically by the analyser using standard samples, but preferably it is calculated from a knowledge of the optical path lenqths and refractive indices involved.
- a simple linear and additive relation may exist between the displacement and the concentration and different coefficients may be stored for calculating the concentrations of different constituents as indicated to the analyser by the operation of a manual control.
- the light source is preferably controllable by the processing means and digital indications of the outputs of the photosensitive elements are taken and stored as reference values with the light source turned off. The light source is then turned on and the digital intensity indications provided. The stored reference values may be subtracted from the respective intensity indications. In order to eliminate the effects of random noise, the intensity indications may be provided a number of times and the average values used.
- the invention provides a method of analysing a gas by producing an interference fringe pattern, comprising exposing an array of photosensitive elements to the fringe pattern, providing respective digital indications of the intensity of the interference pattern falling on the elements, and determining the best fit of the digital indications with stored values intended to represent at least part of the interference pattern, so as to determine the position of at least one maximum or minimum in the interference pattern.
- FIG. 1 The apparatus measures the difference in the optical path lengths between a reference gas and a mixture.
- a light source 1 such as a tungsten filament bulb, produces a beam of light through a diffuser and collimator 2 which is then split into two beams by a parallel-sided glass plate 3.
- One beam passes through a sample cell 4 and the other beam passes through an identical cell 5 containing a reference gas, such as oxygen or air.
- the light paths are then recombined and produce interference fringes.
- a typical fringe pattern is shown in Figure 3: it comprises a bright central area 6 corresponding to zero path difference where the beams interfere constructively for all wavelengths. On each side of the bright area is a dark band 7 caused by destructive interference.
- the interference pattern falls on a detector 8 consisting of an array of photosensitive elements, such as photodiodes or charge coupled devices. Each element of the array is sometimes referred to hereinafter as a "pixel". A typical array may comprise 128 photodiodes at 25 micron centres.
- An electronic processing circuit 9 operates to determine the position of the fringes from the outputs of the photosensitive elements, to calculate the gas concentrations and to perform other control functions as described below.
- the interference pattern can be adjusted by optical means so that when imaged on the array of photo- sensitive elements, the distance between two peaks corresponds to a sufficient number of pixels, typically 10 to 20, to provide fine resolution.
- the sensitivity of the instrument i.e. deflection for unit change in concentration
- FIG. 2 shows the arrangement of gas passages for providing gases to the sample cell under the control of the electronic circuitry.
- An electrically controllable gas mixer 30 is connected to receive the desired gases from appropriate sources and the selected gas or mixture is supplied to a sample point S1.
- An anaesthetic vaporiser 31 is connected between sample point S1 and a further sample point S2.
- a passage 10 from sample point 5, may supply for example oxygen and nitrous oxide to the sample cell 4 via a valve 11.
- passage 12 supplies a mixture of oxygen, nitrous oxide and anaesthetic vapour to the sample cell 4 via valve 13.
- Sample points S1 and S2 are located within the gas mixing system of the anaesthetic machine so that two gases (say oxygen and nitrous oxide) are mixed before flow reaches S1.
- Valve 14 is operable selectively to connect the sample cell 4 to the suction pump 15 or to atmosphere.
- the valves 11, 13 and 14 and the pump 15 are under electrical control and the arrangement is such that sample gas may be drawn into the cell 4 and then equilibrated to atmospheric pressure.
- FIG 4 shows the array 8 of photosensitive elements which are controlled by a timing circuit 16.
- Timing circuit 16 produces a train of 128 pulses at 150 microsecond intervals to clock data out from the array as a series of analogue pulses, the amplitude of each pulse depending on the intensity of light falling on its respective photodiode.
- Each pulse is amplified and held by a fast peak detector or sample and hold circuit 17 which is also controlled by the timing circuit 16. Whilst the peak value is held between the clock pulses an analogue-to-digital converter 18 converts it to a digital indication.
- the digital value is read into and stored by a microprocessor 19 ( Figure 5); thus the microprocessor stores a series of 128 words or bytes representing the amplitude of the light signal across the array.
- the results of the calculation performed by the microprocessor are displayed on a display such as a seven segment. display 20 and as mentioned above the circuit controls the valves 11, 13 and 14.
- the microprocessor is also arranged to control the lamp 1 and connect via an interface 21 to a host computer, which may control other machine functions. Inputs to the microprocessor 19 include manual controls to indicate the vapour type in use and to indicate that a calibration mode should operate.
- the microprocessor memory is pre-programmed with calibration and conversion values giving the relation between the amount of shift in the interference pattern and the concentration of various gases and vapours. It is also provided with a series of values representing the shape of the minima 7 in the interference pattern, which may resemble a cosine function.
- the processor first operates to perform a convolution of the stored function with the array data, i.e. the digital intensity values read in to the memory.
- the stored values are multiplied by respective pixel intensity values for a small number of pixels, e.g. 9, starting with for example the fourth pixel, to derive a correlation value.
- An example of the values of a typica! stored function is 27, 9, -7, -18, -23, -18, -7, 9, 27.
- a similar correlation value is calculated for the same number of pixels beginning with the next pixel, i.e. the nine pixels beginning with the fifth pixel, and so on.
- the two largest correlation values are then selected and these reveal which pixels are the starting pixels of the best fitting minima.
- a test is then carried out to determine the spacing in units of the pixel spacing between the two minima determined. This should agree with a design value, which might typically be between 10 and 20 pixels, as the spatial wavelength does not vary greatly. In this way it is possible to check that gross errors in the selection of the minima have not occurred, If it is found that there are two closely adjacent maximum correlation values the position of each minimum is taken to be at the average position and a third point of maximum correlation is selected as the other minimum.
- a bias correction may then be carried out to compensate for uniform variations in the outputs of the photosensitive elements.
- the three lowest pixel intensity values are selected for each minimum and their average intensity calculated. If there is a difference between the intensities of the minima, this is an indication of the bias over the distance between them.
- the intensity values for the pixels between the minima i.e. the pixels in the central peak, may then be corrected for the bias error.
- the centroid of the intensity values for all of the pixels in the central peak is calculated to give an indication of the true centre of the central peak.
- the centroid or even the midpoint of the two minima could be calculated but this may not give such an accurate indication of the true position of the fringe pattern.
- the use of the convolution or best fit technique described above to identify the desired fringes is effective to reduce errors and ensure that in two subsequent measurements the movement of the same fringe is determined.
- FIG. 7a the schematic logic of a program in the microprocessor 19 for controlling gas analysis in an anaesthesia apparatus is shown.
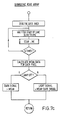
- a calibration function (not shown) may be carried out by applying 100% oxygen to the sample cell 4 and equilibrating to atmospheric pressure. The fringe position is determined as described above and the position stored. The analyser may then operate in the analysis mode in which the first gas mixture, e.g. nitrous oxide and oxygen, is pumped into the sample cell and then again equilibrated to atmospheric pressure (Fig. 7b).
- the first gas mixture e.g. nitrous oxide and oxygen
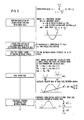
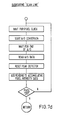
- the fringe position is determined as follows: first of all the lamp 1 is turned off and the intensity values of the photosensitive elements read into the microprocessor memory, being indications of the leakage or dark current of the photocells (Fig. 7a,7c). The lamp is then turned on by the microprocessor and the intensity values again read. The reading of the light values is repeated a number of times and the average taken and the dark values are then subtracted to give 128 corrected values. This serves to remove the effects of random pixel and electrical noise (Fig. 7c). The position of the fringe pattern is then determined as described above with reference to Figure 6 and the amount of fringe shift is calculated as compared to 100% oxygen (Fig. 7e).
- the concentrations of nitrous oxide and oxygen may then be calculated by dividing the amount of fringe shift by a prestored coefficient.
- the resulting value may then be displayed or used by the host computer.
- the valves 11, 13 and 14 and pump 15 may then be operated to draw in the nitrous oxide, oxygen and anaesthetic vapour mixture from the source S 2 and to equilibrate the pressure to atmospheric (Fig. 7a, 7b), and a similar procedure to determine the fringe shift is carried out.
- the particular vapour in use is identified by the operator via a manual input control or by a message from the host computer and the vapour concentration is determined by dividing the amount of fringe shift as compared to the nitrous oxide and oxygen mixture by a prestored coefficient appropriate to the vapour in use.
- the concentration of anaesthetic vapour is displayed and sent to the host computer if required (Fig. 7b).
Landscapes
- Physics & Mathematics (AREA)
- Health & Medical Sciences (AREA)
- Life Sciences & Earth Sciences (AREA)
- Chemical & Material Sciences (AREA)
- Analytical Chemistry (AREA)
- Biochemistry (AREA)
- General Health & Medical Sciences (AREA)
- General Physics & Mathematics (AREA)
- Immunology (AREA)
- Pathology (AREA)
- Investigating Or Analysing Materials By Optical Means (AREA)
Description
- This invention relates to an apparatus and method for analysing the constitution of a mixture of gases. It has particular application in the analysis of mixtures of gases and vapours used in medicine, for example in respirators and anaesthesia machines.
- Many techniques are known for analysing the constitution of mixtures of gases. For example, paramagnetism, infra-red spectroscopy, ultraviolet absorption and polarography may be used for measuring the concentration of particular gases. Other techniques, such as gas chromatography, mass spectroscopy and interference refractometry have been used to measure a wide range of gases. Gas chromatography has the disadvantages that it is normally slow in action and requires high voltages which are undesirable in medical situations; mass spectrometry requires cumbersome and expensive equipment.
- Prior interferometric devices involve the measurement of interference fringes and this may be done by manually moving a travelling microscope or the like to count fringes relative to a graticule. This procedure is time consuming and prone to errors. An automatic refractometer has been described in which the fringes fall on a pair of photocells and compensating optics are driven by a moving coil or stepper motor to move the beam. These mechanical components may wear or fail and further, it is possible for a simple device to be inconsistent in its selection of a fringe and so give a false reading.
- According to the invention, there is provided a gas analyser of the kind adapted to produce an interference pattern, displacements of the interference pattern being indicative of changes of the constitution of a gas being analysed, comprising an array of photo-sensitive elements arranged to receive the interference pattern, means for providing respective digital indications of the intensity of the interference pattern falling on the elements, and digital processing means arranged to determine the best fit of the digital indications with stored values intended to represent at least part of the interference pattern, so as to determine the position of at least one maximum or minimum in the interference pattern.
- The invention is applicable to interferometers of the kind employing a broad band source of light which produces an interference pattern of non-uniform shape in which it is possible to distinguish the various peaks by their shapes. The stored values are selected to reflect the shape (the variation of the intensity with distance of the peak) of the chosen principal peak and by use of the best fit method it is possible to identify unambiguously a particular peak and thus measure its displacement.
- The best fit is preferably determined by correlating the stored values with a number of digital indications from successive elements starting with one particular element, and then correlating the stored values with the same number of digital indications starting with the next element, and so on, and comparing the resulting correlation values to determine at which starting element the best fit occurs. Although the number of elements used is small relative to the total number of elements, this method is considerably more accurate than a procedure in which the minimum or maximum intensity is identified by a single measurement because a number of values are involved in the determination and so the procedure tolerates individual errors or failures in elements of the photosensitive array.
- It is possible to examine the entire received interference pattern, or a limited portion thereof, such as the central maximum peak where constructive interference occurs for all wavelengths but preferably the apparatus is arranged to determine the positions of two principal peaks, preferably the minima adjacent the central maximum peak. This allows an automatic test to be performed as to the separation of the minima so as to check that it falls within an expected range.
- It is possible to determine the position of the central peak from the positions of the adjacent minima by calculating the centroid or mean position of the two minima. Preferably, however, the digital indications of the intensities from all of the elements falling between the two minima are employed to determine the position of the centroid of the area of the central peak. The use of the two minima has the further advantage that "bias" errors (i.e. a graduall increasing or decreasing intensity error across the interference pattern or the output of the photosensitive array) can be compensated. In accordance with a feature of the invention the compensation is performed by calculating the average intensity value of the two minima, subtracting them to determine the amount of bias error therebetween, and using the bias error so determined to correct the intensity values of the elements of the central peak. This gives a very accurate indication of the true position of the centre of the central peak, which involves the use of a large number of the digital indications and so the process is highly insensitive to errors.
- The position of the fringe pattern on the array may be determined by a simplified method of convolution, in which the prestored pattern (or template) represents a large portion of the fringe pattern, typically centered on the principal maximum and extending some way beyond the principal minima. This prestored pattern would be stored with a resolution (pixel spacing) which is typically 1 or 2 orders of magnitude finer than the resolution of the measured data. In this way the convolution would determine the position of best fit accurately to a small fraction of the pixel spacing, without the need to correct for bias or calculate the centroid of an area. (Increasing the number of points on the template means the convolution will take longer to perform. However the length of time can be minimized by performing a coarse convolution over the whole array to locate the approximate position of the pattern and then performing a fine convolution over a small area surrounding the true position. Abandoning the bias and centroid calculations would save a similar amount of time to that required for the extra convolution.)
- The position of the central peak (in units of the element spacing) will be stored for comparison with a previous or subsequent fringe position to provide an indication of the displacement of the fringe pattern and hence of changes in the constitution of the gas. In order to analyse a mixture of gases the position of the interference pattern is first determined using a sample consisting purely of one constituent of the mixture, then the position is determined using a sample including the other constituent, and the displacement of the interference pattern is used to determine the concentration of the other constituent. For example, in an anaesthesia apparatus a calibration run may be performed using pure oxygen and then fresh respiratory gas consisting of a mixture of nitrous oxide and oxygen may be supplied to the gas analyser, so as to provide an indication of the concentration of nitrous oxide. In a subsequent run the concentration of an anaesthetic vapour in the respiratory gas may be determined. The relation between the displacement of the interference pattern and the concentration of a constituent of the mixture depends on the difference in the optical path lengths through the interferometer which itself depends on the refractive index of the sample and hence on its constitution. The relation may be determined empirically by the analyser using standard samples, but preferably it is calculated from a knowledge of the optical path lenqths and refractive indices involved. A simple linear and additive relation may exist between the displacement and the concentration and different coefficients may be stored for calculating the concentrations of different constituents as indicated to the analyser by the operation of a manual control.
- Instead of oxygen, room air might be used as the calibration reference gas. The refractive index is close to that of oxygen but the small measurement produced when oxygen is introduced during calibration serves to indicate the correct functioning of the apparatus.
- In order to compensate for the various leakage currents of the photosensitive elements, the light source is preferably controllable by the processing means and digital indications of the outputs of the photosensitive elements are taken and stored as reference values with the light source turned off. The light source is then turned on and the digital intensity indications provided. The stored reference values may be subtracted from the respective intensity indications. In order to eliminate the effects of random noise, the intensity indications may be provided a number of times and the average values used.
- Viewed from another aspect the invention provides a method of analysing a gas by producing an interference fringe pattern, comprising exposing an array of photosensitive elements to the fringe pattern, providing respective digital indications of the intensity of the interference pattern falling on the elements, and determining the best fit of the digital indications with stored values intended to represent at least part of the interference pattern, so as to determine the position of at least one maximum or minimum in the interference pattern.
- An embodiment of the invention will now be described by way of example and with reference to the accompanying drawings, in which:
- Figure 1 is a schematic view of a gas analyser according to the invention, showing particularly the optical arrangement;
- Figure 2 shows the gas connections to the analyser of Figure 1;
- Figure 3 illustrates a typical interference pattern obtained in the analyser of Figure 1;
- Figure 4 is a block diagram showing the input circuitry for providing intensity values to the processing circuitry;
- Figure 5 is a block diagram of the processing and peripheral circuitry;
- Figure 6 shows the formulae used to determine the position of the interference pattern; and
- Figures 7a to 7e show the structured schematic logic of the operation of the apparatus in analysing gases in an anaesthesia machine.
- Referring to the drawings, the principles of interferometric gas analysis are illustrated in Figure 1. The apparatus measures the difference in the optical path lengths between a reference gas and a mixture. A
light source 1, such as a tungsten filament bulb, produces a beam of light through a diffuser andcollimator 2 which is then split into two beams by a parallel-sided glass plate 3. One beam passes through a sample cell 4 and the other beam passes through an identical cell 5 containing a reference gas, such as oxygen or air. The light paths are then recombined and produce interference fringes. A typical fringe pattern is shown in Figure 3: it comprises a brightcentral area 6 corresponding to zero path difference where the beams interfere constructively for all wavelengths. On each side of the bright area is adark band 7 caused by destructive interference. Moving outwards there are several coloured bands where there is constructive interference for the corresponding colour components in the white light. The shift of the fringes relative to the origin obtained with the reference gas in both cells indicates the concentration of the second gas in the mixture. Both nitrous oxide and anaesthetic vapours cause a shift in the interference pattern and for concentrations in common anaesthetic practice (70% nitrous oxide, and less than 4% halothane) these are around the same order of magnitude. Thus one interferometer may be used for both gas and vapour. The shift is dependent on concentration, refractive index, pressure and temperature. - The interference pattern falls on a
detector 8 consisting of an array of photosensitive elements, such as photodiodes or charge coupled devices. Each element of the array is sometimes referred to hereinafter as a "pixel". A typical array may comprise 128 photodiodes at 25 micron centres. An electronic processing circuit 9 operates to determine the position of the fringes from the outputs of the photosensitive elements, to calculate the gas concentrations and to perform other control functions as described below. The interference pattern can be adjusted by optical means so that when imaged on the array of photo- sensitive elements, the distance between two peaks corresponds to a sufficient number of pixels, typically 10 to 20, to provide fine resolution. The sensitivity of the instrument (i.e. deflection for unit change in concentration) is determined by the optical length of the sample cells. - Figure 2 shows the arrangement of gas passages for providing gases to the sample cell under the control of the electronic circuitry. An electrically
controllable gas mixer 30 is connected to receive the desired gases from appropriate sources and the selected gas or mixture is supplied to a sample point S1. Ananaesthetic vaporiser 31 is connected between sample point S1 and a further sample point S2. Apassage 10 from sample point 5, may supply for example oxygen and nitrous oxide to the sample cell 4 via avalve 11. Similarly,passage 12 supplies a mixture of oxygen, nitrous oxide and anaesthetic vapour to the sample cell 4 viavalve 13. Sample points S1 and S2 are located within the gas mixing system of the anaesthetic machine so that two gases (say oxygen and nitrous oxide) are mixed before flow reaches S1. Another gas or vapour is added between S1 and S2, before the complete mixture is passed towards the patient. In principle, the process may be extended via a further gas mixer or vaporiser to further sample points S3, S4, etc. with one more component of the mixture being added between each pair of points.Valve 14 is operable selectively to connect the sample cell 4 to thesuction pump 15 or to atmosphere. Thevalves pump 15 are under electrical control and the arrangement is such that sample gas may be drawn into the cell 4 and then equilibrated to atmospheric pressure. - Figure 4 shows the
array 8 of photosensitive elements which are controlled by atiming circuit 16. Timingcircuit 16 produces a train of 128 pulses at 150 microsecond intervals to clock data out from the array as a series of analogue pulses, the amplitude of each pulse depending on the intensity of light falling on its respective photodiode. Each pulse is amplified and held by a fast peak detector or sample and holdcircuit 17 which is also controlled by thetiming circuit 16. Whilst the peak value is held between the clock pulses an analogue-to-digital converter 18 converts it to a digital indication. The digital value is read into and stored by a microprocessor 19 (Figure 5); thus the microprocessor stores a series of 128 words or bytes representing the amplitude of the light signal across the array. The results of the calculation performed by the microprocessor are displayed on a display such as a seven segment.display 20 and as mentioned above the circuit controls thevalves lamp 1 and connect via aninterface 21 to a host computer, which may control other machine functions. Inputs to themicroprocessor 19 include manual controls to indicate the vapour type in use and to indicate that a calibration mode should operate. - The microprocessor memory is pre-programmed with calibration and conversion values giving the relation between the amount of shift in the interference pattern and the concentration of various gases and vapours. It is also provided with a series of values representing the shape of the
minima 7 in the interference pattern, which may resemble a cosine function. Referring to Figure 6, the processor first operates to perform a convolution of the stored function with the array data, i.e. the digital intensity values read in to the memory. The stored values are multiplied by respective pixel intensity values for a small number of pixels, e.g. 9, starting with for example the fourth pixel, to derive a correlation value. An example of the values of a typica! stored function is 27, 9, -7, -18, -23, -18, -7, 9, 27. A similar correlation value is calculated for the same number of pixels beginning with the next pixel, i.e. the nine pixels beginning with the fifth pixel, and so on. The two largest correlation values are then selected and these reveal which pixels are the starting pixels of the best fitting minima. A test is then carried out to determine the spacing in units of the pixel spacing between the two minima determined. This should agree with a design value, which might typically be between 10 and 20 pixels, as the spatial wavelength does not vary greatly. In this way it is possible to check that gross errors in the selection of the minima have not occurred, If it is found that there are two closely adjacent maximum correlation values the position of each minimum is taken to be at the average position and a third point of maximum correlation is selected as the other minimum. - A bias correction may then be carried out to compensate for uniform variations in the outputs of the photosensitive elements. The three lowest pixel intensity values are selected for each minimum and their average intensity calculated. If there is a difference between the intensities of the minima, this is an indication of the bias over the distance between them. The intensity values for the pixels between the minima, i.e. the pixels in the central peak, may then be corrected for the bias error. Finally, the centroid of the intensity values for all of the pixels in the central peak is calculated to give an indication of the true centre of the central peak. In an alternative approach, the centroid or even the midpoint of the two minima could be calculated but this may not give such an accurate indication of the true position of the fringe pattern. However, in both cases it will be seen that the use of the convolution or best fit technique described above to identify the desired fringes is effective to reduce errors and ensure that in two subsequent measurements the movement of the same fringe is determined.
- Referring to Figures 7a to 7e, the schematic logic of a program in the
microprocessor 19 for controlling gas analysis in an anaesthesia apparatus is shown. When the mains supply is switched on various initialisation and test functions are performed. In the event of a fault, an error code is provided on the display 20 (Fig. 7a), A calibration function (not shown) may be carried out by applying 100% oxygen to the sample cell 4 and equilibrating to atmospheric pressure. The fringe position is determined as described above and the position stored. The analyser may then operate in the analysis mode in which the first gas mixture, e.g. nitrous oxide and oxygen, is pumped into the sample cell and then again equilibrated to atmospheric pressure (Fig. 7b). The fringe position is determined as follows: first of all thelamp 1 is turned off and the intensity values of the photosensitive elements read into the microprocessor memory, being indications of the leakage or dark current of the photocells (Fig. 7a,7c). The lamp is then turned on by the microprocessor and the intensity values again read. The reading of the light values is repeated a number of times and the average taken and the dark values are then subtracted to give 128 corrected values. This serves to remove the effects of random pixel and electrical noise (Fig. 7c). The position of the fringe pattern is then determined as described above with reference to Figure 6 and the amount of fringe shift is calculated as compared to 100% oxygen (Fig. 7e). The concentrations of nitrous oxide and oxygen may then be calculated by dividing the amount of fringe shift by a prestored coefficient. The resulting value may then be displayed or used by the host computer. Thevalves
Claims (10)
Applications Claiming Priority (2)
| Application Number | Priority Date | Filing Date | Title |
|---|---|---|---|
| GB848415670A GB8415670D0 (en) | 1984-06-20 | 1984-06-20 | Gas analysis apparatus |
| GB8415670 | 1984-06-20 |
Publications (3)
| Publication Number | Publication Date |
|---|---|
| EP0165816A2 EP0165816A2 (en) | 1985-12-27 |
| EP0165816A3 EP0165816A3 (en) | 1986-08-13 |
| EP0165816B1 true EP0165816B1 (en) | 1989-06-14 |
Family
ID=10562683
Family Applications (1)
| Application Number | Title | Priority Date | Filing Date |
|---|---|---|---|
| EP85304410A Expired EP0165816B1 (en) | 1984-06-20 | 1985-06-20 | Gas analysis apparatus and method |
Country Status (5)
| Country | Link |
|---|---|
| US (1) | US4690562A (en) |
| EP (1) | EP0165816B1 (en) |
| JP (1) | JPS6182143A (en) |
| DE (1) | DE3571077D1 (en) |
| GB (1) | GB8415670D0 (en) |
Families Citing this family (10)
| Publication number | Priority date | Publication date | Assignee | Title |
|---|---|---|---|---|
| US4653855A (en) * | 1984-10-09 | 1987-03-31 | Quantum Diagnostics Ltd. | Apparatus and process for object analysis by perturbation of interference fringes |
| JPH0640071B2 (en) * | 1987-05-02 | 1994-05-25 | 工業技術院長 | Highly accurate humidity measurement method using the second derivative curve of water vapor absorption line |
| SE467022B (en) * | 1988-05-11 | 1992-05-11 | Mecora Ab | MEAN TO MEET THE CONCENTRATION OF A SUBJECT IN A SUSTAINABILITY, AND A CONCENTRATION METER |
| US5168325A (en) * | 1990-02-28 | 1992-12-01 | Board Of Control Of Michigan Technological University | Interferometric measurement of glucose by refractive index determination |
| US5218426A (en) * | 1991-07-01 | 1993-06-08 | The United States Of America As Represented By The Secretary Of Commerce | Highly accurate in-situ determination of the refractivity of an ambient atmosphere |
| US5231466A (en) * | 1991-08-01 | 1993-07-27 | Dow Chemical Company | Capillary fluid stream concentration measuring apparatus and method |
| FR2697336B1 (en) * | 1992-10-28 | 1994-12-16 | Inst Francais Du Petrole | Method and device for differential measurement of refractive indices and associated use. |
| US5633715A (en) * | 1994-05-20 | 1997-05-27 | Wyko Corporation | Centroid approach for estimating modulation peak in broad-bandwidth interferometry |
| SE9602960D0 (en) * | 1996-08-09 | 1996-08-09 | Siemens Elema Ab | Anesthetic Liquid Identification |
| JP5481402B2 (en) * | 2011-01-17 | 2014-04-23 | 株式会社日立ハイテクノロジーズ | Automatic analyzer |
Family Cites Families (7)
| Publication number | Priority date | Publication date | Assignee | Title |
|---|---|---|---|---|
| CH428260A (en) * | 1965-09-03 | 1967-01-15 | Siemens Ag Albis | Device for determining the relative refractive index of translucent materials in relation to a medium with a known refractive index |
| US3487227A (en) * | 1966-12-22 | 1969-12-30 | Cornell Aeronautical Labor Inc | Three-aperture optical interferometer |
| US3957376A (en) * | 1974-01-25 | 1976-05-18 | International Business Machines Corporation | Measuring method and system using a diffraction pattern |
| JPS5226272A (en) * | 1975-08-22 | 1977-02-26 | Agency Of Ind Science & Technol | Method of detecting moving position of interference fringes |
| US4169980A (en) * | 1977-04-19 | 1979-10-02 | Zygo Corporation | Method and apparatus for interference fringe center sensing |
| NL8005258A (en) * | 1980-09-22 | 1982-04-16 | Philips Nv | INTERFEROMETER. |
| US4449823A (en) * | 1982-02-12 | 1984-05-22 | The United States Of America As Represented By The Secretary Of Commerce | Device for measurement of the spectral width of nearly monochromatic sources of radiant energy |
-
1984
- 1984-06-20 GB GB848415670A patent/GB8415670D0/en active Pending
-
1985
- 1985-06-19 US US06/746,338 patent/US4690562A/en not_active Expired - Fee Related
- 1985-06-20 JP JP60133150A patent/JPS6182143A/en active Pending
- 1985-06-20 EP EP85304410A patent/EP0165816B1/en not_active Expired
- 1985-06-20 DE DE8585304410T patent/DE3571077D1/en not_active Expired
Also Published As
| Publication number | Publication date |
|---|---|
| GB8415670D0 (en) | 1984-07-25 |
| EP0165816A2 (en) | 1985-12-27 |
| DE3571077D1 (en) | 1989-07-20 |
| US4690562A (en) | 1987-09-01 |
| EP0165816A3 (en) | 1986-08-13 |
| JPS6182143A (en) | 1986-04-25 |
Similar Documents
| Publication | Publication Date | Title |
|---|---|---|
| CA1127865A (en) | Method and device for analysis with color identification test paper | |
| EP0250959B1 (en) | Method of calibrating reflectance measuring devices | |
| US5218426A (en) | Highly accurate in-situ determination of the refractivity of an ambient atmosphere | |
| US4914719A (en) | Multiple component gas analyzer | |
| US3586441A (en) | Atomic absorption spectroanalysis system | |
| US4690562A (en) | Gas analysis apparatus and method | |
| JPH10318913A (en) | Reflectance-measuring apparatus | |
| JPH04259847A (en) | Optical analyzer and calibrating method thereof | |
| US5739535A (en) | Optical gas analyzer | |
| JP2003521706A (en) | How to determine the safety of gas mixtures | |
| US4650334A (en) | Optical straightness gauge and method | |
| US5168325A (en) | Interferometric measurement of glucose by refractive index determination | |
| US3177757A (en) | Method of performing reflective oximetry | |
| GB2054843A (en) | Absorption cell gas monitor | |
| Pugh et al. | Automatic gauge block measurement using multiple wavelength interferometry | |
| US4096388A (en) | Measuring gaseous oxygen with U.V. absorption | |
| WO2002039094A1 (en) | Measuring method and instrument comprising image sensor | |
| EP0779507A1 (en) | A method for determining the concentration of a specific gas and an analyzer | |
| US5065613A (en) | Method for the direct presentation of a differential measured quantity in terms of its correct physical unit | |
| JPH0781840B2 (en) | Optical film thickness measuring device | |
| Sugg et al. | An automated interferometer for the analysis of anaesthetic gas mixtures | |
| JPS6367521A (en) | Device and method of measuring displacement | |
| CN114659997A (en) | Spectrophotometer based on improve measurement accuracy | |
| US4417812A (en) | Circuit arrangement for determining the characteristics of liquids and/or gases, in particular the hemoglobin content of the blood | |
| Reniff | Transferring the 45/0 spectral reflectance factor scale |
Legal Events
| Date | Code | Title | Description |
|---|---|---|---|
| PUAI | Public reference made under article 153(3) epc to a published international application that has entered the european phase |
Free format text: ORIGINAL CODE: 0009012 |
|
| AK | Designated contracting states |
Designated state(s): DE FR GB IT SE |
|
| PUAL | Search report despatched |
Free format text: ORIGINAL CODE: 0009013 |
|
| AK | Designated contracting states |
Kind code of ref document: A3 Designated state(s): DE FR GB IT SE |
|
| 17P | Request for examination filed |
Effective date: 19870108 |
|
| 17Q | First examination report despatched |
Effective date: 19880616 |
|
| GRAA | (expected) grant |
Free format text: ORIGINAL CODE: 0009210 |
|
| AK | Designated contracting states |
Kind code of ref document: B1 Designated state(s): DE FR GB IT SE |
|
| ITTA | It: last paid annual fee | ||
| REF | Corresponds to: |
Ref document number: 3571077 Country of ref document: DE Date of ref document: 19890720 |
|
| ET | Fr: translation filed | ||
| ITF | It: translation for a ep patent filed | ||
| PLBE | No opposition filed within time limit |
Free format text: ORIGINAL CODE: 0009261 |
|
| STAA | Information on the status of an ep patent application or granted ep patent |
Free format text: STATUS: NO OPPOSITION FILED WITHIN TIME LIMIT |
|
| 26N | No opposition filed | ||
| PGFP | Annual fee paid to national office [announced via postgrant information from national office to epo] |
Ref country code: GB Payment date: 19920508 Year of fee payment: 8 |
|
| PGFP | Annual fee paid to national office [announced via postgrant information from national office to epo] |
Ref country code: SE Payment date: 19920603 Year of fee payment: 8 |
|
| PGFP | Annual fee paid to national office [announced via postgrant information from national office to epo] |
Ref country code: FR Payment date: 19920617 Year of fee payment: 8 |
|
| PGFP | Annual fee paid to national office [announced via postgrant information from national office to epo] |
Ref country code: DE Payment date: 19920622 Year of fee payment: 8 |
|
| PG25 | Lapsed in a contracting state [announced via postgrant information from national office to epo] |
Ref country code: GB Effective date: 19930620 |
|
| PG25 | Lapsed in a contracting state [announced via postgrant information from national office to epo] |
Ref country code: SE Effective date: 19930621 |
|
| GBPC | Gb: european patent ceased through non-payment of renewal fee |
Effective date: 19930620 |
|
| PG25 | Lapsed in a contracting state [announced via postgrant information from national office to epo] |
Ref country code: FR Effective date: 19940228 |
|
| PG25 | Lapsed in a contracting state [announced via postgrant information from national office to epo] |
Ref country code: DE Effective date: 19940301 |
|
| REG | Reference to a national code |
Ref country code: FR Ref legal event code: ST |
|
| EUG | Se: european patent has lapsed |
Ref document number: 85304410.5 Effective date: 19940110 |