EP0148076B1 - Compressional/shear wave separation in seismic profiling - Google Patents
Compressional/shear wave separation in seismic profiling Download PDFInfo
- Publication number
- EP0148076B1 EP0148076B1 EP84402671A EP84402671A EP0148076B1 EP 0148076 B1 EP0148076 B1 EP 0148076B1 EP 84402671 A EP84402671 A EP 84402671A EP 84402671 A EP84402671 A EP 84402671A EP 0148076 B1 EP0148076 B1 EP 0148076B1
- Authority
- EP
- European Patent Office
- Prior art keywords
- compressional
- measurements
- borehole
- shear
- seismic
- Prior art date
- Legal status (The legal status is an assumption and is not a legal conclusion. Google has not performed a legal analysis and makes no representation as to the accuracy of the status listed.)
- Expired
Links
Images



Classifications
-
- G—PHYSICS
- G01—MEASURING; TESTING
- G01V—GEOPHYSICS; GRAVITATIONAL MEASUREMENTS; DETECTING MASSES OR OBJECTS; TAGS
- G01V1/00—Seismology; Seismic or acoustic prospecting or detecting
- G01V1/28—Processing seismic data, e.g. for interpretation or for event detection
- G01V1/284—Application of the shear wave component and/or several components of the seismic signal
- G01V1/286—Mode conversion
-
- G—PHYSICS
- G01—MEASURING; TESTING
- G01V—GEOPHYSICS; GRAVITATIONAL MEASUREMENTS; DETECTING MASSES OR OBJECTS; TAGS
- G01V1/00—Seismology; Seismic or acoustic prospecting or detecting
- G01V1/40—Seismology; Seismic or acoustic prospecting or detecting specially adapted for well-logging
- G01V1/42—Seismology; Seismic or acoustic prospecting or detecting specially adapted for well-logging using generators in one well and receivers elsewhere or vice versa
-
- G—PHYSICS
- G01—MEASURING; TESTING
- G01V—GEOPHYSICS; GRAVITATIONAL MEASUREMENTS; DETECTING MASSES OR OBJECTS; TAGS
- G01V2210/00—Details of seismic processing or analysis
- G01V2210/10—Aspects of acoustic signal generation or detection
- G01V2210/16—Survey configurations
- G01V2210/161—Vertical seismic profiling [VSP]
Definitions
- the invention is in the field of seismic surveys useful in exploring for valuable subsurface resources.
- One aspect of the invention concerns vertical seismic profiling and more particularly separating the compressional and shear components of the vector wavefield measured in vertical seismic profiling.
- Another aspect concerns similar separation in surface seismics (also called horizontal profiling).
- VSP Vertical seismic profiling
- a seismic signal generated at or near the surface of the earth is recorded by geophones secured at various depths to the wall of a borehole.
- vertical seismic profiling uses geophones at locations spaced along the borehole axis. These geophones typically respond to both upgoing and downgoing seismic events, in contrast to horizontal seismicprofiling, where the geophones typically cannot respond directly to downgoing events.
- the distance between geophone recording locations in vertical seismic profiling is typically a small fraction of that used in horizontal profiling.
- VSP measurements can give insight into some fundamental properties of propagating seismic waves and assist in the structural, stratigraphic, and lithological interpretation of subsurface formations. For example, an important use of VSP measurements is to help define upgoing and downgoing seismic events within the earth and thereby help determine which events arriving at the surface are primary reflections and which are multiples.
- VSP Video Signal Processing
- Other applications of VSP include estimation of reflector dip, correlation of shear wave reflections with compressional wave reflections, location of fault planes, determination of lithological effects on propagating wavelets, looking for reflectors ahead of the drill bit, determining hydrocarbon effects on propagating wavelets, identification of intrabed multiples, measurement of both compressional and shear wave velocities, and estimation of the conversion of compressional to shear and shear to compressional energy modes within the earth.
- Background information concerning VSP can be found in Hardage, B. A., Vertical Seismic Profiling, Part A: Principles, Geophysical Press, 1983, Volume 14A of Handbook of Geophysical Exploration, Section I.
- vertical seismic profiling involves providing a seismic source at or near the earth surface and near a borehole, and providing vertical seismic profile measurements by means of geophones positioned at selected depth levels in the borehole. While it should be possible to position geophones at each desired depth in the borehole such that all can respond to the same seismic event generated by the source, it is believed typical, at least in the Western world, to use instead a geophone (or geophones) carried by a single seismic tool which is suspended by cable in the borehole and is successively clamped to the borehole wall at selected depths, to thereby respond to different wavelets from the source at different depths.
- the source can be a small chemical explosive shot near the bottom of a relatively shallow, cased and cemented well drilled near the borehole, or it can be one of the impulsive surface sources, such as weight droppers and devices that use explosive gases or compressed air to drive a heavy pad vertically downward with great force, or vibrators of the kind used as energy sources in hydrocarbon exploration.
- the borehole can be vertical or deviated, so long as the deviation is accounted for in interpreting the measurements, and can be cased or uncased.
- a typical downhole tool used in vertical seismic profiling typically contains at least one geophone that is sufficiently protected to withstand the adverse environment in a deep borehole and yet can achieve satisfactory acoustic coupling with the formation.
- Two typical configurations are a tool that has a retractable electrically operated pivot arm which can press the geophone(s) against the borehole wall at selected depth levels, and a tool with a retractable electrically driven telescoping ram serving the same purpose.
- the geophone transducer element or elements in a VSP tool can be either only vertically oriented or can be, for example, in a 3-component orientation (e.g., orthogonal at xyz or tilted relative to each other at some other angle, e.g., at 54°).
- the geophone along the z (depth) axis in a vertical borehole measures vertical particle motion
- the geophones oriented along the x and y directions measure particle motion along two orthogonal directions in the horizontal plane.
- the three geophones are designed to exhibit closely matched amplitude and phase responses
- the device that presses the tool against the borehole wall is designed to create a geophone-to-formation bond which would result in the horizontal geophones being mechanically coupled to the formation in the same way as the vertical geophone.
- a 3-component tool typically also includes an orientation measuring device (typically made up of one or more magnetometers that measure azimuth from magnetic North and one or more gravity sensitive accelerometers that measure deviation from vertical), a downhole digitizing system which can digitize the geophone transducer outputs within the tool and send the digitized signals up to the surface through wires in the cable suspending the tool, and other equipment, such as devices to check the quality of acoustic coupling with the formation.
- US patent 3 302 164 (K. H. Waters et al) describes a seismic surveying method in which a first seismic signal is generated and received to produce a pressure (compression) wave seismogram and a second seismic signal is generated and received to produce a separate shear wave seismogram.
- the pressure wave and the shear wave are correlated to compute the ratio between the shear wave velocity and the pressure wave velocity.
- any given geophone typically contains contribution from both compressional and shear wave components (and may contain contributions from other wave components) even when the surface seismic source is designed to optimize the generation of compressional and minimize the generation of shear waves.
- the surface seismic source could generate a purely compressional wave, a considerable amount of compressional wave energy may still be converted into shear wave modes whenever a propagating compressional wave encounters a reflecting surface at an oblique angle of incidence. It is believed that these converted shear wave modes can be valuable for interpreting subsurface geological conditions, as can be shear modes deliberately created by shear wave energy sources.
- converted shear wave modes can be particularly valuable seismic measurements when used in concert with compressional wave energy measurements to interpret elastic constants of rocks or to predict the types of pore fluids in rock units or to predict other subsurface lithology parameters.
- certain techniques can benefit from such separation because they need, or are believed to work better with, direct or indirect measurements of only the compressional, or only the shear components of the total energy arriving at downhole geophones.
- One example is the use of a technique similar to medical computed tomography and relying on offset VSP, or on well-to-well VSP measurements to image the zx plane of interest. Such a technique is helped by the use of data representing the separated compressional (or perhaps shear) component of the total energy measured at the downhole geophones.
- the geophones measure primarily the compressional component of the arriving seismic energy, and it is believed that typically little or no effort is made to separate the shear component contributions and thereby improve the results of processes based on compressional wave considerations.
- the Hardage document cited earlier proposes, e.g. at page 413, that with a 3-component tool the responses of the triaxial geophone system can be mathematically rotated so that they represent the output of a single geophone oriented along the ray path of the compressional wave first arrival at each recording level, and that data can be derived which represent the response that a geophone would record if it were positioned in a vertical plane containing the compressional wave first arrival ray path and then oriented in this plane so that it is normal to the compressional wave ray path, and that these data thus would contain the full response of those downgoing shear velocity modes which travel along the same ray path as the compressional wave direct arrival, partial responses of SV modes which arrive at the triaxial geophone arrangement along ray paths that differ from the compressional wave ray path, and partial responses of later arriving downgoing or upgoing compressional wave events whose
- the same document proposes at pages 524-527 a technique which involves considering the first compressional (P) ray as included in the source-well plane, deriving a projection along the first arriving P ray, which should give mainly the first arriving P ray and following multiples, deriving a projection which is normal to that first arriving P ray and is in the source-well plane, which should give direct and converted shear SV waves, and deriving a projection normal to the source-well plane, which should give shear SH waves.
- P first compressional
- the invention makes use of the unexpected discovery that, if certain assumptions are made about the properties of the geological formation and the wavefield, and some knowledge available from other logs is used, it is possible to relate the compressional wave component to the total measured wave vector through an analytical expression which can be sufficiently accurate to give useful results.
- the assumptions believed most important are that the subsurface formation is locally homogeneous (over intervals of at least about 3 wavelengths) in the region of measurements, and that the elastic wavefield is approximately constant in the direction normal to the plane containing the source and the borehole.
- the knowledge derived from other logs e.g., sonic is the local compressional and shear velocities.
- the main steps of a process in accordance with the invention is to decompose the 3-component measurements into local plane wave components, to identify the P waves and S waves of each plane wave component by their polarization and to separately recombine the so-identified P and S waves.
- the sought compressional component is related to the total measured wavefield vector through a transfer function (filter) in matrix form which depends on local acoustic properties of the formation, and hence typically changes with borehole depths. These local properties are measured or deduced beforehand, for example by compressional and shear sonic well logging. As a specific example, the variations of compressional velocity and shear velocity with borehole depth are measured, e.g. by compressional wave source and by shear wave source sonic logging, and the results are used to produce a 2-dimensional matrix filter. Vertical seismic profiling is then used to measure the vector wavefield for each depth level of interest, e.g. with a 3-component tool. After any preliminary processing (e.g.
- a subset made up of measurements within a given window in borehole depth and in time is forward Fourier transformed, for example by a commercially available FFT processor, to convert it to measurements in a corresponding window in wavenumber-frequency space.
- the resulting subset of converted measurements is then combined, for example in a dot product operation, with the transfer function (filter) for the borehole depth interval in that window.
- the result is subjected to inverse Fourier transformation, for example again by means of a commercially available FFT processor, to thereby derive a vector quantity representative of the compressional wave vector at the given borehole depth.
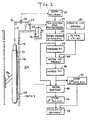
- a VSP tool 10 is lowered on an armored multiconductor cable 12 into a borehole 14 to take VSP measurements of subsurface formations 16a.
- Tool 10 is adapted for movement up and down borehole 14 and includes pivoted, power-driven clamping arm arrangement 10a, geophone pad 10b, another pad 10c and various internal subsystems. Tools of this type are discussed in the documents incorporated by reference, and a particular tool suitable for the purpose is used by Schlumberger Limited, the parent company of the assignee of this invention.
- the geophones in pad 10b are clamped against the wall of borehole 14 at borehole depth level z by means of arm 10a, and measure seismic energy originating at a seismic source 16. These measurements are digitized by circuitry (not shown) in tool 10, and the result is sent up via conductors within armored cable 12. Cable 12 goes to a sheave wheel 18 at the surface and then to a suitable drum and winch mechanism 20 which raises and lowers tool 10 in borehole 14 as desired. Electrical connections between tool 10 and surface equipment are made through suitable multielement slipring and brush contact assembly 22.
- a surface unit 24 contains tool control and preprocessing equipment which communicates with tool 10 via cable 12, and with seismic source 16 via another cable.
- Cable 12 also runs through a measuring wheel unit designated 26 which provides signals indicative of the current borehole depth level z of geophone pad 10b. These depth signals are recorded at unit 28 so that a given set of outputs of the geophones in pad 10b can be associated with a respective depth in the borehole.
- tool 10 In operation, tool 10, with clamping arm 10a retracted, is lowered to the bottom of borehole 14 (or to the lowest depth level of interest), arm 10a is extended to clamp pad 10b in good acoustic contact with the wall of borehole 14, and a seismic signal is generated at source 16.
- Tool 10 is then moved up along the borehole such that pad 10b can be clamped satisfactorily at another selected depth level, another seismic signal is generated at source 16 and the seismic energy arriving at the geophones in pad 10b is similarly measured and recorded in signal storage unit 30.
- the same procedure is repeated for all desired depth levels in the borehole, to thereby store in unit 30 the desired sequence of vertical seismic profiling measurements from borehole 14 in vector form.
- the VSP measurements in storage unit 30 can be used to produce a conventional VSP record on a time versus depth grid, such as illustrated in Fig. 2, where the vertical dimension is depth along the borehole, the horizontal dimension is time and the filled-in black areas indicate the amplitude of acoustic energy received by downhole geophones.
- the line designated "downgoing seismic wavelet" is made up of the measurements at successive depth levels in the borehole of seismic energy which is believed to have traveled downwardly from the seismic source to the geophones. As can be expected, the further down the geophones are, the more time it takes for the seismic signal to reach them.
- the line labeled "upgoing reflection” slopes in the opposite direction and is assumed to be the result of acoustic energy which has traveled down to a reflector at the bottom of the measured borehole depth interval, has been reflected thereby and has reached the geophones after traveling up through the formation.
- a line labeled “downgoing multiple” suggests the measurement of energy which has traveled down to a reflector, up to another reflector, then down again to the geophones.
- the line labeled "downgoing tube waves” suggests measurements of the energy which has propagated down the borehole fluid.
- VSP measurements recorded with a triaxial geophone system can be mathematically rotated in space to emphasize selected wave modes.
- a single, elastic wave crosses an array of seismic receivers along a borehole in a homogeneous, isotropic medium, then the particles at the borehole will vibrate in the direction of travel of the wave if it is a P wave and in a direction normal to that direction if it is an S wave.
- S wave normal to that direction if it is an S wave.
- a 3-component tool all that would have to be done in such a case is to determine the wave's direction of travel and compare it with the direction of measured particle motion.
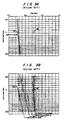
- Fig. 3a illustrates a record of particle velocity motion oriented (through mathematical rotation of the 3-component data) along the raypath associated with the compressional wave first arrival.
- particle motion is associated with downgoing compressional wave first arrivals and downgoing compressional waves multiples generated in the shallow part of the stratigraphic section.
- FIG. 3b illustrates particle motion normal to the compressional wave raypath and lying in the vertical plane containing the compressional wave raypath, so as to emphasize downgoing shear velocity events.
- mathematical rotation of the type illustrated in Figs. 3a and 3b may not reliably separate compressional and shear events. It is also believed that in such cases those events may not be separated reliably by the earlier mentioned technique discussed, e.g., at pages 177-182 of the Hardage document.
- each of the compressional and shear components can be satisfactorily related analytically to the wavefield measured in the borehole 3- dimensionally (or at least in the two dimensions of the source-borehole plane, more precisely, the plane defined by the source and the borehole axis).
- K is the wavenumber and omega is frequency
- Vp compressional velocity in the region from which the u measurements being processed were derived
- V is the shear velocity in the same region.
- the filter J is a representation of the means used to decompose the total measured vector wavefield into its local plane-wave components. Operating in the Fourier transform space of expression (1a), it helps identify plane compressional waves and the shear waves can then be determined, as expression (1b) shows, by subtracting the compressional component from the total field. As the filter depends on the local compressional and shear velocities in the subsurface region where the separation is performed at the time, the process, although linear, is not space-invariant. To process the typical complete seismic profile, it is necessary to process separately each substantially homogeneous zone, with the filter J varying from zone to zone.
- unit 32 performs a forward fast Fourier transform on the vector measurements for several contiguous depth levels in the borehole.
- the initial subset processed in unit 32 can be made up of the fifth depth level from the bottom up and the four levels below and four levels above, the next subset can be made up of the sixth depth level from the bottom up and the four below and four above it, etc.
- unit 38 which performs a vector dot product operation by using a filter J(K,w) derived at unit 36 (in accordance with the relationship discussed above) from an acoustic log of borehole 12 stored in unit 34.
- Unit 40 then performs a two-dimensional inverse fast Fourier transformation of the dot product from unit 34, to thereby derive the compressional wave component of the vector measurement at the central depth level for the subset being processed, and stores it in unit 42.
- Unit 44 then subtracts this compressional component from the total vector measurement for the current depth level being processed (the central level of the current subset), to thereby derive the shear component for the depth level of interest, and stores it in unit 46.
- the operations performed by units 32, 38, 40, 42, 44 and 46 are then repeated for successive subsets by stepping up the interval of interest one depth level at a time, until the borehole depth interval of interest has been so processed.
- Units 42 and 46 then store, respectively, the compressional and the shear components of the total measured vector wavefield as functions of borehole depth. These components are supplied to utilization equipment 48, which can comprise equipment producing records of the type illustrated in Figs. 3a and 3b, and/or other equipment for processing the estimates of compressional and shear components stored in units 42 and 46.
- step 40 illustrates the derivation and storage of the total wave measurements for the borehole depth interval of interest.
- the elastic wave source of the seismic wave and the borehole axis are in the same plane, and axis x is also in the same plane.
- Each total wave measurement is taken at a given depth level in the borehole, and the geophone array produces a vector set having components in each of the three directions illustrated in Figure 5. Two of these directions may but need not coincide with the x and z direction in the borehole-source plane.
- a vector set of measurements is taken at each of a number of borehole depths, typically spaced from each other by a distance of the order of meters or tens of meters, from a bottom depth at z, to a top depth of z N .
- each of the vector sets of measurements is subjected to a coordinate rotation to find its component along the x axis and its component along the z axis illustrated in Figure 5. The component in the direction perpendicular to the plane of Figure 5 is not used in the remainder of the process, and need not be found.
- the depth index z is set at a starting level which is N depth levels up from the lowermost measurement in the borehole; and at step 46 a subset of rotated measurements is selected which is centered at the depth level z selected at step 44 and includes N measurement sets above and N measurement sets below the depth level z.
- the relevant subset of measurements Ux is illustrated as a total of nine traces centered at depth level z and varying in time as illustrated.
- the subset of measurements for the energy along the Z axis can be illustrated in the same manner.
- the process at step 48 finds the one-dimensional discrete form of the Fourier transform of the subset in a procedure described by expressions (4a) and (4b):
- the spatial domain traces within the window illustrated in the lefthand part of the figure are converted at step 48 to the Fourier domain traces illustrated within the window shown at the righthand side of the figure.
- the spatial domain traces are sampled at each of sample times j over a time interval made up of J samples, at a sampling frequency sufficient to satisfy the Nyquist requirements and over a total time interval sufficient to include the arrival of the seismic energy of interest, and the Fourier domain traces are also expressed in the form of a corresponding number of samples.
- the same symbol is used for the total number of samples in each domain, this is not necessary and the total number of samples in the Fourier domain may be less than that in the spatial domain, for example it can be 64 or 128.
- step 50 uses the quantities found in step 48 to carry out another one-dimensional Fourier transformation in discrete form as described by expressions (5a) and (5b) to complete the transformation of the spatial domain measurements into wavenumber-frequency measurements:
- the filter of interest can be derived from sonic logs of the same borehole which provide estimates of the compressional and shear velocities of the formation adjacent the borehole (although by using sonic frequencies much higher than that of the seismic source used in VSP).
- the process illustrated in Figure 4 stores the sonic logs of interest at step 52 and, if they are in a form other than directly in units of compressional and shear velocity, converts them at step 54 into such form for the borehole depth interval corresponding to that of the measurements stored at step 40.
- the compressional and shear velocity logs are zoned such that only one filter J would have to be estimated for each subsurface zone which is substantially homogeneous for the purposes of this process.
- the lefthand part illustrates the amplitude variations with depth of compressional velocity (or shear velocity), and the right hand part illustrates the same velocity log after zoning it such that it has a constant value within each borehole depth interval which can be considered homogeneous for the purposes of this process.
- a zone can be considered homogeneous if the measured velocities are within a band of some percentage, e.g., 20%, of the average, with only a small minority of reasonably well dispersed excursions outside the band.
- the result of the zoning process carried out at step 56 is used at step 58 to find, for each zone, the four matrix elements identified in expression (3), by carrying out the processes described by expressions (3a)-(3e), for each omega and K value used in the conversion into wavenumber-frequency space carried out at steps 48 and 50.
- the result of the process at step 58 is a respective value of the matrix filter for each of the zones identified in step 56.
- the subset of VSP measurements in wavenumber-frequency form and the filter for the borehole depth zone which corresponds to the depths at which the VSP measurements currently being processed were derived are used to find the compressional component of the total wavefield, by carrying out a process described in expressions (6), (7a) and (7b):
- the compressional component is a vector quantity having a component along the x direction (see Figure 5) and a component along the z direction. These two components of the compressional wave vector component are found individually through the process illustrated by expressions (7a) and (7b) but, as earlier noted, in discrete form, and are stored at step 60.
- the current median depth level of the subset being processed is incremented by one depth level, to bring it to the next point up the borehole at which VSP measurements were taken, and at step 64 a check is made to see if this has brought the depth interval defined by the subset to be processed up to the top of the borehole interval of interest. If not, the process returns to step 46 to process the new subset in the same manner. If yes, the process goes to step 66, and for each depth level for which a compressional component was found, subtracts the compressional component from the total energy component to thereby estimate the shear wave component, and thereby derive, for each such depth level, a shear vector component defined by the components in the x and z directions illustrated in Figure 5. At step 68 the compressional and/or shear vector components are stored and/or used as earlier discussed, and the process ends.
- Figures 8-11 and Table 1 illustrate applying the process described above in a setting illustrative of a subsurface model which is shown in Figure 7 and is made up of layers 1 through 12 each of which can be considered homogeneous.
- the thickness and compressional and shear wave speeds of each layer are given in Table 1 below: the blocked area along the borehole axis (in layer 4) indicates the section in which P wave separation was performed in accordance with the process described above.
- Figure 9 illustrates in its top half the z component of the total wavefield along the borehole axis, where the borehole axis is vertical and the time axis is horizontal.
- the top trace is from a depth of 30 meters in the borehole, and spacing between traces is 20 meters.
- the vertical time lines are at 0.1 second intervals.
- the bottom half of Figure 9 shows the x component of the total wavefield along borehole axis on scale corresponding to the top half.
- the data shown in Figure 9 were derived by determining through a known process what the measured wavefield should be, given the formation described by the parameters in Table 1 below, and assuming that the point source of the seismic signal was located 30 meters below the free surface and 250 meters from the borehole.
- the slopes of the curves in Figure 9 can give a rough indication of whether a given arrival is compressional or shear: steep slopes are believed to generally indicate P wave arrivals and gentle slopes S wave arrivals.
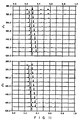
- the top and the bottom halves show, respectively, the z and x components of the total velocity field within the fourth layer (where the separation was performed), again with the vertical axis being borehole depth and the horizontal axis being time.
- Figure 11 illustrates the z and x component of the compressional wave in the fourth layer as estimated in accordance with the process described above, and indicate the removal of the gently sloping arrivals (probably shear arrivals) from the total field.
- the so separated compressional component can be used for further processing and interpretation, such as the estimation of arrival time and the separation of upgoing and downgoing waves, as well as for the other end uses earlier discussed.
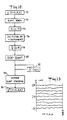
- the process again starts, at step 70, with deriving and storing the same total wave measurements discussed in connection with step 40 in Figure 4.
- these measurements are subjected to a slant stack procedure of the type discussed in Chapman, C. H., Generalized Radon Transforms and Slant Stacks, Geophys. J. R. ASTR. Soc. (1981), 66, 445 ⁇ 453, hereby incorporated by reference.
- step 74 The result of slant stacking is, for each depth level, the quantity indicated at step 74, which has a component along the x axis ( Figure 5) and a component along the z axis, described in integral form by expressions (8a) and (8b):
- Expressions (8a) is shown in discrete form in expression (9a), and a corresponding discrete form expression (not shown) is used to represent the relationship of (8b):
- Step 72 is a process described by the discrete forms of expressions (8a) and (8b), and is preferred on successive subsets of VSP measurements, in a manner similar to that discussed in connection with step 46 in Figure 4.
- the type of subset used in step 72 is illustrated in Figure 13, which shows the relevant notations (the subscripts n, m and p are indices identifying trace samples which, for the window of interest, total, respectively, N, M and P).
- a filter is applied in the spatial domain to derive and store for each subset of VSP measurements the vector set indicated in step 78.
- This vector set comprises of a component along the x axis and a component along the z axis, and is derived in accordance with the discrete form of the relationship indicated in integral form in expression (10a) and discrete form in expression (10b), it being understood that corresponding expressions describe the component along the z axis.
- the delta z and delta tau symbols refer to the inter-sample distances of the respective measures.
- the tau filter h can be, for example, the filter proposed in Shepp, L. A., et al. (1974). The Fourier Reconstruction of a Head Section, IEEE Trans. Nuclear Science NS-21(3), 2143, 96, which is hereby incorporated by reference. The results are subjected to p-filtering at step 80 to derive and store the vector sets indicated at step 82, each vector set in step 82 having x and z components described by the relationships (11 a) and (11b), where the elements D of the filter are defined by expression (12):
- step 86 The result is stored at step 86, in the form discussed earlier in connection with step 60 of Figure 4, and can be used as earlier discussed.
- the separation process can be conceptualized as treating the total wavefield arriving at a receiver location as being made up of a multiplicity of plane waves each of which propagates along its own direction in the borehole-source plane.
- one way of conceptualizing the filtering process described above is to consider it as decomposing the total local wavefield measured at a receiver location into local plane waves which are in the receiver-source plane.
- this plane is the borehole-source plane, and in the case of horizontal seismic profiling this plane includes a line of receivers and the source.
- this plane includes a reasonably straight interval of the borehole or the straight borehole defined by measurements synthesized from those taken along a deviated axis.
- the compressional and/or shear wave component of each local plane wave can be found by the polarization thereof, as the direction of propagation of each local plane wave is known from the decomposing process (the compressional component is that along the direction of propagation and the shear component is that normal to it in the plane of interest).
- the compressional component is that along the direction of propagation and the shear component is that normal to it in the plane of interest.
- the processes described above can be carried out by means of commercially available digital computer equipment which has been programmed and arranged in accordance with the teachings above to carry out the requisite steps. At least some of those steps can be carried out by dedicated equipment; for example the equipment carrying out the functions of units 32 and 40 in Figure 1 can be commercially available dedicated FFT processors. Others of the relevant process steps can also be carried out by dedicated (hardwired or firm wired processing equipment). In each case, the processing equipment when carrying out the invented processes performs as a special purpose system which derives the requisite measurements of seismic energy and the requisite filter and uses them for compressional/shear separation in accordance with the invention.
Landscapes
- Physics & Mathematics (AREA)
- Life Sciences & Earth Sciences (AREA)
- Engineering & Computer Science (AREA)
- Remote Sensing (AREA)
- Acoustics & Sound (AREA)
- Environmental & Geological Engineering (AREA)
- Geology (AREA)
- General Life Sciences & Earth Sciences (AREA)
- General Physics & Mathematics (AREA)
- Geophysics (AREA)
- Geophysics And Detection Of Objects (AREA)
Description
- The invention is in the field of seismic surveys useful in exploring for valuable subsurface resources. One aspect of the invention concerns vertical seismic profiling and more particularly separating the compressional and shear components of the vector wavefield measured in vertical seismic profiling. Another aspect concerns similar separation in surface seismics (also called horizontal profiling).
- Vertical seismic profiling, often abbreviated as VSP, is a technique in which a seismic signal generated at or near the surface of the earth is recorded by geophones secured at various depths to the wall of a borehole. Unlike the more commonly used horizontal seismic profiling, where the geophones are strung along the earth surface, vertical seismic profiling uses geophones at locations spaced along the borehole axis. These geophones typically respond to both upgoing and downgoing seismic events, in contrast to horizontal seismicprofiling, where the geophones typically cannot respond directly to downgoing events. The distance between geophone recording locations in vertical seismic profiling is typically a small fraction of that used in horizontal profiling.
- Vertical seismic profiling measurements can give insight into some fundamental properties of propagating seismic waves and assist in the structural, stratigraphic, and lithological interpretation of subsurface formations. For example, an important use of VSP measurements is to help define upgoing and downgoing seismic events within the earth and thereby help determine which events arriving at the surface are primary reflections and which are multiples. Other applications of VSP include estimation of reflector dip, correlation of shear wave reflections with compressional wave reflections, location of fault planes, determination of lithological effects on propagating wavelets, looking for reflectors ahead of the drill bit, determining hydrocarbon effects on propagating wavelets, identification of intrabed multiples, measurement of both compressional and shear wave velocities, and estimation of the conversion of compressional to shear and shear to compressional energy modes within the earth. Background information concerning VSP can be found in Hardage, B. A., Vertical Seismic Profiling, Part A: Principles, Geophysical Press, 1983, Volume 14A of Handbook of Geophysical Exploration, Section I. Seismic Exploration, Helbig and Treitel (Editors); Society of Exploration Geophysics, Expanded Abstracts of the Technical Program With Authors' Biographies, September 11-15, 1983, Las Vegas, Nevada, pp. 522-540; Wuenschel, P. C., The Vertical Array In Reflection Seismology - Some Experimental Studies, Geophysics, Volume 41, No. 2 (April 1976), pp. 219-232; and U.S. Patent No. 4,383,308.
- As discussed in greater detail in these background documents, which are hereby incorporated by reference, in principle vertical seismic profiling involves providing a seismic source at or near the earth surface and near a borehole, and providing vertical seismic profile measurements by means of geophones positioned at selected depth levels in the borehole. While it should be possible to position geophones at each desired depth in the borehole such that all can respond to the same seismic event generated by the source, it is believed typical, at least in the Western world, to use instead a geophone (or geophones) carried by a single seismic tool which is suspended by cable in the borehole and is successively clamped to the borehole wall at selected depths, to thereby respond to different wavelets from the source at different depths. Various kinds of seismic sources can be used, and typically it is desirable that the source produce a consistent and repeatable shot wavelet, particularly when a single downhole geophone tool is used. For example, the source can be a small chemical explosive shot near the bottom of a relatively shallow, cased and cemented well drilled near the borehole, or it can be one of the impulsive surface sources, such as weight droppers and devices that use explosive gases or compressed air to drive a heavy pad vertically downward with great force, or vibrators of the kind used as energy sources in hydrocarbon exploration. The borehole can be vertical or deviated, so long as the deviation is accounted for in interpreting the measurements, and can be cased or uncased. A typical downhole tool used in vertical seismic profiling typically contains at least one geophone that is sufficiently protected to withstand the adverse environment in a deep borehole and yet can achieve satisfactory acoustic coupling with the formation. Two typical configurations are a tool that has a retractable electrically operated pivot arm which can press the geophone(s) against the borehole wall at selected depth levels, and a tool with a retractable electrically driven telescoping ram serving the same purpose. The geophone transducer element or elements in a VSP tool can be either only vertically oriented or can be, for example, in a 3-component orientation (e.g., orthogonal at xyz or tilted relative to each other at some other angle, e.g., at 54°). In 3-component xyz geometry, the geophone along the z (depth) axis in a vertical borehole measures vertical particle motion, and the geophones oriented along the x and y directions measure particle motion along two orthogonal directions in the horizontal plane. Typically the three geophones are designed to exhibit closely matched amplitude and phase responses, and the device that presses the tool against the borehole wall is designed to create a geophone-to-formation bond which would result in the horizontal geophones being mechanically coupled to the formation in the same way as the vertical geophone. A 3-component tool typically also includes an orientation measuring device (typically made up of one or more magnetometers that measure azimuth from magnetic North and one or more gravity sensitive accelerometers that measure deviation from vertical), a downhole digitizing system which can digitize the geophone transducer outputs within the tool and send the digitized signals up to the surface through wires in the cable suspending the tool, and other equipment, such as devices to check the quality of acoustic coupling with the formation. Known processing equipment and techniques can be used at the surface to record the tool outputs and make preliminary corrections, such as for tool orientations, to thereby produce vector measurements which can be designated u (x=0,z,t). Each such measurement can be a digitized vector set identifying the direction in space and the magnitude of the seismic energy measured by the 3-component VSP tool at the borehole (x=0) at depth z for each sample time t over a selected time interval.
- US
patent 3 302 164 (K. H. Waters et al) describes a seismic surveying method in which a first seismic signal is generated and received to produce a pressure (compression) wave seismogram and a second seismic signal is generated and received to produce a separate shear wave seismogram. The pressure wave and the shear wave are correlated to compute the ratio between the shear wave velocity and the pressure wave velocity. - Typically the output of any given geophone contains contribution from both compressional and shear wave components (and may contain contributions from other wave components) even when the surface seismic source is designed to optimize the generation of compressional and minimize the generation of shear waves. Even if the surface source could generate a purely compressional wave, a considerable amount of compressional wave energy may still be converted into shear wave modes whenever a propagating compressional wave encounters a reflecting surface at an oblique angle of incidence. It is believed that these converted shear wave modes can be valuable for interpreting subsurface geological conditions, as can be shear modes deliberately created by shear wave energy sources. For example, converted shear wave modes can be particularly valuable seismic measurements when used in concert with compressional wave energy measurements to interpret elastic constants of rocks or to predict the types of pore fluids in rock units or to predict other subsurface lithology parameters. In addition, certain techniques can benefit from such separation because they need, or are believed to work better with, direct or indirect measurements of only the compressional, or only the shear components of the total energy arriving at downhole geophones. One example is the use of a technique similar to medical computed tomography and relying on offset VSP, or on well-to-well VSP measurements to image the zx plane of interest. Such a technique is helped by the use of data representing the separated compressional (or perhaps shear) component of the total energy measured at the downhole geophones. In surface seismics, typically it is assumed that the geophones measure primarily the compressional component of the arriving seismic energy, and it is believed that typically little or no effort is made to separate the shear component contributions and thereby improve the results of processes based on compressional wave considerations.
- For these and other reasons, proposals have been made in the past to separate the compressional and shear wave components of the seismic energy measured at a VSP geophone. For example, the Hardage document cited earlier proposes, e.g. at page 413, that with a 3-component tool the responses of the triaxial geophone system can be mathematically rotated so that they represent the output of a single geophone oriented along the ray path of the compressional wave first arrival at each recording level, and that data can be derived which represent the response that a geophone would record if it were positioned in a vertical plane containing the compressional wave first arrival ray path and then oriented in this plane so that it is normal to the compressional wave ray path, and that these data thus would contain the full response of those downgoing shear velocity modes which travel along the same ray path as the compressional wave direct arrival, partial responses of SV modes which arrive at the triaxial geophone arrangement along ray paths that differ from the compressional wave ray path, and partial responses of later arriving downgoing or upgoing compressional wave events whose ray paths intersect the geophone assembly at various angles of inclination. The earlier cited document concerning the technical program of September 11-15, 1983 in Las Vegas, Nevada proposes, e.g. at page 522, that for processing VSP data from compressional wave or shear wave sources, the apparent velocity between recording positions can be used to separate upgoing and downgoing waves, and that similarly, the P, SV and SH modes for the direct arrival in a VSP can be isolated, based on their orthogonal polarization, but reports that both techniques break down when analyzing complex wave types such as converted waves. The same document proposes at pages 524-527 a technique which involves considering the first compressional (P) ray as included in the source-well plane, deriving a projection along the first arriving P ray, which should give mainly the first arriving P ray and following multiples, deriving a projection which is normal to that first arriving P ray and is in the source-well plane, which should give direct and converted shear SV waves, and deriving a projection normal to the source-well plane, which should give shear SH waves. The Hardage document cited earlier observes, e.g. at pages 177 and 178, that when SVP measurements taken in the space-time domain are converted to the frequency-wavenumber domain, a masking function could be superimposed over the VSP data in the frequency-wavenumber domain in order to suppress events not travelling with compressional velocity, and gives a conceptual illustration at Figure 5-20 of a so-called pie slice velocity band pass masking function which would reduce the magnitudes of all energy modes except the upgoing compressional reflections. Other types of frequency-wavenumber velocity filtering are also discussed in the Hardage document, e.g. at pages 174-176.
- It is believed that said earlier separation proposals can give useful results when the subsurface environment is relatively simple, e.g., when it can be expected that compressional and direct and converted shear modes would not arrive at a given geophone location at the same time. However, in practice the typical environment is sufficiently complex to defeat such velocity or polarization separation techniques. Therefore, it is believed that a need remains for accurately and efficiently separating the compressional and shear wave components in seismic geophones, and it is this need that the invention seeks to meet.
- The invention makes use of the unexpected discovery that, if certain assumptions are made about the properties of the geological formation and the wavefield, and some knowledge available from other logs is used, it is possible to relate the compressional wave component to the total measured wave vector through an analytical expression which can be sufficiently accurate to give useful results. The assumptions believed most important are that the subsurface formation is locally homogeneous (over intervals of at least about 3 wavelengths) in the region of measurements, and that the elastic wavefield is approximately constant in the direction normal to the plane containing the source and the borehole. The knowledge derived from other logs (e.g., sonic) is the local compressional and shear velocities. In principle, the main steps of a process in accordance with the invention is to decompose the 3-component measurements into local plane wave components, to identify the P waves and S waves of each plane wave component by their polarization and to separately recombine the so-identified P and S waves.
- In a particular and nonlimiting example, the sought compressional component is related to the total measured wavefield vector through a transfer function (filter) in matrix form which depends on local acoustic properties of the formation, and hence typically changes with borehole depths. These local properties are measured or deduced beforehand, for example by compressional and shear sonic well logging. As a specific example, the variations of compressional velocity and shear velocity with borehole depth are measured, e.g. by compressional wave source and by shear wave source sonic logging, and the results are used to produce a 2-dimensional matrix filter. Vertical seismic profiling is then used to measure the vector wavefield for each depth level of interest, e.g. with a 3-component tool. After any preliminary processing (e.g. to account for tool orientation and seismic energy attenuation), a subset made up of measurements within a given window in borehole depth and in time is forward Fourier transformed, for example by a commercially available FFT processor, to convert it to measurements in a corresponding window in wavenumber-frequency space. The resulting subset of converted measurements is then combined, for example in a dot product operation, with the transfer function (filter) for the borehole depth interval in that window. The result is subjected to inverse Fourier transformation, for example again by means of a commercially available FFT processor, to thereby derive a vector quantity representative of the compressional wave vector at the given borehole depth. Vector subtraction of this compressional wave vector from the total measured vector wavefield for that depth gives a vector quantity representative of the shear wave vector component at the same given borehole depth. The procedure is repeated for other depth levels. The corresponding steps carried out entirely in the spatial domain, without excursions into wavenumber-frequency space, give corresponding results. The invented principles, while described in detail only for VSP separation, apply to surface seismics separation as well.
-
- Fig. 1 is an overall schematic illustration of a vertical seismic profiling making use of an exemplary embodiment of the invention.
- Fig. 2 illustrates a conventional record of vertical seismic profiling measurements.
- Figs. 3a and 3b illustrate certain known attempts to separate compressional and shear components.
- Fig. 4 is a flowchart describing certain steps of a process embodying an example of the invention.
- Fig. 5 is an illustration useful in explaining coordinate rotation.
- Fig. 6 is an illustration useful in explaining transformation of VSP measurements from the spatial to the wavenumber-frequency domain.
- Fig. 7 is an illustration useful in explaining zoning of sonic logs.
- Fig. 8 illustrates a layered subsurface formation model for VSP measurements.
- Fig. 9 illustrates VSP measurements which would be made in a formation such as that shown in Fig. 8: the top part of Fig. 9 shows the z component of the total wavefield and the bottom part the x component.
- Fig. 10 shows in greater detail the portion of Fig. 9 which corresponds to layer 4 in Fig. 8.
- Fig. 11 shows the compressional components of the waveforms illustrated in Fig. 10, derived in accordance with an embodiment of the invention.
- Fig. 12 illustrates steps of a process which embodies an example of the invention and is carried out entirely in the spatial domain.
- Fig. 13 shows a spatial domain window useful in explaining filtering steps illustrated in Fig. 12.
- Referring to Fig. 1 for an overall schematic illustration of a vertical seismic profiling system making use of a non-limiting example of the invention, a
VSP tool 10 is lowered on anarmored multiconductor cable 12 into a borehole 14 to take VSP measurements of subsurface formations 16a.Tool 10 is adapted for movement up and downborehole 14 and includes pivoted, power-driven clamping arm arrangement 10a, geophone pad 10b, anotherpad 10c and various internal subsystems. Tools of this type are discussed in the documents incorporated by reference, and a particular tool suitable for the purpose is used by Schlumberger Limited, the parent company of the assignee of this invention. The geophones in pad 10b are clamped against the wall ofborehole 14 at borehole depth level z by means of arm 10a, and measure seismic energy originating at aseismic source 16. These measurements are digitized by circuitry (not shown) intool 10, and the result is sent up via conductors withinarmored cable 12.Cable 12 goes to asheave wheel 18 at the surface and then to a suitable drum andwinch mechanism 20 which raises and lowerstool 10 inborehole 14 as desired. Electrical connections betweentool 10 and surface equipment are made through suitable multielement slipring andbrush contact assembly 22. Asurface unit 24 contains tool control and preprocessing equipment which communicates withtool 10 viacable 12, and withseismic source 16 via another cable.Cable 12 also runs through a measuring wheel unit designated 26 which provides signals indicative of the current borehole depth level z of geophone pad 10b. These depth signals are recorded atunit 28 so that a given set of outputs of the geophones in pad 10b can be associated with a respective depth in the borehole. - In operation,
tool 10, with clamping arm 10a retracted, is lowered to the bottom of borehole 14 (or to the lowest depth level of interest), arm 10a is extended to clamp pad 10b in good acoustic contact with the wall ofborehole 14, and a seismic signal is generated atsource 16. The acoustic energy measured by the geophones in pad 10b is digitized and sent up tounit 24 for any preprocessing, such as to account for tool orientation and seismic energy attenuation with travel time, and the resulting measurements are stored inunit 30, for example in the form of a vector set u(x=0,z,t), which stands for the vector wavefield measured for borehole depth level z at sample times t and includes a component along the borehole and a component which is perpendicular to the borehole but is in the plane which contains the measurement location and the seismic source location.Tool 10 is then moved up along the borehole such that pad 10b can be clamped satisfactorily at another selected depth level, another seismic signal is generated atsource 16 and the seismic energy arriving at the geophones in pad 10b is similarly measured and recorded insignal storage unit 30. The same procedure is repeated for all desired depth levels in the borehole, to thereby store inunit 30 the desired sequence of vertical seismic profiling measurements fromborehole 14 in vector form. - The VSP measurements in
storage unit 30 can be used to produce a conventional VSP record on a time versus depth grid, such as illustrated in Fig. 2, where the vertical dimension is depth along the borehole, the horizontal dimension is time and the filled-in black areas indicate the amplitude of acoustic energy received by downhole geophones. The line designated "downgoing seismic wavelet" is made up of the measurements at successive depth levels in the borehole of seismic energy which is believed to have traveled downwardly from the seismic source to the geophones. As can be expected, the further down the geophones are, the more time it takes for the seismic signal to reach them. The line labeled "upgoing reflection" slopes in the opposite direction and is assumed to be the result of acoustic energy which has traveled down to a reflector at the bottom of the measured borehole depth interval, has been reflected thereby and has reached the geophones after traveling up through the formation. A line labeled "downgoing multiple" suggests the measurement of energy which has traveled down to a reflector, up to another reflector, then down again to the geophones. The line labeled "downgoing tube waves" suggests measurements of the energy which has propagated down the borehole fluid. - As earlier mentioned, VSP measurements recorded with a triaxial geophone system can be mathematically rotated in space to emphasize selected wave modes. In principle, if a single, elastic wave crosses an array of seismic receivers along a borehole in a homogeneous, isotropic medium, then the particles at the borehole will vibrate in the direction of travel of the wave if it is a P wave and in a direction normal to that direction if it is an S wave. With a 3-component tool, all that would have to be done in such a case is to determine the wave's direction of travel and compare it with the direction of measured particle motion. If the P and S wave velocities in the medium are known, and if it is assumed that the wave travels in the source-borehole plane, the wave direction can be found from the arrival times of the wave at the different receivers along the borehole. As an example of a prior art approach believed based on such considerations, Fig. 3a illustrates a record of particle velocity motion oriented (through mathematical rotation of the 3-component data) along the raypath associated with the compressional wave first arrival. Such particle motion is associated with downgoing compressional wave first arrivals and downgoing compressional waves multiples generated in the shallow part of the stratigraphic section. Through similar mathematical rotation, Fig. 3b illustrates particle motion normal to the compressional wave raypath and lying in the vertical plane containing the compressional wave raypath, so as to emphasize downgoing shear velocity events. However, difficulties arise when the medium in which the receivers (geophones) lie is not sufficiently homogeneous and when several seismic waves cross the receiver array simultaneously - both of which normally occur in VSP. Thus, it is believed that in the typical complex subsurface environment, and particularly where converted compressional and shear modes are present, mathematical rotation of the type illustrated in Figs. 3a and 3b may not reliably separate compressional and shear events. It is also believed that in such cases those events may not be separated reliably by the earlier mentioned technique discussed, e.g., at pages 177-182 of the Hardage document.
- In contrast with the proposals discussed above, this invention makes use of the unexpected discovery that, given certain assumptions and certain knowledge from other sources, each of the compressional and shear components can be satisfactorily related analytically to the wavefield measured in the borehole 3- dimensionally (or at least in the two dimensions of the source-borehole plane, more precisely, the plane defined by the source and the borehole axis). A particular and nonlimiting example of separation in accordance with the invention can be described mathematically as follows. Let u(x=O,z,t)=[ux,uz]T stand for the vector wavefield measured at the borehole, with component Uz along the borehole and Ux perpendicular to the borehole but in the source-borehole plane. Then the compressional u(p) and shear u(sv) components of u can be determined approximately by the following expressions (Note that u(P) and u(sv) are also vectors, since P-waves and SV-waves induce particle motions along both the x and z axes).


- Here u(x=0,K,ω) denotes the two-fold Fourier transform of the total field, viz.,


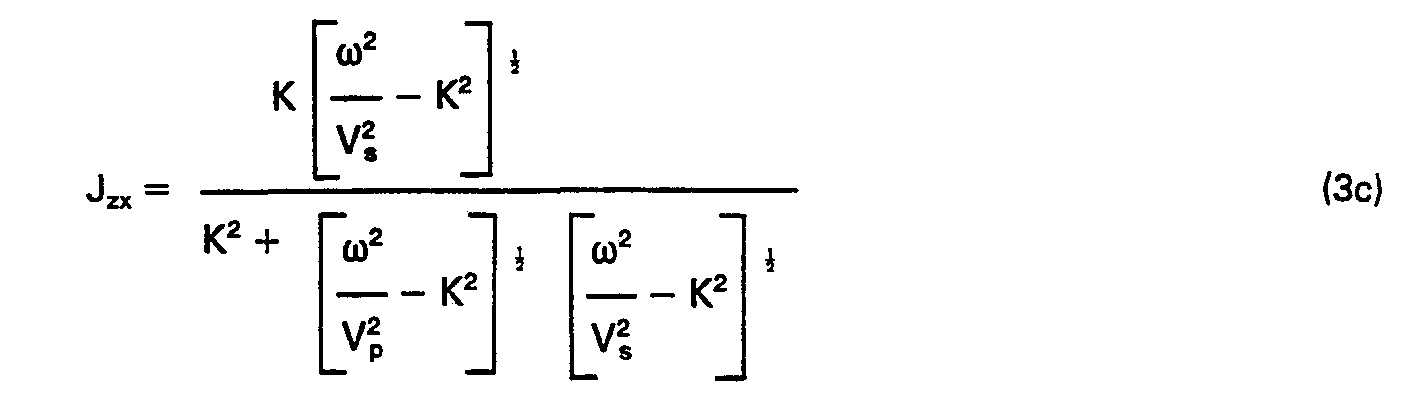


- In expressions (1a)-(3e), K is the wavenumber and omega is frequency, Vp is compressional velocity in the region from which the u measurements being processed were derived, and V is the shear velocity in the same region. These regional (or local) velocities can be estimated from, for example, sonic logs one of which uses a compressional wave source and another a shear wave source.
- The filter J is a representation of the means used to decompose the total measured vector wavefield into its local plane-wave components. Operating in the Fourier transform space of expression (1a), it helps identify plane compressional waves and the shear waves can then be determined, as expression (1b) shows, by subtracting the compressional component from the total field. As the filter depends on the local compressional and shear velocities in the subsurface region where the separation is performed at the time, the process, although linear, is not space-invariant. To process the typical complete seismic profile, it is necessary to process separately each substantially homogeneous zone, with the filter J varying from zone to zone.
- Referring again to Fig. 1, for an overview of the process of separating the compressional and shear components in accordance with the relationships discussed above,
unit 32 performs a forward fast Fourier transform on the vector measurements for several contiguous depth levels in the borehole. For example, the initial subset processed inunit 32 can be made up of the fifth depth level from the bottom up and the four levels below and four levels above, the next subset can be made up of the sixth depth level from the bottom up and the four below and four above it, etc. The result of processing one such subset byunit 32, for example the subset centered at the fifth depth level from the bottom up, is supplied to unit 38 which performs a vector dot product operation by using a filter J(K,w) derived at unit 36 (in accordance with the relationship discussed above) from an acoustic log ofborehole 12 stored in unit 34.Unit 40 then performs a two-dimensional inverse fast Fourier transformation of the dot product from unit 34, to thereby derive the compressional wave component of the vector measurement at the central depth level for the subset being processed, and stores it inunit 42.Unit 44 then subtracts this compressional component from the total vector measurement for the current depth level being processed (the central level of the current subset), to thereby derive the shear component for the depth level of interest, and stores it inunit 46. The operations performed byunits Units utilization equipment 48, which can comprise equipment producing records of the type illustrated in Figs. 3a and 3b, and/or other equipment for processing the estimates of compressional and shear components stored inunits - In practice, the principles discussed above can be implemented in a process the major steps of which are illustrated in Figure 4, where
step 40 illustrates the derivation and storage of the total wave measurements for the borehole depth interval of interest. Referring to Figure 5 for an illustration, the elastic wave source of the seismic wave and the borehole axis are in the same plane, and axis x is also in the same plane. Each total wave measurement is taken at a given depth level in the borehole, and the geophone array produces a vector set having components in each of the three directions illustrated in Figure 5. Two of these directions may but need not coincide with the x and z direction in the borehole-source plane. A vector set of measurements is taken at each of a number of borehole depths, typically spaced from each other by a distance of the order of meters or tens of meters, from a bottom depth at z, to a top depth of zN. Returning to Figure 4, atstep 42 each of the vector sets of measurements is subjected to a coordinate rotation to find its component along the x axis and its component along the z axis illustrated in Figure 5. The component in the direction perpendicular to the plane of Figure 5 is not used in the remainder of the process, and need not be found. Atstep 44 the depth index z is set at a starting level which is N depth levels up from the lowermost measurement in the borehole; and at step 46 a subset of rotated measurements is selected which is centered at the depth level z selected atstep 44 and includes N measurement sets above and N measurement sets below the depth level z. Referring to the lefthand portion of Figure 6 for an illustration, the relevant subset of measurements Ux is illustrated as a total of nine traces centered at depth level z and varying in time as illustrated. The subset of measurements for the energy along the Z axis can be illustrated in the same manner. - In order to convert the subset identified at
step 46 to measurements in wavenumber-frequency space, the process atstep 48 finds the one-dimensional discrete form of the Fourier transform of the subset in a procedure described by expressions (4a) and (4b):

- Referring to Figure 6 for an illustration, the spatial domain traces within the window illustrated in the lefthand part of the figure are converted at
step 48 to the Fourier domain traces illustrated within the window shown at the righthand side of the figure. In view of the discrete nature of the transformation process, the spatial domain traces are sampled at each of sample times j over a time interval made up of J samples, at a sampling frequency sufficient to satisfy the Nyquist requirements and over a total time interval sufficient to include the arrival of the seismic energy of interest, and the Fourier domain traces are also expressed in the form of a corresponding number of samples. Although the same symbol is used for the total number of samples in each domain, this is not necessary and the total number of samples in the Fourier domain may be less than that in the spatial domain, for example it can be 64 or 128. - Returning to Figure 4, at
step 50 the process uses the quantities found instep 48 to carry out another one-dimensional Fourier transformation in discrete form as described by expressions (5a) and (5b) to complete the transformation of the spatial domain measurements into wavenumber-frequency measurements:

- At this time the process is ready to make use of the previously discussed filter.
- The filter of interest can be derived from sonic logs of the same borehole which provide estimates of the compressional and shear velocities of the formation adjacent the borehole (although by using sonic frequencies much higher than that of the seismic source used in VSP). To this end the process illustrated in Figure 4 stores the sonic logs of interest at
step 52 and, if they are in a form other than directly in units of compressional and shear velocity, converts them atstep 54 into such form for the borehole depth interval corresponding to that of the measurements stored atstep 40. Atstep 56 the compressional and shear velocity logs are zoned such that only one filter J would have to be estimated for each subsurface zone which is substantially homogeneous for the purposes of this process. Referring to Figure 7 for an illustration, the lefthand part illustrates the amplitude variations with depth of compressional velocity (or shear velocity), and the right hand part illustrates the same velocity log after zoning it such that it has a constant value within each borehole depth interval which can be considered homogeneous for the purposes of this process. As one non-limiting example, a zone can be considered homogeneous if the measured velocities are within a band of some percentage, e.g., 20%, of the average, with only a small minority of reasonably well dispersed excursions outside the band. - The result of the zoning process carried out at
step 56 is used at step 58 to find, for each zone, the four matrix elements identified in expression (3), by carrying out the processes described by expressions (3a)-(3e), for each omega and K value used in the conversion into wavenumber-frequency space carried out atsteps step 56. - At
step 60, the subset of VSP measurements in wavenumber-frequency form and the filter for the borehole depth zone which corresponds to the depths at which the VSP measurements currently being processed were derived, are used to find the compressional component of the total wavefield, by carrying out a process described in expressions (6), (7a) and (7b):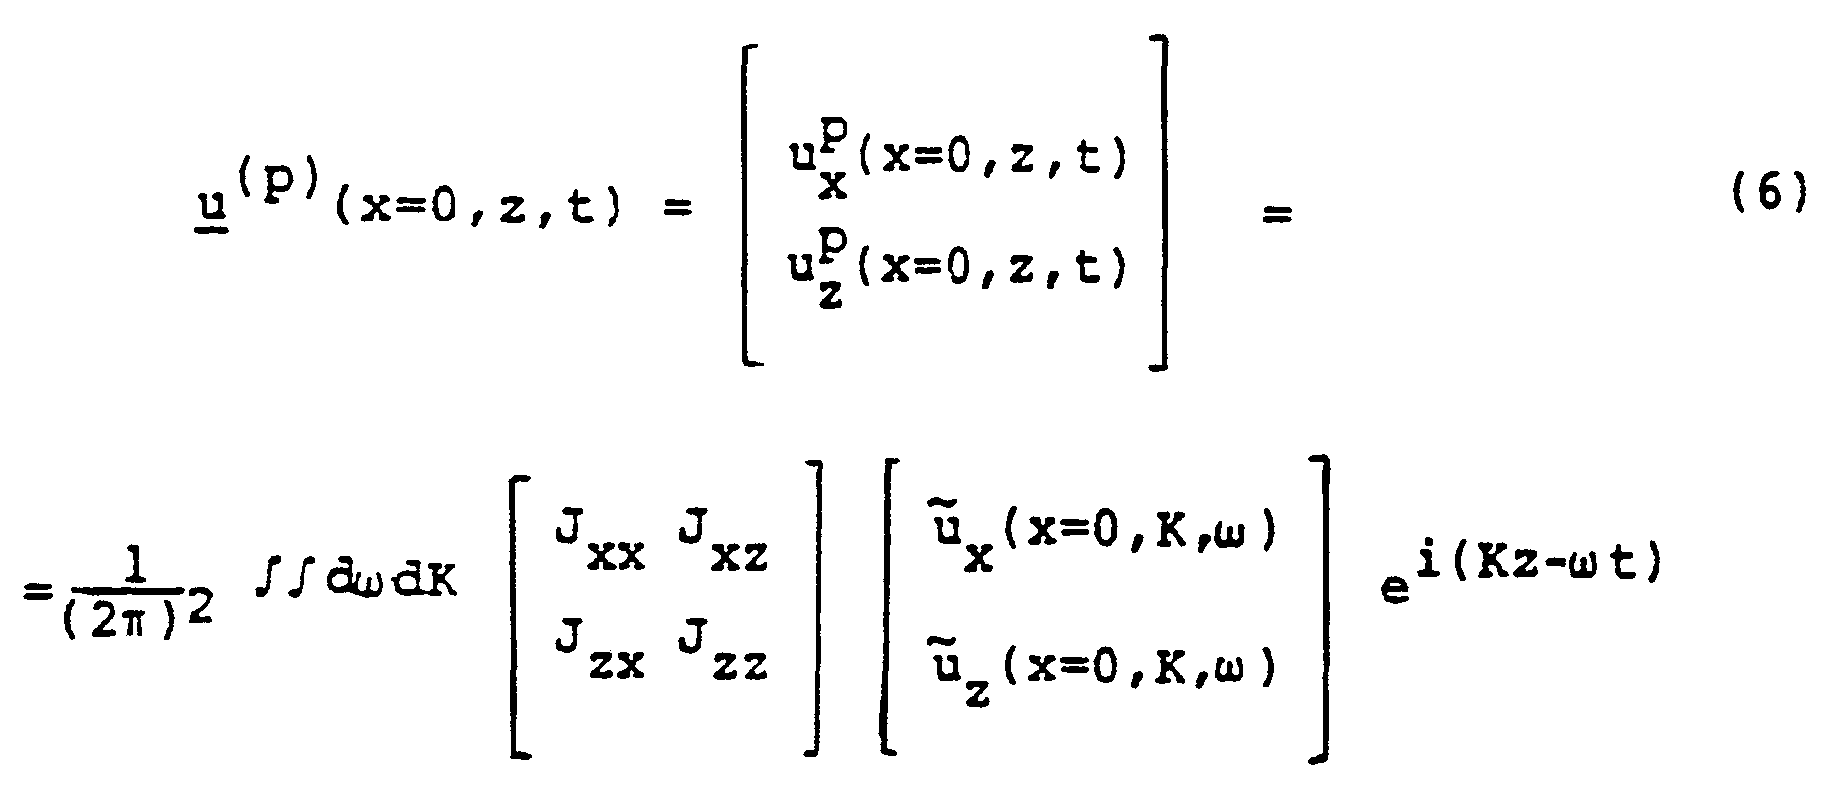


- These expressions are in integral form, for simplicity of illustration, but it should be clear that in practice they are carried out in discrete form in the same manner as discussed in connection with expressions (4a)-(5b). As indicated by expression (6), the compressional component is a vector quantity having a component along the x direction (see Figure 5) and a component along the z direction. These two components of the compressional wave vector component are found individually through the process illustrated by expressions (7a) and (7b) but, as earlier noted, in discrete form, and are stored at
step 60. Atstep 62 the current median depth level of the subset being processed is incremented by one depth level, to bring it to the next point up the borehole at which VSP measurements were taken, and at step 64 a check is made to see if this has brought the depth interval defined by the subset to be processed up to the top of the borehole interval of interest. If not, the process returns to step 46 to process the new subset in the same manner. If yes, the process goes to step 66, and for each depth level for which a compressional component was found, subtracts the compressional component from the total energy component to thereby estimate the shear wave component, and thereby derive, for each such depth level, a shear vector component defined by the components in the x and z directions illustrated in Figure 5. At step 68 the compressional and/or shear vector components are stored and/or used as earlier discussed, and the process ends. - Figures 8-11 and Table 1 illustrate applying the process described above in a setting illustrative of a subsurface model which is shown in Figure 7 and is made up of
layers 1 through 12 each of which can be considered homogeneous. The thickness and compressional and shear wave speeds of each layer are given in Table 1 below: the blocked area along the borehole axis (in layer 4) indicates the section in which P wave separation was performed in accordance with the process described above. Figure 9 illustrates in its top half the z component of the total wavefield along the borehole axis, where the borehole axis is vertical and the time axis is horizontal. The top trace is from a depth of 30 meters in the borehole, and spacing between traces is 20 meters. The vertical time lines are at 0.1 second intervals. The bottom half of Figure 9 shows the x component of the total wavefield along borehole axis on scale corresponding to the top half. The data shown in Figure 9 were derived by determining through a known process what the measured wavefield should be, given the formation described by the parameters in Table 1 below, and assuming that the point source of the seismic signal was located 30 meters below the free surface and 250 meters from the borehole. -

- The slopes of the curves in Figure 9 can give a rough indication of whether a given arrival is compressional or shear: steep slopes are believed to generally indicate P wave arrivals and gentle slopes S wave arrivals.
- Referring to Figure 10, the top and the bottom halves show, respectively, the z and x components of the total velocity field within the fourth layer (where the separation was performed), again with the vertical axis being borehole depth and the horizontal axis being time.
- Figure 11 illustrates the z and x component of the compressional wave in the fourth layer as estimated in accordance with the process described above, and indicate the removal of the gently sloping arrivals (probably shear arrivals) from the total field. The so separated compressional component can be used for further processing and interpretation, such as the estimation of arrival time and the separation of upgoing and downgoing waves, as well as for the other end uses earlier discussed.
- While the process has been described above as using certain steps performed in wavenumber-frequency space, the corresponding process can also be carried out strictly in the spatial domain. Referring to Figure 12 for a brief illustration, the process again starts, at step 70, with deriving and storing the same total wave measurements discussed in connection with
step 40 in Figure 4. Atstep 72 in Figure 12 these measurements are subjected to a slant stack procedure of the type discussed in Chapman, C. H., Generalized Radon Transforms and Slant Stacks, Geophys. J. R. ASTR. Soc. (1981), 66, 445―453, hereby incorporated by reference. The result of slant stacking is, for each depth level, the quantity indicated atstep 74, which has a component along the x axis (Figure 5) and a component along the z axis, described in integral form by expressions (8a) and (8b):

- Expressions (8a) is shown in discrete form in expression (9a), and a corresponding discrete form expression (not shown) is used to represent the relationship of (8b):

-
Step 72 is a process described by the discrete forms of expressions (8a) and (8b), and is preferred on successive subsets of VSP measurements, in a manner similar to that discussed in connection withstep 46 in Figure 4. The type of subset used instep 72 is illustrated in Figure 13, which shows the relevant notations (the subscripts n, m and p are indices identifying trace samples which, for the window of interest, total, respectively, N, M and P). Atstep 76 in Figure 12, a filter is applied in the spatial domain to derive and store for each subset of VSP measurements the vector set indicated in step 78. This vector set comprises of a component along the x axis and a component along the z axis, and is derived in accordance with the discrete form of the relationship indicated in integral form in expression (10a) and discrete form in expression (10b), it being understood that corresponding expressions describe the component along the z axis. - In expressions (9a) and (10b) the delta z and delta tau symbols refer to the inter-sample distances of the respective measures. In expressions (10a) and (10b) the tau filter h can be, for example, the filter proposed in Shepp, L. A., et al. (1974). The Fourier Reconstruction of a Head Section, IEEE Trans. Nuclear Science NS-21(3), 2143, 96, which is hereby incorporated by reference. The results are subjected to p-filtering at step 80 to derive and store the vector sets indicated at
step 82, each vector set instep 82 having x and z components described by the relationships (11 a) and (11b), where the elements D of the filter are defined by expression (12):


- The result is subjected to inverse slant stacking using a procedure of the type described in said Chapman publication, for example in accordance with the relationships described in integral form in expression (13a) and discrete form in expression (13b):


- The result is stored at
step 86, in the form discussed earlier in connection withstep 60 of Figure 4, and can be used as earlier discussed. - It will be appreciated from the description above that the separation process can be conceptualized as treating the total wavefield arriving at a receiver location as being made up of a multiplicity of plane waves each of which propagates along its own direction in the borehole-source plane. Thus, one way of conceptualizing the filtering process described above is to consider it as decomposing the total local wavefield mesured at a receiver location into local plane waves which are in the receiver-source plane. In the case of VSP, this plane is the borehole-source plane, and in the case of horizontal seismic profiling this plane includes a line of receivers and the source. In the case of a deviated borehole, this plane includes a reasonably straight interval of the borehole or the straight borehole defined by measurements synthesized from those taken along a deviated axis. Once the total local wavefield has been decomposed into such plane waves, the compressional and/or shear wave component of each local plane wave can be found by the polarization thereof, as the direction of propagation of each local plane wave is known from the decomposing process (the compressional component is that along the direction of propagation and the shear component is that normal to it in the plane of interest). Separately recombining the local plane waves' compressional or shear components gives the separated compressional and/or shear component of the total wavefield.
- As will be appreciated by those skilled in the art, the processes described above can be carried out by means of commercially available digital computer equipment which has been programmed and arranged in accordance with the teachings above to carry out the requisite steps. At least some of those steps can be carried out by dedicated equipment; for example the equipment carrying out the functions of
units
Claims (15)
Applications Claiming Priority (2)
| Application Number | Priority Date | Filing Date | Title |
|---|---|---|---|
| US06/567,359 US4648039A (en) | 1983-12-30 | 1983-12-30 | Compressional/shear wave separation in vertical seismic profiling |
| US567359 | 1983-12-30 |
Publications (3)
| Publication Number | Publication Date |
|---|---|
| EP0148076A2 EP0148076A2 (en) | 1985-07-10 |
| EP0148076A3 EP0148076A3 (en) | 1987-04-15 |
| EP0148076B1 true EP0148076B1 (en) | 1991-01-16 |
Family
ID=24266824
Family Applications (1)
| Application Number | Title | Priority Date | Filing Date |
|---|---|---|---|
| EP84402671A Expired EP0148076B1 (en) | 1983-12-30 | 1984-12-20 | Compressional/shear wave separation in seismic profiling |
Country Status (4)
| Country | Link |
|---|---|
| US (1) | US4648039A (en) |
| EP (1) | EP0148076B1 (en) |
| DE (1) | DE3483960D1 (en) |
| EG (1) | EG17014A (en) |
Families Citing this family (42)
| Publication number | Priority date | Publication date | Assignee | Title |
|---|---|---|---|---|
| US4870580A (en) * | 1983-12-30 | 1989-09-26 | Schlumberger Technology Corporation | Compressional/shear wave separation in vertical seismic profiling |
| US4706224A (en) * | 1986-02-21 | 1987-11-10 | Amoco Corporation | Method of vertical seismic profiling and exploration |
| US4751688A (en) * | 1986-03-18 | 1988-06-14 | Chevron Research Company | Downhole electromagnetic seismic source |
| FR2599508B1 (en) * | 1986-06-03 | 1989-08-04 | Geophysique Cie Gle | METHOD FOR MEASURING THE ANISOTROPY OF PROPAGATION OR REFLECTION OF A TRANSVERSE WAVE, IN PARTICULAR A METHOD OF GEOPHYSICAL PROSPECTION BY MEASURING THE ANISOTROPY OF PROPAGATION OR REFLECTION OF SHEAR WAVE IN ROCKS |
| US4779238A (en) * | 1987-04-13 | 1988-10-18 | Conoco Inc. | Method for fast slant stack of seismic data |
| US4809239A (en) * | 1987-07-14 | 1989-02-28 | Schlumberger Technology Corporation | Method for evaluating parameters related to the elastic properties of subsurface earth formations |
| US4800981A (en) * | 1987-09-11 | 1989-01-31 | Gyrodata, Inc. | Stabilized reference geophone system for use in downhole environment |
| US4819214A (en) * | 1987-10-29 | 1989-04-04 | Amoco Corporation | Sonic logging system |
| NO880685L (en) * | 1988-02-16 | 1989-12-15 | Read Well Services A S | PROCEDURES FOR VERTICAL SEISMIC PROFILING MEASUREMENT Borehole. |
| US5214613A (en) * | 1991-03-12 | 1993-05-25 | Schlumberger Technology Corporation | Method and apparatus for determining properties of anisotropicelastic media |
| US5774419A (en) * | 1996-06-18 | 1998-06-30 | Gas Research Institute | High speed point derivative microseismic detector |
| US5719822A (en) * | 1996-10-04 | 1998-02-17 | Vector Seismic Data Processing, Inc. | Seismic data radon dip moveout method |
| US5808963A (en) * | 1997-01-29 | 1998-09-15 | Schlumberger Technology Corporation | Dipole shear anisotropy logging |
| US5886255A (en) * | 1997-10-14 | 1999-03-23 | Western Atlas International, Inc. | Method and apparatus for monitoring mineral production |
| CA2397891C (en) * | 2000-01-21 | 2009-03-17 | Schlumberger Canada Limited | System and method for seismic wavefield separation |
| US6842400B2 (en) * | 2001-12-18 | 2005-01-11 | Halliburton Energy Services, Inc. | Acoustic logging apparatus and method |
| US6772067B2 (en) * | 2001-12-19 | 2004-08-03 | Halliburton Energy Services, Inc | Acoustic logging apparatus and method for anisotropic earth formations |
| CN1643402A (en) * | 2002-03-27 | 2005-07-20 | 维斯特恩格科有限责任公司 | Parametric FK techniques for seismic applications |
| US6748330B2 (en) * | 2002-04-10 | 2004-06-08 | Schlumberger Technology Corporation | Method and apparatus for anisotropic vector plane wave decomposition for 3D vertical seismic profile data |
| UA72581C2 (en) * | 2002-08-30 | 2005-03-15 | Method for investigating oil-and-gas deposits by seismic waves | |
| US20060081412A1 (en) * | 2004-03-16 | 2006-04-20 | Pinnacle Technologies, Inc. | System and method for combined microseismic and tiltmeter analysis |
| EP1738200A4 (en) * | 2004-04-21 | 2009-04-15 | Halliburton Energy Serv Inc | Microseismic fracture mapping using seismic source timing measurements for velocity calibration |
| CN101246218B (en) * | 2007-02-15 | 2010-06-02 | 中国石油化工股份有限公司 | A Three-Component VSP Wavefield Separation Method |
| US20090168600A1 (en) * | 2007-12-26 | 2009-07-02 | Ian Moore | Separating seismic signals produced by interfering seismic sources |
| CA2715335C (en) * | 2008-03-28 | 2017-02-14 | Exxonmobil Upstream Research Company | Method for performing constrained polarization filtering |
| US7916576B2 (en) * | 2008-07-16 | 2011-03-29 | Westerngeco L.L.C. | Optimizing a seismic survey for source separation |
| US8547795B2 (en) * | 2008-10-16 | 2013-10-01 | Schlumberger Technology Corporation | VSP imaging of acoustic interfaces |
| US8395966B2 (en) * | 2009-04-24 | 2013-03-12 | Westerngeco L.L.C. | Separating seismic signals produced by interfering seismic sources |
| US9291733B2 (en) * | 2011-01-31 | 2016-03-22 | Cggveritas Services Sa | Device and method for determining S-wave attenuation in near-surface condition |
| WO2014018959A1 (en) * | 2012-07-27 | 2014-01-30 | US Seismic Systems, Inc. | Remotely actuated clamping devices for borehole seismic sensing systems and methods of operating the same |
| US20140126325A1 (en) * | 2012-11-02 | 2014-05-08 | Silixa Ltd. | Enhanced seismic surveying |
| US9470805B2 (en) * | 2012-12-21 | 2016-10-18 | Cgg Services Sa | Volumetric and non-volumetric sources-based seismic survey and method |
| CN103412325B (en) * | 2013-07-29 | 2015-11-18 | 中国石油天然气集团公司 | The method of the wave field separation of a kind of earthquake P-wave And S and denoising |
| US9753166B2 (en) * | 2014-05-20 | 2017-09-05 | Cgg Services Sas | P-wave and S-wave separation of seismic data in the presence of statics and irregular geometry |
| US10564304B2 (en) | 2017-05-11 | 2020-02-18 | Saudi Arabian Oil Company | Processing methodology for full-waveform sonic wavefield separation |
| US11353612B2 (en) | 2019-03-11 | 2022-06-07 | Saudi Arabian Oil Company | Nonstationary maximum likelihood method to estimate dispersion spectra for full waveform sonic logging |
| CN112051609B (en) * | 2020-08-21 | 2023-01-06 | 成都理工大学 | Seismic wave imaging method, system, storage medium, computer program, terminal |
| CN111999766B (en) * | 2020-08-27 | 2023-03-10 | 中国科学院深圳先进技术研究院 | Multi-wave-type wave field separation method and reflection and transmission coefficient acquisition method |
| CN114442176A (en) * | 2020-11-04 | 2022-05-06 | 中国石油天然气集团有限公司 | Shear-wave velocity microseismic logging system and method |
| CN112987088B (en) * | 2021-02-22 | 2023-04-18 | 成都理工大学 | Seepage medium seismic transverse wave numerical simulation and imaging method |
| CN116990861B (en) * | 2023-07-04 | 2026-05-08 | 中海油田服务股份有限公司 | Converted wave multiple prediction method and related devices |
| CN117908130A (en) * | 2024-02-05 | 2024-04-19 | 吉林大学 | Reconstruction method of high-precision virtual source inter-well multi-wave data |
Family Cites Families (16)
| Publication number | Priority date | Publication date | Assignee | Title |
|---|---|---|---|---|
| US3011582A (en) * | 1955-07-05 | 1961-12-05 | United Geophysical Corp | Well logging system |
| US3302164A (en) * | 1963-12-12 | 1967-01-31 | Continental Oil Co | Method and apparatus for geophysical prospecting which utilizes both reflected shearand pressure waves |
| US3858168A (en) * | 1972-09-13 | 1974-12-31 | Petty Ray Geophysical Inc | Method of filtering multi-component seismic data |
| US4218765A (en) * | 1974-10-03 | 1980-08-19 | Standard Oil Company (Indiana) | Two-dimensional frequency domain filtering |
| US4316267A (en) * | 1977-01-03 | 1982-02-16 | Chevron Research Company | Method for interpreting events of seismic records to yield indications of gaseous hydrocarbons |
| US4316268A (en) * | 1977-01-03 | 1982-02-16 | Chevron Research Company | Method for interpretation of seismic records to yield indication of gaseous hydrocarbons |
| US4397005A (en) * | 1978-05-25 | 1983-08-02 | Chevron Research Company | Exploration system for enhancing the likelihood of the discovery of deposits of ore, marker rock and/or economic minerals |
| US4528649A (en) * | 1978-05-25 | 1985-07-09 | Chevron Research Company | Exploration system for discovering deposits of ore, marker rock and/or economic minerals |
| US4393488A (en) * | 1978-10-08 | 1983-07-12 | Chevron Research Company | Exploration system and method of determining elastic parameters and subsurface shape of an earth formation so as to indicate likelihood of the formation being an ore, marker rock, economic mineral or the like |
| US4344158A (en) * | 1979-04-27 | 1982-08-10 | Western Geophysical Co. Of America | Noise-suppression method |
| FR2494450A1 (en) * | 1980-11-14 | 1982-05-21 | Schlumberger Prospection | SEISMIC EXPLORATION METHOD BY THE TECHNIQUE OF THE VERTICAL SEISMIC PROFILE AND INSTALLATION FOR ITS IMPLEMENTATION |
| US4383308A (en) * | 1980-12-29 | 1983-05-10 | Mobil Oil Corporation | Acoustic well logging device for detecting shear and compressional waves |
| US4422165A (en) * | 1981-02-11 | 1983-12-20 | Mobil Oil Corporation | Maximum likelihood estimation of the ratio of the velocities of compressional and shear waves |
| US4534019A (en) * | 1981-12-29 | 1985-08-06 | Mobil Oil Corporation | Common-depth-point method for determining and displaying the shear-velocity reflectivities of a geologic formation |
| US4513376A (en) * | 1982-01-12 | 1985-04-23 | Schlumberger Technology Corporation | Phasor processing of induction logs including skin effect correction |
| US4532618A (en) * | 1982-05-20 | 1985-07-30 | Marathon Oil Company | System for and method of processing a seismic signal |
-
1983
- 1983-12-30 US US06/567,359 patent/US4648039A/en not_active Expired - Lifetime
-
1984
- 1984-12-20 EP EP84402671A patent/EP0148076B1/en not_active Expired
- 1984-12-20 DE DE8484402671T patent/DE3483960D1/en not_active Expired - Lifetime
- 1984-12-29 EG EG822/84A patent/EG17014A/en active
Also Published As
| Publication number | Publication date |
|---|---|
| EG17014A (en) | 1990-06-30 |
| EP0148076A3 (en) | 1987-04-15 |
| EP0148076A2 (en) | 1985-07-10 |
| DE3483960D1 (en) | 1991-02-21 |
| US4648039A (en) | 1987-03-03 |
Similar Documents
| Publication | Publication Date | Title |
|---|---|---|
| US4648039A (en) | Compressional/shear wave separation in vertical seismic profiling | |
| US4870580A (en) | Compressional/shear wave separation in vertical seismic profiling | |
| US8902700B2 (en) | Borehole seismic acquisition system | |
| US5892732A (en) | Method and apparatus for seismic signal processing and exploration | |
| US5214613A (en) | Method and apparatus for determining properties of anisotropicelastic media | |
| EP2375268B1 (en) | Method for separating up and down propagating pressure and vertical velocity fields from pressure and three-axial motion sensors in towed streamers | |
| US4594691A (en) | Sonic well logging | |
| US6597994B2 (en) | Seismic processing system and method to determine the edges of seismic data events | |
| US6487502B1 (en) | System for estimating the locations of shaley subsurface formations | |
| US5661697A (en) | Method and apparatus for detection of sand formations in amplitude-versus-offset seismic surveys | |
| Martin et al. | Shear-wave birefringence: A new tool for evaluating fractured reservoirs | |
| AU2008216238B2 (en) | Performing 3-D scatterer imaging from 2-D seismic data | |
| Robertsson et al. | Wavefield separation using densely deployed three-component single-sensor groups in land surface-seismic recordings | |
| EP0395500A2 (en) | Method of filtering sonic well logging data | |
| EP0299862A2 (en) | Method for evaluating parameters related to the elastic properties of subsurface earth formations | |
| CN108431636B (en) | Land seismic sensors and adjacent multi-component seismic sensors arranged in pairs on average at least twenty meters apart | |
| EP2823337B1 (en) | Extracting sv shear data from p-wave marine data | |
| US7663971B2 (en) | Resonance scattering seismic method | |
| US20050197782A1 (en) | Measuring discontinuity in seismic data | |
| Peng et al. | Pressure in a fluid-filled borehole caused by a seismic source in stratified media | |
| Ge et al. | Determination of shallow shear-wave velocity at Mississippi embayment sites using vertical seismic profiling data | |
| Paulsson et al. | [5] P9 New Developments in High Resolution Borehole Seismology and Their Application to Reservoir Development and Management | |
| Wen et al. | Application of three-dimensional kinematic imaging to analysis of seismic reflection data from the Nevada Test Site | |
| Daley | m Lawrence Berkeley Laboratory | |
| Sarmiento | Delineation of the Reservoir by Seismic Methods: Chapter 3 |
Legal Events
| Date | Code | Title | Description |
|---|---|---|---|
| PUAI | Public reference made under article 153(3) epc to a published international application that has entered the european phase |
Free format text: ORIGINAL CODE: 0009012 |
|
| AK | Designated contracting states |
Designated state(s): DE FR GB IT NL |
|
| PUAL | Search report despatched |
Free format text: ORIGINAL CODE: 0009013 |
|
| AK | Designated contracting states |
Kind code of ref document: A3 Designated state(s): DE FR GB IT NL |
|
| 17P | Request for examination filed |
Effective date: 19870923 |
|
| 17Q | First examination report despatched |
Effective date: 19890202 |
|
| GRAA | (expected) grant |
Free format text: ORIGINAL CODE: 0009210 |
|
| AK | Designated contracting states |
Kind code of ref document: B1 Designated state(s): DE FR GB IT NL |
|
| PG25 | Lapsed in a contracting state [announced via postgrant information from national office to epo] |
Ref country code: IT Free format text: LAPSE BECAUSE OF FAILURE TO SUBMIT A TRANSLATION OF THE DESCRIPTION OR TO PAY THE FEE WITHIN THE PRESCRIBED TIME-LIMIT;WARNING: LAPSES OF ITALIAN PATENTS WITH EFFECTIVE DATE BEFORE 2007 MAY HAVE OCCURRED AT ANY TIME BEFORE 2007. THE CORRECT EFFECTIVE DATE MAY BE DIFFERENT FROM THE ONE RECORDED. Effective date: 19910116 |
|
| REF | Corresponds to: |
Ref document number: 3483960 Country of ref document: DE Date of ref document: 19910221 |
|
| ET | Fr: translation filed | ||
| PLBE | No opposition filed within time limit |
Free format text: ORIGINAL CODE: 0009261 |
|
| STAA | Information on the status of an ep patent application or granted ep patent |
Free format text: STATUS: NO OPPOSITION FILED WITHIN TIME LIMIT |
|
| 26N | No opposition filed | ||
| PG25 | Lapsed in a contracting state [announced via postgrant information from national office to epo] |
Ref country code: DE Effective date: 19920901 |
|
| PGFP | Annual fee paid to national office [announced via postgrant information from national office to epo] |
Ref country code: NL Payment date: 19921231 Year of fee payment: 9 |
|
| PG25 | Lapsed in a contracting state [announced via postgrant information from national office to epo] |
Ref country code: NL Effective date: 19940701 |
|
| NLV4 | Nl: lapsed or anulled due to non-payment of the annual fee | ||
| PGFP | Annual fee paid to national office [announced via postgrant information from national office to epo] |
Ref country code: FR Payment date: 19951017 Year of fee payment: 12 |
|
| PG25 | Lapsed in a contracting state [announced via postgrant information from national office to epo] |
Ref country code: FR Effective date: 19970829 |
|
| REG | Reference to a national code |
Ref country code: FR Ref legal event code: ST |
|
| REG | Reference to a national code |
Ref country code: GB Ref legal event code: IF02 |
|
| PGFP | Annual fee paid to national office [announced via postgrant information from national office to epo] |
Ref country code: GB Payment date: 20021218 Year of fee payment: 19 |
|
| PG25 | Lapsed in a contracting state [announced via postgrant information from national office to epo] |
Ref country code: GB Free format text: LAPSE BECAUSE OF NON-PAYMENT OF DUE FEES Effective date: 20031220 |
|
| GBPC | Gb: european patent ceased through non-payment of renewal fee |
Effective date: 20031220 |