CN115600049B - Sag observation method, device and system with strain section sag compensation function - Google Patents
Sag observation method, device and system with strain section sag compensation function Download PDFInfo
- Publication number
- CN115600049B CN115600049B CN202211588313.4A CN202211588313A CN115600049B CN 115600049 B CN115600049 B CN 115600049B CN 202211588313 A CN202211588313 A CN 202211588313A CN 115600049 B CN115600049 B CN 115600049B
- Authority
- CN
- China
- Prior art keywords
- sag
- tower
- point
- conductor
- section
- Prior art date
- Legal status (The legal status is an assumption and is not a legal conclusion. Google has not performed a legal analysis and makes no representation as to the accuracy of the status listed.)
- Active
Links
- 238000000034 method Methods 0.000 title claims abstract description 68
- 239000004020 conductor Substances 0.000 claims abstract description 115
- 238000004364 calculation method Methods 0.000 claims description 73
- 238000012545 processing Methods 0.000 claims description 19
- 238000009825 accumulation Methods 0.000 claims description 6
- 239000012211 strain insulator Substances 0.000 claims description 3
- 238000005259 measurement Methods 0.000 description 24
- 238000010276 construction Methods 0.000 description 16
- 125000006850 spacer group Chemical group 0.000 description 11
- 238000013461 design Methods 0.000 description 5
- 238000001514 detection method Methods 0.000 description 5
- XEEYBQQBJWHFJM-UHFFFAOYSA-N Iron Chemical compound [Fe] XEEYBQQBJWHFJM-UHFFFAOYSA-N 0.000 description 4
- 238000009434 installation Methods 0.000 description 4
- 230000001360 synchronised effect Effects 0.000 description 4
- 230000005540 biological transmission Effects 0.000 description 3
- 238000010586 diagram Methods 0.000 description 3
- 238000004422 calculation algorithm Methods 0.000 description 2
- 238000004590 computer program Methods 0.000 description 2
- 238000012937 correction Methods 0.000 description 2
- 230000006870 function Effects 0.000 description 2
- 229910052742 iron Inorganic materials 0.000 description 2
- 238000005192 partition Methods 0.000 description 2
- 229910000831 Steel Inorganic materials 0.000 description 1
- 230000000694 effects Effects 0.000 description 1
- 238000005265 energy consumption Methods 0.000 description 1
- 239000010959 steel Substances 0.000 description 1
Images


Classifications
-
- G—PHYSICS
- G06—COMPUTING; CALCULATING OR COUNTING
- G06F—ELECTRIC DIGITAL DATA PROCESSING
- G06F17/00—Digital computing or data processing equipment or methods, specially adapted for specific functions
- G06F17/10—Complex mathematical operations
-
- G—PHYSICS
- G01—MEASURING; TESTING
- G01C—MEASURING DISTANCES, LEVELS OR BEARINGS; SURVEYING; NAVIGATION; GYROSCOPIC INSTRUMENTS; PHOTOGRAMMETRY OR VIDEOGRAMMETRY
- G01C5/00—Measuring height; Measuring distances transverse to line of sight; Levelling between separated points; Surveyors' levels
-
- G—PHYSICS
- G01—MEASURING; TESTING
- G01S—RADIO DIRECTION-FINDING; RADIO NAVIGATION; DETERMINING DISTANCE OR VELOCITY BY USE OF RADIO WAVES; LOCATING OR PRESENCE-DETECTING BY USE OF THE REFLECTION OR RERADIATION OF RADIO WAVES; ANALOGOUS ARRANGEMENTS USING OTHER WAVES
- G01S13/00—Systems using the reflection or reradiation of radio waves, e.g. radar systems; Analogous systems using reflection or reradiation of waves whose nature or wavelength is irrelevant or unspecified
- G01S13/88—Radar or analogous systems specially adapted for specific applications
- G01S13/882—Radar or analogous systems specially adapted for specific applications for altimeters
Landscapes
- Engineering & Computer Science (AREA)
- Physics & Mathematics (AREA)
- Remote Sensing (AREA)
- General Physics & Mathematics (AREA)
- Radar, Positioning & Navigation (AREA)
- Mathematical Physics (AREA)
- Data Mining & Analysis (AREA)
- Theoretical Computer Science (AREA)
- Software Systems (AREA)
- Pure & Applied Mathematics (AREA)
- Databases & Information Systems (AREA)
- Computational Mathematics (AREA)
- General Engineering & Computer Science (AREA)
- Mathematical Optimization (AREA)
- Mathematical Analysis (AREA)
- Algebra (AREA)
- Electromagnetism (AREA)
- Computer Networks & Wireless Communication (AREA)
- Electric Cable Installation (AREA)
- Length Measuring Devices With Unspecified Measuring Means (AREA)
Abstract
The invention relates to the technical field of sag observation, in particular to a sag observation method, device and system with strain section sag compensation. When the method is used for observing the sag of the X # conductor in the strain section sequentially comprising the first tower and the second tower along the advancing direction of a line, the hanging points of the X # conductor at the first tower and the second tower are respectively a hanging point A and a hanging point B, and a measuring point C is arranged at the X # conductor to realize compensation of relevant parameters of the observed sag based on the line corner. The system is used for realizing the method, and the device comprises the system. The invention can better solve the sag observation deviation of the strain section caused by the corner, and realize the sag compensation of the strain section.
Description
Technical Field
The invention relates to the technical field of sag observation, in particular to a sag observation method, device and system with strain section sag compensation.
Background
In patents such as chinese publication No. CN112833762A, CN 112833763A, CN112833764 a, an apparatus, a method, and a system for measuring sag of an overhead line based on an on-line measuring apparatus are disclosed, which include sag observation of a single wire and sag observation of adjacent wires.
As shown in fig. 1, in the observation of the sag of a single wire, the sag can be divided into 3 sections in the vertical projection plane, the first section is the height difference between the hanging point and the measurement point (the vertical distance between Ha and Hc in fig. 1), the second section is the height difference between the hanging point and the measurement point at the projection point of the connecting line of the hanging points (the vertical distance L1 between the point a and the connecting line AB in fig. 1 at the position corresponding to the point c), and the 3 section is the height difference between the measurement point c and the wire (the vertical distance between the point c and the X # wire in fig. 1); it should be noted that fig. 1 is directly cited in the patent document CN112833762a, and in fact, c in fig. 1 is a measurement point which may be higher or lower than the hanging point Ha and should be actually located at the circle marked at Hc. That is, the sag structure at the measurement point c is the distance from the wire to the measurement point c, the distance from the measurement point c to the hanging point Ha, and the distance from the hanging point Ha to the corresponding position of the connection line AB. The calculation formula of the height difference L1 of the connecting projection points of the hanging points and the measuring points c on the hanging points is L1= L2 × Lc/Lj.
As shown in FIG. 2, when calculating the height difference L1 between the hanging point and the projected point of the measuring point on the connecting line of the hanging point, the values of Lc and Lj need to be obtained in the horizontal projection plane, and in FIG. 2, lc is L AC Lj is L AC And L BC The sum of (1).
In the existing document, after the acquisition of the sag at the measurement point c is completed, the maximum observed sag f needs to be further acquired x 1/2 And maximum standard sag f 0 1/2 And the guidance of the line tightening construction is realized by calculating the difference between the two.
The sag observation of the single wire can be preferably applied to sag observation of a tangent tower and a tangent tower, and is difficult to be applied to sag observation of a tension tower, a tangent tower or a tangent tower and a tension tower, mainly because the tension tower is arranged at a corner of an overhead line, and the design of the corner makes it difficult to adopt the method to realize calculation and acquisition of related data, which is specifically embodied as follows:
1. when the span Lj between the hanging points A and B is calculated, although the offset influence of the cross arm width of the strain tower and the pulley width on the hanging point position is considered, the influence of the deflection angle of the cross arm of the strain tower on the actual span Lj at different hanging points is not considered;
2. calculating the maximum observed sag f x 1/2 When the design span L is used for representing the distance between the center points of adjacent tower positions, the actual span of the line positioned on the inner side of the corner is smaller than the design span L, and the actual span of the line positioned on the outer side of the corner is larger than the design span L, so that larger errors are brought.
According to the method, in the observation of the sag of the adjacent wire, the height difference between the adjacent wire and the current single wire is obtained through radar scanning equipment, the sag of the adjacent wire is further obtained, and in order to guarantee the data validity, the judgment of the distance between the adjacent wire and the current single wire is introduced. However, this method is difficult to be applied to the overhead line stringing construction for the split sub-conductors, because during the actual overhead line stringing construction for the split sub-conductors, a plurality of split sub-conductors at the front stage tower are firstly fixed at the hanging point through the spacer, then all the split sub-conductors are pulled to the rear stage tower through the plate moving device, and then all the split sub-conductors are fixed at the hanging point of the rear stage tower through the spacer. This results in:
1. the significance of sag observation in stringing construction mainly lies in that the maximum observation sag f needs to be ensured x 1/2 With maximum standard sag f 0 1/2 Substantially achieving consistency; however, during the wire-tightening construction, one ends of the plurality of split sub-conductors are spatially distributed in the shape of a spacer, and the other ends are located on the same horizontal plane; this means that the maximum standard sag f of the different split sub-conductors 0 1/2 There should be a difference in elevation when the actual construction is completed; however, in the current measurement mode, the maximum standard sag f 0 1/2 The sag observation value of a single wire is obtained through inverse calculation, namely the difference of the sag of different split sub-wires in the wire tightening construction cannot be considered in the mode;
2. when the validity of the numerical value is judged based on the distance between the adjacent wire and the current single wire, the distances between the two ends of the plurality of split sub-wires may be inconsistent in the wire tightening construction, so that the data validity may be misjudged.
In addition, due to the existence of the swinging and vibration characteristics of the line, it is difficult to take a certain single-measurement value as a final sag observation value, and although the method adopts an average-based mode to overcome the error influence of the swinging and vibration characteristics on the sag observation value, the method only adopts an average value mode, and further accuracy of data is difficult to guarantee.
Disclosure of Invention
The invention provides an arc sag observation method with strain section arc sag compensation, which can better solve the arc sag observation deviation caused by a corner of a strain section and realize the arc sag compensation of the strain section.
According to the sag observation method with the strain section sag compensation, when the sag observation is carried out on the X # conducting wire in the strain sections of the first tower and the second tower along the advancing direction of a circuit, the hanging points of the X # conducting wire at the first tower and the second tower are respectively a hanging point A and a hanging point B, and when a measuring point C is arranged at the X # conducting wire for sag observation, the sag observation method comprises the following steps:
step S1, inputting the angle of rotation of a tower I at an input unit Width of pulley at hanging point A
 Length of cross arm
 And cross arm width
 Angle of rotation of tower two
 Width of tackle at hanging point B
 Length of cross arm
 And cross arm width
 And left and right phases of the X # conductor;
wherein, the angle of rotation is Degree of angle of rotation
 When the X # lead is positioned at the first tower and the second tower and rotates right along the advancing direction of the circuit, the positive number is obtained, and when the X # lead rotates left, the negative number is obtained;
wherein, the X # conducting wire is positioned at the left side of the advancing direction of the circuit and is a left phase, and the X # conducting wire is positioned at the right side of the advancing direction of the circuit and is a right phase;
s2, acquiring the actual span between the hanging point A and the hanging point B of the X # conductor through a computing unit When the X # conducting wire is in the left phase,

when the X # conducting wire is in the right phase,

step S3, formula-based calculation unit Acquiring a projection point of the measuring point C on a connecting line of the hanging points A and B and a height difference between the hanging points A and B;
wherein, is the height difference between the hanging point A and the hanging point B,
 the horizontal distance between the measuring point C and the hanging point A is measured;
step S4, formula-based calculation unit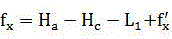 Obtaining the observed sag of the X # wire
 (ii) a Wherein,
 is the height of the hanging point A,
 in order to measure the height of the point C,
 the height difference between the measuring point C and the X # conducting wire is measured;
step S5, formula-based calculation unit Obtaining maximum observed sag
 And based on a formula
 Obtaining maximum standard sag
 (ii) a Wherein r is the wire specific load, and T is the wire tension;
s6, acquiring and outputting the sag deviation f through a processing unit, wherein f = -
- 。
。
Through the step S2, the deviation between the actual span and the designed span caused by the rotation angle of the tension tower (tower I and/or tower II) of the X # lead at the tension section can be preferably considered, and through the correction of the calculating unit, the deviation can be preferably compensated, so that the accuracy of the sag observation can be effectively improved.
Preferably, the calculating unit in step S2 has a first calculating module, a second calculating module, a third calculating module and an accumulating module, wherein the first calculating module, the second calculating module and the third calculating module are used for respectively obtaining the segment values of the X # conductor in the near-tower section, the near-tower section and the middle section, and the accumulating module is used for obtaining the actual span by accumulating all segment calculated values (ii) a The method specifically comprises the following steps of,
step S21, the actual gear distance of a section close to the tower is calculated through a first calculation module When the X # conducting wire is in the left phase,
 (ii) a When the X # conducting wire is in the right phase,
 ;
;
step S22, the actual gear distance of the second tower section is approached through the second calculation module When the X # conducting wire is in the left phase,
 (ii) a When the X # conducting wire is in the right phase,
 ;
;
step S23, calculating the actual gear distance of the middle section of the module through the third calculation module ,
, ;
;
Step S24, acquiring the actual gear distance through an accumulation module ,
, ;
;
Wherein, L1 and L2 are respectively set reference values of the X # conductor at a near-tower section and a near-tower section.
The actual gear distance can be preferably realized through the steps S21 to S24 The parallel synchronous calculation can better improve the calculation speed and meet the actual construction condition.
Preferably, in step S3, the calculation unit is based on a formula Acquiring the horizontal distance between the measuring point C and the hanging point A
 (ii) a Wherein,
 is the center point of the tower I
 The distance between the hanging point A and the hanging point A on the horizontal projection plane,
 is the center point of the tower I
 The distance from the measuring point C on the horizontal projection plane,
 is composed of
 A projection angle on the horizontal projection plane;
wherein the calculation unit is based on a formula Obtaining a distance
 。
。
By the above, the horizontal distance between the measuring point C and the hanging point A can be better considered according to the dimensions of the cross arm and the pulley Thereby making the calculation result more accurate.
Preferably, in step S3, the calculation unit is based on a formula Obtaining a projection angle
 (ii) a Wherein,
 is the center point of the tower II
 The distance from the measuring point C on the horizontal projection plane,
 is the center point of the tower I
 The center point of the tower II and the tower
 Distance on the horizontal projection plane.
Through the above, the horizontal distance of the corner of the tension tower can be preferably considered Thereby making the calculation result more accurate.
Preferably, when the X # conductor is a split conductor, the parameters input at the input unit in step S1 further include the number of phases of the split conductor, the phase n of the X # conductor, and the pitch between adjacent sub-conductors (ii) a Wherein, the phase n of the X # conducting wire is counted according to the arrangement mode at the spacing rod, and the number of the phase n is n =1, wherein the lowest sub-conducting wire positioned at the leftmost side of the spacing rod is used as the sub-conducting wire; in step S6, the processing unit provides a sag compensation value through a sag compensation module
 The processing unit is based on the formula f =
 -(
-( +
+ ) And acquiring sag deviation f.
This causes the X # conductor to be a split conductor and to be in different phases, which can be subject to deviations in the parameters of the measurement process and the actual installation position. That is, the measurement of the X # conductor is performed during the drawing process, and can be considered to be in the center position of the spacer, and the X # conductor needs to be installed at the installation position of the spacer after the measurement is completed; the above can preferably compensate for the deviation.
Preferably, when the number of phases of the split conductor is four, the sag compensation value is for n =1 and n =4 Is composed of
 (ii) a Sag compensation values for n =2 and n =3
 Is composed of
 . Thereby enabling the sag compensation module to be better based on the spacing of adjacent sub-conductors
 The final sag deviation f is compensated.
Preferably, when the number of phases of the split conductor is six, the sag compensation value is for n =1 and n =6 Is composed of
 (ii) a Sag compensation values for n =3 and n =4
 Is composed of
 (ii) a Sag compensation values for n =2 and n =5
 Is composed of
 . Thereby enabling the sag compensation module to be better based on the spacing of adjacent sub-conductors
 The final sag deviation f is compensated.
Preferably, when the number of phases of the split conductor is eight, the sag compensation value is for n =1 and n =8 Is composed of
 (ii) a Sag compensation values for n =2 and n =7
 Is composed of
 (ii) a Sag compensation values for n =3 and n =6
 Is composed of
 (ii) a Sag compensation values for n =4 and n =5
 Is composed of
 . Thereby enabling the sag compensation module to be better based on the spacing of adjacent sub-conductors
 The final sag deviation f is compensated.
In addition, the present invention also provides a sag observation device for implementing any one of the above sag observation methods, including:
an input unit for enabling input of relevant data including step S1;
a calculation unit for implementing calculation of the relevant data including steps S1-S5; and
a processing unit for implementing the processing of the relevant data including step S6.
Through the above, the compensation of the sag measurement data in the strain section can be preferably realized, and particularly, the compensation of sag deviation caused by the corner of the tower and the distance between the partition plates can be preferably realized.
In addition, the invention also provides a sag observation system which is provided with any one of the sag observation devices.
Drawings
FIG. 1 is a schematic diagram of a conventional sag observation of a single wire;
FIG. 2 is a schematic diagram illustrating conventional calculation of sag observation of a single wire;
FIG. 3 is a schematic diagram of a prior art sag observation of adjacent wires;
FIG. 4 is a schematic view of the sag observation method in example 1;
fig. 5 is a schematic view of sag compensation of a quad-bundled conductor in example 1;
fig. 6 is a schematic view of sag compensation of a six-split conductor in example 1;
fig. 7 is a schematic view of sag compensation of an eight-split conductor in example 1;
FIG. 8 is a schematic view of a sag observation system according to example 1;
fig. 9 is a schematic view of the pitch compensation of the four-split conductors in embodiment 2;
fig. 10 is a schematic view of the pitch compensation of a six-split conductor in example 2;
fig. 11 is a schematic view of the pitch compensation of the eight-split conductor in example 2;
FIG. 12 is a schematic view of a sag observation system according to example 2;
fig. 13 is a schematic view of the sag observation system in embodiment 3.
Detailed Description
For a further understanding of the invention, reference should be made to the following detailed description taken in conjunction with the accompanying drawings and examples. It is to be understood that the examples are illustrative of the invention and not restrictive.
Referring to fig. 1 and 2, in the case of measuring the sag of a conducting wire between the first tower and the second tower by using the scheme of chinese patent publication No. CN112833762A, CN 112833763A, CN112833764 a and the measurement point C provided by the on-line sag observation device, the center points of the first tower and the second tower are respectively recorded as the center points of the first tower and the second tower And
And recording the certain wire as an X # wire, recording hanging points of the X # wire at a first tower and a second tower as A and B respectively, and recording the direction from the first tower to the second tower as a line advancing direction; setting a measuring point C at the position of an X # conducting wire according to a formula
 The observation sag of the X # wire at the measuring point C can be obtained better
 。
。
In the above-mentioned formula, is the height of the hanging point A,
 in order to measure the height of the point C,
 for measuring the height between the projection point of the point C connected with the hanging points A and B and the hanging point AThe difference of the degrees is that the temperature of the steel is higher,
 the height difference between the point C and the X # wire is measured.
Wherein, ,
, is the height difference between the hanging point A and the hanging point B,
 to measure the horizontal distance of point C from hanging point a,
 is the actual gear span.
Wherein, (ii) a In the formula, in the above-mentioned formula,
 is the center point of the tower
 The distance between the hanging point A and the hanging point A on the horizontal projection plane,
 is the center point of the tower position
 The distance from the measuring point C on the horizontal projection plane,
 is composed of
 Angle of projection on a horizontal plane of projection.
In obtaining the observed sag Then, the maximum observation sag which has reference significance to the wire tightening construction needs to be obtained
 And maximum standard sag
 And the guidance of the wire tightening construction can be better realized by calculating the deviation of the two.
Wherein, ,
, . Wherein r is the wire specific load, and T is the wire tension.
Referring to fig. 3, in the above prior art, a radar scanning device can be further disposed at the on-line sag observation device, so as to pass the acquired maximum observation sag of the current X # wire And obtaining the maximum observation sag of the rest adjacent N # conducting wires. The method specifically comprises the steps of setting a radar detection point at a measurement point C, and acquiring the vertical distance h between the radar detection point and an X # lead and the inclination angle of the vertical line from the radar detection point to the X # lead in the left and right directions of the X # lead
 And the inclination angle in the front-rear direction
 Distance between radar detection point and radar scanning point of N # lead
 And radar detectionScanning angle of connecting line of measuring point and radar scanning point
 . Can be based on the formula
 Obtaining the maximum observation sag of N # conductor
 。
。
Example 1
In order to compensate for the large change of the actual span due to the corner of the tension tower in the tension section, the present embodiment provides a sag observation method with the sag compensation of the tension section, as shown in fig. 4.
In this embodiment, when observing sag of the X # conductor in the strain section sequentially including the first tower and the second tower along the forward direction of the line, it is noted that the hanging points of the X # conductor at the first tower and the second tower are respectively the hanging point a and the hanging point B, and the measuring point C is set at the X # conductor to observe sag, which includes the following steps:
step S1, inputting the angle of rotation of a tower I at an input unit Width of pulley at hanging point A
 Length of cross arm
 And cross arm width
 Angle of rotation of tower two
 Tackle width at hanging point B
 Length of cross arm
 And cross arm width
 And left and right phases of the X # conductor;
wherein, the angle of rotation is Degree of angle of rotation
 When the X # lead is positioned at the first tower and the second tower and rotates right along the advancing direction of the circuit, the positive number is obtained, and when the X # lead rotates left, the negative number is obtained;
wherein, the X # conducting wire is positioned at the left side of the advancing direction of the circuit and is a left phase, and the X # conducting wire is positioned at the right side of the advancing direction of the circuit and is a right phase;
s2, acquiring the actual span between the hanging point A and the hanging point B of the X # conductor through a computing unit When the X # conducting wire is in the left phase,

when the X # conducting wire is in the right phase,

step S3, formula-based calculation unit Acquiring a projection point of the measuring point C on a connecting line of the hanging points A and B and a height difference between the hanging points A and B;
wherein, is the height difference between the hanging point A and the hanging point B,
 the horizontal distance between the measuring point C and the hanging point A is measured;
step S4, formula-based calculation unit Obtaining the observed sag of the X # wire
 (ii) a Wherein,
 is the height of the hanging point A,
 in order to measure the height of the point C,
 the height difference between the measuring point C and the X # conducting wire is measured;
step S5, based on formula through the calculating unit Obtaining the maximum observed sag
 And based on a formula
 Obtaining maximum standard sag
 (ii) a Wherein r is the wire specific load, and T is the wire tension.
Step S6, acquiring and outputting the sag deviation f through a processing unit, wherein f = -
- 。
。
In this embodiment, the deviation between the actual span and the designed span of the X # conducting wire at the tension resistant section due to the corner of the tension resistant tower (tower one and/or tower two) can be preferably considered through the step S2, and the deviation can be preferably compensated through the correction of the computing unit, so that the accuracy of the sag observation can be effectively improved.
It can be understood that the solution in the embodiment is actually a further improvement of the solution in the patents with chinese publication No. CN112833762A, CN 112833763A, CN112833764 a, etc., so that the duplicate portions of the embodiment and the prior art will not be described in detail.
It is understood that, in step S1, the input parameters also relate to parameters such as tower position center, height difference of the lowest leg base of the iron tower, height of the iron tower, length of the pulley string, and the like of the first tower and the second tower. And further realize the calculation of parameters such as the height of the hanging point A and the hanging point B. The specific steps are found in the above-mentioned patent documents, and are not described in detail in this embodiment.
In addition, the calculating unit in step S2 has a first calculating module, a second calculating module, a third calculating module and an accumulating module, wherein the first calculating module, the second calculating module and the third calculating module are used for respectively obtaining the segment values of the X # conductor in the near-tower section, the near-tower section and the middle section, and the accumulating module is used for obtaining the actual span by accumulating all segment calculated values (ii) a The method specifically comprises the following steps of,
step S21, the actual gear distance of a section close to the tower is calculated through a first calculation module When the X # conducting wire is in the left phase,
 (ii) a When the X # conducting wire is in the right phase,
 ;
;
step S22, the actual gear distance of the second tower section is approached through the second calculation module When the X # conducting wire is in the left phase,
 (ii) a When the X # conducting wire is in the right phase,
 ;
;
step S23, calculating the actual gear distance of the middle section of the module through the third calculation module ,
, ;
;
Step S24, acquiring the actual gear distance through an accumulation module ,
, ;
;
Wherein, L1 and L2 are respectively set reference values of the X # conductor at a near-tower section and a near-tower section.
Through the steps S21-S24, the actual gear distance can be better realized The parallel synchronous calculation can better improve the calculation speed and meet the actual construction condition.
Wherein, L1 and L2 can be both set to 30m, and of course, can also be adjusted according to the size of the designed span.
Particularly, it can be understood that the overhead transmission line actually has a plurality of towers in the extending direction of the line, and if the manner of steps S21 to S24 is not adopted, when calculating each line gear (between two towers), the related parameters at both ends of the line gear need to be calculated again, which results in that the tower shared by adjacent line gears is repeatedly calculated in two calculations.
In the above steps S21-S24, the calculation data of the second calculation module can be temporarily stored and used as the calculation value corresponding to "tower one" when the actual gear distance calculation of the next gear is performed. Namely:
in an initial state, the actual gear span of the first line gear is calculated firstly, and at the moment, the first calculating module, the second calculating module, the third calculating module and the accumulating module respectively act according to the steps S21-S24, so that the actual gear span of the first line gear is obtained;
thereafter, the calculation data of the second calculation module (i.e. the ) Is stored in a memory location (e.g., register);
then, when the actual span is calculated for the adjacent second line, only the second calculating module, the third calculating module and the accumulating module can act, and the second calculating module obtains the actual span of the tower section corresponding to the second line close to the second line The third computing module obtains the actual gear distance of the middle section
 Near the actual span of the corresponding tower section
 Can be directly at the accumulation module according to the formula
 Obtaining;
thereafter, the relevant data at the storage unit can be updated with the calculated value at the second wire file by the second calculation module;
and repeating the above steps to complete the calculation of the actual gear distance of the third and subsequent line gears.
By the above, the number of times of calculation can be preferably reduced, and particularly, the measuring point C in the present embodiment is integrated at an on-line measuring device, and the on-line measuring device is powered by a battery, and by reducing the frequency of calculation, the endurance time of the on-line measuring device can be preferably increased.
The reference values set in the near-tower segment and the near-tower segment in different line profiles can be different or can be designed to be the same.
Further, in step S3, the calculation unit is based on the formula Acquiring the horizontal distance between the measuring point C and the hanging point A
 (ii) a Wherein,
 is the center point of the tower I
 The distance between the hanging point A and the hanging point A on the horizontal projection plane,
 is the center point of the tower I
 The distance from the measuring point C on the horizontal projection plane,
 is composed of
 A projection angle on the horizontal projection plane;
wherein the calculation unit is based on a formula Obtaining a distance
 。
。
By the above, the horizontal distance between the measuring point C and the hanging point A can be better considered according to the dimensions of the cross arm and the pulley Thereby making the calculation result more accurate.
Further, in step S3, the calculation unit is based on the formula Obtaining a projection angle
 (ii) a Wherein,
 is the center point of the tower II
 The distance from the measuring point C on the horizontal projection plane,
 is the center point of the tower I
 The center point of the tower II and the tower
 Distance on the horizontal projection plane.
Through the above, canPreferably considering the corner-to-horizontal distance of the tension tower Thereby making the calculation result more accurate.
In addition, when the X # conductor is a split conductor, the parameters input at the input unit in step S1 further include the number of phases of the split conductor, the phase n of the X # conductor, and the pitch between adjacent sub-conductors (ii) a Wherein, the phase n of the X # conducting wire is counted according to the arrangement mode at the spacing rod, and the number of the phase n is n =1, wherein the lowest sub-conducting wire positioned at the leftmost side of the spacing rod is used as the sub-conducting wire;
in step S6 of this embodiment, the processing unit provides a sag compensation value through a sag compensation module The processing unit is based on the formula f =
 -(
-( +
+ ) And acquiring sag deviation f.
It can be understood that, in actual overhead transmission line tight line work progress, the wire of tower one department can be fixed at the spacer of split conductor at first, later can through walking the two departments of pulling to the tower of board device flush, the online measuring equipment of this embodiment is carrying out the sag observation at the in-process of pulling, later through calculating the sag deviation f of every sub-wire, can adjust the sag of every wire at tight line in-process, after the adjustment is accomplished, can be fixed in the spacer of tower two departments with the wire.
Therefore, in the above process, when the X # conductor is a split conductor and is in different phases, there are deviations in the parameters of the measurement process and the actual installation position. That is, the measurement of the X # conductor is performed during the drawing process, and can be considered to be in the center position of the spacer, and the X # conductor needs to be installed at the installation position of the spacer after the measurement is completed; the above can preferably compensate for the deviation.
As seen in fig. 5, when the number of phases of the split conductor is four (i.e., a quad-split conductor), the sag compensation value is for n =1 and n =4 Is composed of
 (ii) a Sag compensation values for n =2 and n =3
 Is composed of
 . Thereby enabling the sag compensation module to be better based on the spacing of adjacent sub-conductors
 The final sag deviation f is compensated.
Referring to fig. 6, when the number of phases of the split conductor is six (i.e., six split conductors), the sag compensation values are for n =1 and n =6 Is composed of
 (ii) a Sag compensation values for n =3 and n =4
 Is composed of
 (ii) a Sag compensation values for n =2 and n =5
 Is composed of
 . Thereby enabling the sag compensation module to be better based on the spacing of adjacent sub-conductors
 The final sag deviation f is compensated.
As seen in fig. 7, when the number of phases of the split conductor is eight (i.e., eight split conductors), the sag compensation value is for n =1 and n =8 Is composed of
 (ii) a Sag compensation values for n =2 and n =7
 Is composed of
 (ii) a Sag compensation values for n =3 and n =6
 Is composed of
 (ii) a Sag compensation values for n =4 and n =5
 Is composed of
 . Thereby enabling the sag compensation module to be better based on the spacing of adjacent sub-conductors
 Compensating for the resulting sag deviation f。
Referring to fig. 8, in order to implement the sag observation method, the present embodiment further provides a sag observation device, which includes:
an input unit for enabling input of relevant data including step S1;
a calculation unit for implementing calculation of the relevant data including steps S1-S5; and
a processing unit for implementing the processing of the relevant data including step S6.
Through the above, the compensation of the sag measurement data in the strain section can be preferably realized, and particularly, the compensation of sag deviation caused by the corner of the tower and the distance between the partition plates can be preferably realized.
In addition, in the sag observation device of this embodiment, the calculation unit may further include a first calculation module, a second calculation module, a third calculation module, and an accumulation module, where the first calculation module, the second calculation module, and the third calculation module are configured to obtain segment values of the X # conductor at the near-tower first segment, the near-tower second segment, and the middle segment, respectively, and the accumulation module is configured to obtain the actual span by accumulating all segment calculation values . Thus, the actual gear distance can be better realized
 The parallel synchronous calculation can better improve the calculation speed and meet the actual construction condition.
In addition, the sag observation device of the present embodiment can further include a storage unit. The storage unit can be used for storing related data such as original input data and intermediate calculation data, so that the data input frequency and the calculation frequency can be reduced better, and the effects of improving the calculation efficiency and reducing the energy consumption of a system are achieved.
In addition, in the sag observation device of the embodiment, the processing unit can further include a sag compensation module, and the sag compensation module is used for providing an arcVertical compensation value . The resulting sag deviation f can be preferably compensated for.
In addition, the embodiment also provides an arc sag observation system which is provided with the arc sag observation device.
Example 2
In the prior art, the maximum observation sag based on the current X # wire is scanned by a radar scanning device Maximum observed sag for the remaining adjacent N # conductors
 The principle of obtaining is that the height difference between the current X # conducting wire and the corresponding N # conducting wire is calculated, and the height difference is added to the maximum observation sag of the current X # conducting wire
 In the middle, the maximum observation sag of the corresponding N # conducting wire can be obtained
 。
。
This calculation principle has an important premise that the horizontal pitch of the current X # wires and the corresponding N # wires is substantially the same as the pitch when they are in the final mounting position. However, in the actual overhead line stringing construction process, the lead at the first tower is dragged to the second tower through the plate walking device, and in the dragging process, the current X # lead and the corresponding N # lead both swing and vibrate. This will undoubtedly result in a very high uncertainty, i.e. a large error, of the final measured data. In addition, for a radar scanning device such as a split conductor, a plurality of sets of data are output in one scanning period, the plurality of sets of data include one data corresponding to each different adjacent N # conductor, and the difficulty in practical application also includes how to distinguish the credible data corresponding to the adjacent N # conductor.
In order to solve the above problems, in the sag observation method with adjacent wire spacing compensation provided in this embodiment, when there are X # wires and adjacent N # wires in the wire stages of the first tower and the second tower in sequence along the forward direction of the line, different N # wires are numbered in sequence by positive integers in the direction away from the X # wires; maximum observation sag based on X # conductor Obtaining the maximum observation sag of N # conductor
 The method specifically comprises the following steps:
step SA, setting a measuring point C at the position of the X # conductor, and acquiring the maximum observation sag of the X # conductor ;
;
SB, arranging a radar scanning device at the measuring point C, and acquiring the vertical distance h between the measuring point C and the X # lead and the inclination angle of the perpendicular line from the measuring point C to the X # lead in the left and right directions of the X # lead And the inclination angle in the front-rear direction
 And the radar scanning distance between the measuring point C and all adjacent N # conductors
 And corresponding radar scan angle
 ;
;
Step SC, obtaining the observed horizontal distance between the X # conducting wire and all the adjacent N # conducting wires at a computing unit ,
, ;
;
Step SD, classifying the data collected in step SB at a classification unit, specifically,

wherein N is the total number of N # conducting wires;
step SE, judging the data processed in the step SD one by one at a judging unit, wherein the data which accord with a judging formula are credible data and output, and the data which do not accord with the judging formula are incredible data and are discarded; the decision formula is specifically as follows,

wherein, represents the theoretical horizontal distance between the X # conducting wire and the N # conducting wire, D is the diameter of the conducting wire,
 is the theoretical horizontal distance between adjacent wires numbered n and n-1;
step SF, at a processing unit, according to the formula Obtaining the maximum observation sag of N # conductor
 。
。
By the method, the classification of multiple groups of data of the radar scanning equipment in a single scanning period can be preferably realized, namely, the scanned data and the corresponding data can be preferably classified when a plurality of adjacent wires existThe wires are associated and correspond, so that the maximum observation sag of a plurality of adjacent N # wires can be better realized The synchronous output of (2).
It can be understood that, although the association and correspondence between all data and different adjacent wires can be preferably realized by the classifying unit, in practice, the determining unit is added in consideration of the influence of wire swinging and vibration on the horizontal spacing, so that the classified data can be reliably determined, and the accuracy of data output can be preferably ensured.
It is understood that, in the embodiment, considering that the X # conductive line may be located at the most lateral side or the middle side, the related measurement data at the left side of the X # conductive line can be defined as a negative value, and the related data at the right side can be defined as a positive value, so that the versatility of the method can be improved.
Wherein, refers to the distance between the measuring point C and the radar scanning point of the N # lead,
 the scanning angle is the scanning angle of the connecting line of the radar detection point and the radar scanning point.
Wherein, for the strain section, the step SA can be obtained based on the method in embodiment 1.
Furthermore, step SF can also include the acquisition and compensation of the corresponding sag deviations as in the method of embodiment 1.
In addition, in the embodiment, the step SB-SE can be repeated for multiple times, and then multiple radar scanning distances corresponding to the corresponding N # conducting wires can be obtained And scanning the distances with the plurality of radars
 Mean value ofAs a basis for the calculation of step SF. Thereby, the reliability of the data result can be further improved.
In addition, when the X # conductor is a split conductor, the distance between the adjacent sub-conductors at the spacer is compensated by a distance compensation unit The spacing of adjacent sub-conductors at the track means
 The horizontal distance between the measuring point C and the corresponding hanging point
 And the actual gear span
 For theoretical horizontal distance
 Compensation is performed. Thereby preferably realizing the theoretical horizontal distance
 And (4) correcting.
As in embodiment 1, it can be understood that, in the actual overhead transmission line stringing construction process, the split conductors are required to be corrected because one ends of the split conductors are fixedly distributed at the spacers in an array manner, and the other ends of the split conductors are horizontally arranged at the board walking device at intervals, and the distances between adjacent sub-conductors are different at any point of the split conductors.
Referring to fig. 9, when the X # conductor is a quad-bundled conductor, and the X # conductor is the leftmost conductor, the distance compensation unit compensates for the theoretical horizontal distance based on the following formula The compensation is carried out and the compensation is carried out,

by the above, the compensation of the adjacent spacing of the four-split conductors can be preferably realized.
Wherein, for the strain section, the horizontal distance between the measuring point C and the hanging point A And the actual gear distance
 It can be obtained based on the method in
 embodiment 1.
Referring to fig. 10, when the X # conductor is a six-split conductor, and the X # conductor is the leftmost conductor, the distance compensation unit compensates for the theoretical horizontal distance based on the following formula The compensation is carried out and the compensation is carried out,

by the above, the compensation of the adjacent spacing of the six-split conductor can be preferably realized.
Referring to fig. 11, when the X # conductor is an eight-split conductor, and the X # conductor is the leftmost conductor, the distance compensation unit compensates for the theoretical horizontal distance based on the following formula The compensation is carried out and the compensation is carried out,

by the above, the compensation of the adjacent spacing of the eight-split conductors can be preferably realized.
Referring to fig. 12, in order to implement the sag observation method, the present embodiment further provides a sag observation device, which includes:
radar scanning equipment for realizing the collection of relevant data including the step SB;
a calculation unit for implementing calculation of the relevant data including step SC;
a classification unit for implementing classification of the relevant data including step SD;
a determination unit for implementing a determination of the relevant data including step SE; and
and the processing unit is used for realizing the processing and output of the related data including the step SF.
Through the method, compensation and judgment of sag observation data can be preferably carried out on the adjacent sub-wires in the split wires, so that the accuracy of data can be preferably realized.
In addition, the embodiment also provides an arc sag observation system which is provided with the arc sag observation device.
Example 3
In consideration of errors of observation data caused by vibration and swing characteristics of a line in overhead line stringing construction, the embodiment provides a dynamic sag data fitting algorithm.
When carrying out the arc observation to locating the X # wire in the strain insulator section that is tower one and tower two in proper order along the circuit advancing direction, note that the X # wire is respectively for hanging a point A and hanging a point B at the hanging point of tower one and tower two department, set up measuring point C and carry out the arc observation time of hanging down at X # wire department, include following step:
step one, continuously moving a measuring point C along the extending direction of an X # lead, and acquiring the horizontal distance between the measuring point C and a hanging point A of the measuring point C at different positions of the X # lead through an acquisition unit And observing sag
 (ii) a And a data set K is constructed,
 ,
, and
and respectively is the horizontal distance between the measurement point C acquired at the kth time of the measurement point C and the hanging point A
 And observing sag
 ;
;
Step two, fitting the curve form model G (X) of the X # conducting wire at a fitting unit based on the data group K, wherein G (X): ;
;
step three, acquiring the maximum value of the fitted curve form model G (x) at an output unit and taking the maximum value as the maximum observation sag And output.
By the method, the curve form model G (X) can be acquired through continuous observation at the X # lead and data fitting of a plurality of groups of observation points, and the maximum observation sag of the X # lead can be acquired through solving the maximum value of the fitted curve form model G 。
。
In the second step of this embodiment, the fitting can be performed by the least square method. Therefore, the shape of the overhead conductor can be better attached, and the result is more accurate.
In the present embodiment, the fitting function of the curve form model G (x) can be set to . Therefore, the parabolic shape of the overhead conductor can be better met, and the result is more accurate.
Wherein, 、
、 and
and the coefficients to be found are required for the fitting unit.
In the first step of this embodiment, for the strain section, the relevant data is obtained based on the method in embodiment 1. Therefore, the compensation of the sag observation of the strain section can be better realized.
In the third step of this embodiment, the maximum sag of the N # conductive line adjacent to the X # conductive line is obtained. For the split conductor, the maximum sag of the N # conductor can be obtained based on the method in embodiment 2.
Referring to fig. 13, the present embodiment further provides a dynamic sag data fitting system, which is configured to implement the above-mentioned dynamic sag data fitting algorithm, and includes:
the acquisition unit is used for realizing the first step;
a fitting unit for implementing step two; and
and the output unit is used for realizing the third step.
Through the method, the maximum observation sag can be acquired through fitting.
In addition, the embodiment also provides a dynamic sag data fitting device which is provided with the dynamic sag data fitting system.
In addition, the present embodiment also provides a storage medium, on which a computer program is stored, wherein the computer program is executed to implement the steps of the above-mentioned dynamic sag data fitting method.
Example 4
This embodiment also provides a sag observation method, which is based on the method described in embodiment 1 to realize the maximum observation sag at the X # conductor where the measurement point C is located And obtaining the sag deviation f, and realizing the maximum observation sag of the N # conducting wire adjacent to the X # conducting wire based on the method in the
 embodiment 2 The method (2) is obtained.
In addition, the present embodiment also provides a sag observation system having both the relevant units or modules of embodiments 1 and 2.
Through the method and the system of the embodiment, the relevant parameters of the split conductor of the strain section can be preferably acquired.
Example 5
This embodiment also provides a sag observation method, which replaces step S5 in embodiment 1 with the method in embodiment 3, so that the maximum observation sag can be preferably improved The calculation accuracy of (2).
In addition, the present embodiment also provides a sag observation system having both the relevant units or modules of embodiments 1 and 3.
Example 6
The present embodiment also provides a sag observation method, which is based on the method in embodiment 5 and implements the maximum observation sag of the N # conductive wire adjacent to the X # conductive wire based on the method in embodiment 2 The method (2) is obtained.
In addition, this embodiment also provides a sag observation system having the relevant units or modules in both embodiments 1 and 2 and 3.
It is easily understood that a person skilled in the art can combine, split, recombine and the like the embodiments of the present application to obtain other embodiments on the basis of one or more embodiments provided by the present application, and the embodiments do not go beyond the protection scope of the present application.
The present invention and its embodiments have been described above schematically, without limitation, and what is shown in the drawings is only one of the embodiments of the present invention, and the actual structure is not limited thereto. Therefore, if the person skilled in the art receives the teaching, without departing from the spirit of the invention, the person skilled in the art shall not inventively design the similar structural modes and embodiments to the technical solution, but shall fall within the scope of the invention.
Claims (10)
1. The utility model provides an arc observation method that hangs down with strain insulator section arc compensation, it is to carrying out the arc observation to the X # wire in the strain insulator section that is tower one and tower two in proper order along the circuit direction of advance when observing that hangs down, notes the X # wire and hang the point A and hang point B respectively for the hanging point A of tower one and tower two department, sets up measuring point C at X # wire department and carries out the arc observation time measuring, includes the following step:
step S1, inputting the angle of rotation of a tower I at an input unit Width of pulley at hanging point A
 Length of cross arm
 And cross arm width
 Angle of rotation of tower two
 Width of tackle at hanging point B
 Cross armLength of
 And cross arm width
 And left and right phases of the X # conductor;
wherein, the angle of rotation is Degree of angle of rotation
 When the X # lead is positioned at the first tower and the second tower and turns right along the advancing direction of the circuit, the number is positive, and when the X # lead turns left, the number is negative;
wherein, the X # conducting wire is positioned at the left side of the advancing direction of the circuit and is a left phase, and the X # conducting wire is positioned at the right side of the advancing direction of the circuit and is a right phase;
s2, acquiring the actual span between the hanging point A and the hanging point B of the X # conductor through a computing unit When the X # conducting wire is in the left phase,

when the X # conducting wire is in the right phase,

step S3, formula-based calculation unit Acquiring the height difference between the projection point of the measuring point C on the connecting line of the hanging points A and B and the hanging point A;
wherein, is the height difference between the hanging point A and the hanging point B,
 the horizontal distance between the measuring point C and the hanging point A is measured;
step S4, based on formula through the calculating unit Obtaining the observed sag of the X # wire
 (ii) a Wherein,
 is the height of the hanging point A and is,
 in order to measure the height of the point C,
 the height difference between the measuring point C and the X # conducting wire is measured;
step S5, formula-based calculation unit Obtaining maximum observed sag
 And based on a formula
 Obtaining maximum standard sag
 (ii) a Wherein r is the wire specific load, and T is the wire tension;
s6, acquiring and outputting the sag deviation f through a processing unit, wherein f = -
- 。
。
2. The sag observation method with strain section sag compensation according to claim 1, wherein the strain section sag compensation comprises the following steps: the calculating unit in the step S2 is provided with a first calculating module, a second calculating module, a third calculating module and an accumulating module, wherein the first calculating module, the second calculating module and the third calculating module are used for respectively obtaining the segment values of the X # conductor in the near-tower first section, the near-tower second section and the middle section, and the accumulating module is used for accumulating all segment calculated values to obtain the actual span (ii) a The method specifically comprises the following steps of,
step S21, the actual gear distance of a section close to the tower is calculated through a first calculation module When the X # conducting wire is in the left phase,
 (ii) a When the X # conducting wire is in the right phase,
 ;
;
step S22, the actual gear distance of the second tower section is approached through the second calculation module When the X # conducting wire is in the left phase,
 (ii) a When the X # conducting wire is in the right phase,
 ;
;
step S23, calculating the actual gear distance of the middle section of the module through the third calculation module ,
, ;
;
Step S24, acquiring the actual gear distance through an accumulation module ,
, ;
;
Wherein, L1 and L2 are respectively set reference values of the X # conductor at a near-tower section and a near-tower section.
3. The sag observation method with strain section sag compensation according to claim 1, wherein the strain section sag compensation comprises the following steps: in step S3, the calculation unit is based on a formula Acquiring the horizontal distance between the measuring point C and the hanging point A
 (ii) a Wherein,
 is the center point of the tower I
 The distance between the hanging point A and the hanging point A on the horizontal projection plane,
 is the center point of the tower I
 The distance from the measuring point C on the horizontal projection plane,
 is composed of
 A projection angle on the horizontal projection plane;
wherein the calculation unit is based on a formula Obtaining a distance
 。
。
4. The sag observation method with strain section sag compensation according to claim 3, wherein the strain section sag compensation comprises the following steps: in step S3, the calculation unit is based on a formula Obtaining a projection angle
 (ii) a Wherein,
 is the center point of the tower II
 The distance from the measuring point C on the horizontal projection plane,
 is the center point of the tower I
 The center point of the tower II and the tower
 Distance on the horizontal projection plane.
5. The sag observation method with strain section sag compensation according to claim 1, wherein the strain section sag compensation comprises the following steps: when the X # conductor is a split conductor, the parameters input at the input unit in step S1 further include a branchPhase number of split conductor, phase n of X # conductor and spacing between adjacent sub-conductors (ii) a The phase n of the X # conducting wire is counted according to the arrangement mode at the spacing rod, wherein the number of the sub-conducting wires at the lowest side of the leftmost side of the spacing rod is n = 1; in step S6, the processing unit provides a sag compensation value through a sag compensation module
 The processing unit is based on the formula f =
 -(
-( +
+ ) And acquiring sag deviation f.
6. The sag observation method with strain section sag compensation according to claim 5, wherein the strain section sag compensation comprises the following steps: sag compensation values for n =1 and n =4 when the number of phases of the split conductor is four Is composed of
 (ii) a Sag compensation values for n =2 and n =3
 Is composed of
 。
。
7. The sag observation method with strain section sag compensation according to claim 5, wherein the strain section sag compensation comprises the following steps: when the number of phases of the split conductor is six, forn =1 and n =6, sag compensation value Is composed of
 (ii) a Sag compensation values for n =3 and n =4
 Is composed of
 (ii) a Sag compensation values for n =2 and n =5
 Is composed of
 。
。
8. The sag observation method with strain section sag compensation according to claim 5, wherein the strain section sag compensation comprises the following steps: sag compensation values for n =1 and n =8 when the number of phases of the split conductor is eight Is composed of
 (ii) a Sag compensation values for n =2 and n =7
 Is composed of
 (ii) a Sag compensation values for n =3 and n =6
 Is composed of
 (ii) a Sag compensation for n =4 and n =5Value of
 Is composed of
 。
。
9. A sag observation device for implementing the sag observation method according to any one of claims 1 to 8, comprising:
an input unit for enabling input of relevant data including step S1;
a calculation unit for implementing calculation of the relevant data including steps S1-S5; and
a processing unit for implementing the processing of the relevant data including step S6.
10. A sag observation system having a sag observation device as set forth in claim 9.
Priority Applications (1)
| Application Number | Priority Date | Filing Date | Title |
|---|---|---|---|
| CN202211588313.4A CN115600049B (en) | 2022-12-12 | 2022-12-12 | Sag observation method, device and system with strain section sag compensation function |
Applications Claiming Priority (1)
| Application Number | Priority Date | Filing Date | Title |
|---|---|---|---|
| CN202211588313.4A CN115600049B (en) | 2022-12-12 | 2022-12-12 | Sag observation method, device and system with strain section sag compensation function |
Publications (2)
| Publication Number | Publication Date |
|---|---|
| CN115600049A CN115600049A (en) | 2023-01-13 |
| CN115600049B true CN115600049B (en) | 2023-03-10 |
Family
ID=84853500
Family Applications (1)
| Application Number | Title | Priority Date | Filing Date |
|---|---|---|---|
| CN202211588313.4A Active CN115600049B (en) | 2022-12-12 | 2022-12-12 | Sag observation method, device and system with strain section sag compensation function |
Country Status (1)
| Country | Link |
|---|---|
| CN (1) | CN115600049B (en) |
Citations (1)
| Publication number | Priority date | Publication date | Assignee | Title |
|---|---|---|---|---|
| CN109870108A (en) * | 2019-02-28 | 2019-06-11 | 北京国网富达科技发展有限责任公司 | Powerline ice-covering detection method and device |
Family Cites Families (1)
| Publication number | Priority date | Publication date | Assignee | Title |
|---|---|---|---|---|
| US9054531B2 (en) * | 2011-07-19 | 2015-06-09 | Carnegie Mellon University | General method for distributed line flow computing with local communications in meshed electric networks |
-
2022
- 2022-12-12 CN CN202211588313.4A patent/CN115600049B/en active Active
Patent Citations (1)
| Publication number | Priority date | Publication date | Assignee | Title |
|---|---|---|---|---|
| CN109870108A (en) * | 2019-02-28 | 2019-06-11 | 北京国网富达科技发展有限责任公司 | Powerline ice-covering detection method and device |
Non-Patent Citations (5)
| Title |
|---|
| 《基于三维模型比对的输电线路弧垂检测方法》;杜长青等;《电网与清洁能源》;全文 * |
| 《基于卫星定位技术的输电线路弧垂观测施工工法与应用》;韩启云等;《电力自动化》;全文 * |
| 《架空输电线路弧垂观测装置内置算法研究》;刘云飞等;《科技创新与应用》;全文 * |
| 《架空输电线路施工实时动态检测系统设计与实现》;王军龙等;《河南科技》;全文 * |
| 基于电场逆运算的输电导线弧垂计算方法;陈楠等;《中国电机工程学报》(第16期);全文 * |
Also Published As
| Publication number | Publication date |
|---|---|
| CN115600049A (en) | 2023-01-13 |
Similar Documents
| Publication | Publication Date | Title |
|---|---|---|
| CN101866395B (en) | Method for calculating load of hanging point of power transmission line tower during conductor galloping | |
| CN104236504B (en) | A kind of transmission line of electricity equivalence ice covering thickness monitoring method | |
| CN115577579A (en) | Dynamic sag data fitting algorithm, system, device and storage medium | |
| CN103791894A (en) | Tower positioning method and device for overhead power transmission line | |
| CN107505538A (en) | Half-wavelength power transmission line asynchronous fault positioning method based on line mode voltage traveling wave amplitude attenuation characteristic | |
| CN108489449B (en) | Measuring system and method for continuously monitoring tunnel convergence | |
| CN115600049B (en) | Sag observation method, device and system with strain section sag compensation function | |
| CN107689772A (en) | The evaluation method of the submatrix parallel connection mismatch of photovoltaic plant | |
| CN106767639A (en) | A kind of vertical span obtaining value method under icing operating mode | |
| CN111506946A (en) | Calculation method for designing wind load of conventional power transmission tower and line based on effective load method and tower-line separation method and considering tower-line coupling influence | |
| CN111651805A (en) | Maximum wind deflection angle and wind vibration coefficient calculation method of suspension insulator string by considering linear shape and linear length influence factors | |
| CN106802164A (en) | A kind of absolute flow of water computational methods and cloud atlas generation method suitable for grain condition monitoring | |
| CN115600048B (en) | Sag observation method, device and system with adjacent wire spacing compensation function | |
| CN111985018B (en) | Calculation method for ultrahigh large-span tower and line wind load based on inertial force method and tower line separation method and considering tower line coupling influence | |
| CN103132412A (en) | Track maintenance base point lateral deviation measuring method based on Helen formula | |
| CN112345877B (en) | High-precision time base and distance weight combined power transmission line fault positioning method | |
| CN112287424B (en) | Calculation method for designing wind load of ultrahigh large-span tower and line based on effective load method and tower line separation method and considering tower line coupling influence | |
| CN110865270B (en) | 220kV power transmission line counterattack trip-out rate test method under lightning stroke | |
| CN108061666A (en) | A kind of power transmission tower damnification recognition method | |
| CN106202752B (en) | A kind of alternate shortest distance algorithm of the asynchronous wind pendulum of transmission line of electricity | |
| CN107015285A (en) | A kind of bearing calibration for observing apparent resistivity and system | |
| CN107729593B (en) | Method for correcting measured voltage value of insulator detection robot based on support vector machine | |
| CN113064023B (en) | Fault identification method and system for same-tower multi-circuit power transmission line | |
| CN113536674B (en) | Line parameter identification method based on BP neural network and improved SCADA data | |
| CN114357730A (en) | Sound barrier optimization design system and method for reducing transformer substation noise |
Legal Events
| Date | Code | Title | Description |
|---|---|---|---|
| PB01 | Publication | ||
| PB01 | Publication | ||
| SE01 | Entry into force of request for substantive examination | ||
| SE01 | Entry into force of request for substantive examination | ||
| GR01 | Patent grant | ||
| GR01 | Patent grant |