Disclosure of Invention
To at least partially solve one of the technical problems in the prior art, an object of the present invention is to provide a method, a system, a device and a medium for cellular traffic prediction.
The technical scheme adopted by the invention is as follows:
a method of cellular traffic prediction, comprising the steps of:
acquiring cellular traffic data;
sequentially carrying out feature extraction on the cellular flow data from three visual angles, namely a global space visual angle, a global time visual angle and a local space-time visual angle;
predicting the cellular traffic according to the extracted features;
in the global space view, acquiring node-level global spatial correlation and trend-level global spatial correlation of different cellular flow units by adopting an attention mechanism, and fusing the two levels of global spatial correlation; in the global time view, acquiring the global correlation of data of the same cellular flow unit at different historical moments by adopting an attention mechanism; and in the local space-time visual angle, continuously capturing the local space-time correlation after the global space-time correlation is captured by adopting convolution operation.
Further, the acquiring node-level global spatial correlation and trend-level global spatial correlation of different cellular traffic units by using an attention mechanism, and fusing two levels of global spatial correlation includes:
designing a node-level spatial attention module and a trend-level spatial attention module;
by passingAttention mechanism, realizing honeycomb flow chart
Every two points of every two points
Correlation matrix between
Assigning values and finishing the weighting of the collection of the connecting edges between every two points; wherein the correlation matrix
Representing the characteristic similarity between two points, and measuring the spatial correlation between two cellular flow units;
the characteristics of the cellular flow are propagated and aggregated through the weighted edges between the two points to realize the updating of the characteristics;
weighting and summing the features of the two levels, realizing importance evaluation of global correlation of the two levels, and selectively capturing and fusing the global correlation of the two levels;
the node-level spatial attention module is used for acquiring data state similarity of different cellular units at the same single moment, and the trend-level spatial attention module is used for acquiring data change trend similarity of different cellular units in the same continuous time period.
Further, the expression formula of the features obtained by the node-level spatial attention module is as follows:
wherein,
representing a learnable matrix in a linear transformation;
and
representing learnable bias parameters in a linear transformation;
vertex features representing node levels;
the expression formula of the features obtained by the trend-level spatial attention module is as follows:
wherein,
a dimension representing a trend-level feature of all vertices; τ = P-1 denotes P-1 historical moments.
Further, the obtaining of the global correlation of data of the same cellular traffic unit at different historical time by using the attention mechanism includes:
a global time attention module is designed;
realizing honeycomb flow chart by attention mechanism
Middle point and same point
History data of (2)
Correlation matrix between
And completing assignment to the same point
Connected edge aggregation between data at different historical moments
Weighting of (2); wherein the correlation matrix
The characteristic similarity between the data at the same point and different historical moments is expressed, and the time correlation between the data at different historical moments of the same cellular flow unit is measured;
the characteristics of the cellular flow are propagated and aggregated through the weighted edges between the two historical moments, so that the updating of the characteristics is realized, and the interaction between the same point and different historical moments is completed;
features from different historical moments are integrated through information integration operation, fusion of the features from different historical moments is achieved, and capture of global time correlation is completed.
Further, the following formula is used to embed the global temporal correlation information:
wherein,
representing a vertex v
l The characteristics at the time instant m are,
the normalized attention weight is represented,
represents a learnable matrix will
Mapping to a high-dimensional space s, W
fc ∈R
Sd×D Express a plurality ofA learnable matrix added after the head attention operation; the vertex features for the P time instants that ultimately embed the global temporal correlation can be expressed as
Where gt represents the global temporal correlation and gs represents the global spatial correlation.
Further, the continuously capturing the local spatio-temporal correlation after the capturing of the global spatio-temporal correlation by using the convolution operation includes:
designing a dense connection convolution module, wherein the input of the dense connection convolution module is a cellular flow characteristic embedded with global space-time characteristics;
performing iterative convolution operation on the cellular flow characteristic diagram through a convolution kernel to realize the excavation of local characteristics;
the output characteristics of the dense connection convolution module are embedded with the multi-scale local space aggregation characteristic of cellular traffic, so that prediction is sensitive to local space dependency of different cellular traffic units;
the characteristics output by the local space-time visual angle are used for predicting the cellular flow.
Further, each convolutional layer in the densely connected convolutional module is connected to other layers, wherein the ith convolutional layer takes as input the output of all previous convolutional layers, and is represented as:
wherein f (-) represents a series of operations in the module, including batch normalization, reLU activation function and convolution operation, which are to be executed in sequence;
is to
Formed by all vertices in the cellular traffic network graph after dimension transformationAnd (5) feature diagrams.
The other technical scheme adopted by the invention is as follows:
a system for cellular traffic prediction, comprising:
a data acquisition module for acquiring cellular traffic data;
the feature extraction module is used for sequentially extracting features of the cellular flow data from a global space view angle, a global time view angle and a local space-time view angle;
the flow prediction module is used for predicting the cellular flow according to the extracted features;
in the global space view, acquiring node level global space correlation and trend level global space correlation of different cellular flow units by adopting an attention mechanism, and fusing the two levels of global space correlation; in the global time view, acquiring the global correlation of the data of the same cellular flow unit at different historical moments by adopting an attention mechanism; and in the local space-time visual angle, continuously capturing the local space-time correlation after the global space-time correlation is captured by adopting convolution operation.
The invention adopts another technical scheme that:
an apparatus for cellular traffic prediction, comprising:
at least one processor;
at least one memory for storing at least one program;
when executed by the at least one processor, cause the at least one processor to implement the method described above.
The other technical scheme adopted by the invention is as follows:
a storage medium having stored therein a processor-executable program which, when executed by a processor, is for performing the method as described above.
The beneficial effects of the invention are: according to the method, the time-space correlation of the cellular flow is comprehensively captured from a global space visual angle, a global time visual angle and a local time-space visual angle, so that the complete modeling of the time-space characteristics of the cellular flow is realized, and the accuracy of the cellular flow prediction is improved.
Detailed Description
Reference will now be made in detail to embodiments of the present invention, examples of which are illustrated in the accompanying drawings, wherein like reference numerals refer to the same or similar elements or elements having the same or similar functions throughout. The embodiments described below with reference to the accompanying drawings are illustrative only for the purpose of explaining the present invention and are not to be construed as limiting the present invention. For the step numbers in the following embodiments, they are set for convenience of illustration only, the order between the steps is not limited at all, and the execution order of each step in the embodiments can be adapted according to the understanding of those skilled in the art.
In the description of the present invention, it should be understood that the orientation or positional relationship referred to in the description of the orientation, such as the upper, lower, front, rear, left, right, etc., is based on the orientation or positional relationship shown in the drawings, and is only for convenience of description and simplification of description, and does not indicate or imply that the device or element referred to must have a specific orientation, be constructed and operated in a specific orientation, and thus, should not be construed as limiting the present invention.
In the description of the present invention, the meaning of a plurality of means is one or more, the meaning of a plurality of means is two or more, and larger, smaller, larger, etc. are understood as excluding the number, and larger, smaller, inner, etc. are understood as including the number. If there is a description of first and second for the purpose of distinguishing technical features only, this is not to be understood as indicating or implying a relative importance or implicitly indicating the number of technical features indicated or implicitly indicating the precedence of technical features indicated.
In the description of the present invention, unless otherwise explicitly limited, terms such as arrangement, installation, connection and the like should be understood in a broad sense, and those skilled in the art can reasonably determine the specific meanings of the above terms in the present invention in combination with the specific contents of the technical solutions.
The existing cellular classical traffic prediction models including a differential autoregressive moving average model ARIMA, a support vector regression model SVR and a sequence-based deep learning model LSTM cannot completely extract features from space and time, so that the prediction capabilities of the models have certain limitations. To this end, the present embodiment provides a multi-view-based full space-time graph neural network (MVSTGN) that aims to achieve complete modeling of cellular traffic characteristics from various space-time perspectives.
As shown in fig. 1, the multi-view-based full-time space-time graph neural network MVSTGN is a graph neural network that combines an attention mechanism and a convolution operation, and sequentially performs feature extraction on input cellular traffic data from three views, wherein the attention mechanism is applied at a global space and a global time view, and the convolution operation is applied at a local time-space view.
First, from a global spatial perspective, a node-level (node-level) spatial attention module and a trend-level (tend-level) spatial attention module are respectively designed in the MVSTGN. The two spatial attention modules respectively pay attention to the data state similarity of different cellular units at the same single moment and the data change trend similarity of different cellular units in the same continuous time period. MVSTGN implementation vs. cellular flow mapping by attention mechanism
The correlation matrix between every two points v in the
And completes the weighting of epsilon. Here the correlation matrix

Representing the characteristic similarity between two points and measuring the spatial correlation between two cellular traffic units. Then, the characteristics of the cellular traffic are propagated and aggregated through the weighted edges between the two points, so that the updating of the characteristics is realized. Thus, each vertex obtains context information, and the interaction between two points is completed. Through the operation, the characteristics of the two points with high characteristic similarity tend to be consistent, and finally the model tends to output a similar prediction result. After the node-level global spatial correlation and the trend-level global spatial correlation are respectively captured, the cellular traffic respectively realizes feature update. The MVSTGN then integrates the output features from the two levels of attention modules by gating the fusion module. The gating fusion module weights and sums the features of the two levels through a gating selection mechanism, so that the importance evaluation of the global correlation of the two levels is realized, and the global correlation of selectively capturing and fusing the two levels is made.
Second, from a global temporal perspectiveThe MVSTGN designs the global temporal attention module. The global time attention module focuses on data state similarities of the same cell at different historical times. MVSTGN implementation vs. cellular flow mapping by attention mechanism
Historical data of the same point v
Correlation matrix between
And complete the pair
The weighting of (2). Here the correlation matrix

The characteristic similarity between the data of the same point at different historical moments is shown, and the time correlation between the data of the same cellular traffic unit at different historical moments is measured. And then, the characteristics of the cellular traffic are propagated and aggregated through the weighted edges between the two historical moments to realize the updating of the characteristics, and at the moment, the characteristics obtain context information to finish the interaction between different historical moments at the same point. Through the operation, the characteristics of the two historical moments with high characteristic similarity tend to be consistent, and similar influences are generated on the prediction of the last future moment. And finally, the MVSTGN integrates the characteristics from different historical moments through information integration operation, so that the fusion of the characteristics from different historical moments is realized, and the capture of the global time correlation is completed.
Finally, from a local spatio-temporal perspective, the MVSTGN designs a densely connected convolution module. The densely connected convolution module focuses on the spatial aggregation characteristic that the cellular traffic network shows more stable at different moments, and the spatial aggregation characteristic is local. The input to this module is the cellular traffic characteristics that have been embedded with global spatiotemporal characteristics. Iterative convolution operation is carried out on the closely-arranged cellular flow characteristic diagram through a convolution kernel, and the local characteristic is mined. By changing the size of the convolution kernel and stacking convolution layers, the model receptive field is enlarged, and the excavation of multi-scale local features is realized. The transmission of features between convolutional layers is enhanced by densely connecting convolutional layers, and the number of parameters is reduced to a certain extent. Through the operation, the output characteristic of the module is embedded into the multi-scale local space aggregation characteristic of the cellular traffic, so that the prediction of the last future moment is sensitive to the local space dependency relationship of different cellular traffic units.
The MVSTGN will use the features of the local spatio-temporal view output to give the final prediction. The overall multi-view architecture of MVSTGN is shown in FIG. 1.
In the course of the MVSTGN learning process,
as input, it is first fed into a forward propagation block for feature transformation. The forward propagation block at the input end comprises two full-connection layers, and an active function rectification linear unit (ReLU) is added in the middle of the full-connection layers. After passing through the forward propagation block, the characteristic dimension of each point v at time t is changed from 1 to D, and in the setting of MVSTGN, D =12. The data will then be fed into three views in sequence for feature learning. At the output end of MVSTGN, the traffic predicted value of the model at the t +1 moment to all the cellular units is calculated
And mean absolute error of true observations (MAE), i.e.:
where θ represents all learnable parameters in the MVSTGN model. The MVSTGN carries out gradient updating of parameters through an end-to-end (end-to-end) training mode and a back propagation method to obtain an optimized model.
The above-described MVSTGN is explained in detail below with reference to the drawings.
1. Cellular traffic data and analysis
1.1 cellular traffic data set
The Data used in this example is from the Italian telecom Big Data Challenge Data set ("Big Data Change" Dataset, BDC). This data set is selected primarily for two reasons:
(1) The BDC data set is widely used in the cellular traffic prediction task and there are few cellular traffic data sets that are currently disclosed. With the purposes of facilitating experiments and developing extensive comparisons, the BDC data set is the first choice as a high-quality data set;
(2) The BDC data set has the advantages of standard data statistics, rich data and the like. According to the BDC data set, the data of Milan Italy cities are counted, the cities are developed cities with extreme representativeness, the cities are complete in functions and rich in information, the data are extremely representative, and the research on the data set is high in value. The BDC data set comprises honeycomb flow data of Milan in two months (11/1/2013-12/31/2013), can fully meet experimental requirements, and is beneficial to large data analysis. In addition to milan's mobile network data, BDC also contains milan weather, news, social networking and power data, and the multi-source data combination can satisfy the influence of cross-domain data on cellular traffic.
For cellular traffic data as used herein, the BDC data set has several main features:
(1) Data content: three cellular traffic data, short message service data (SMS), call service data (Call), and network service data (Internet);
(2) Data storage form: the data is stored in the form of a 100 x 100 grid representing a milan city divided on average into 100 x 100 geographic cells, where each cell represents a 235 mx 235m geographic area, each cell having a unique ID, as shown in fig. 2, where the numbers in fig. 2 are cell IDs;
(3) Counting the time length of data: counting data once every 10 minutes in each geographic unit, wherein the counting time range is from 11 months and 1 day 0 in 2013 to 12 months and 31 days and 24 days in 2013;
(4) The data statistics mode is as follows: the statistics generate the number of Call Detail Records (CDRs) for a unit every 10 minutes. For SMS and Call traffic, the receive or send data is recorded each time a unit is generated. For Internet traffic, each time an intra-cell Internet connection is initiated or terminated is recorded.
1.2 cellular traffic data analysis
In order to verify that the urban cellular traffic has correlation in both the time dimension and the space dimension, the following two methods are respectively adopted:
(1) Time dimension data correlation: we evaluate the correlation of the unit (h, w) continuous T time data by autocorrelation coefficient (autocorrelation coefficient), which can be expressed as:
wherein,
represents the average value of the flow data of the unit (h, w) from
time 0 to time T. All SMS cellular traffic data autocorrelation calculations are represented by fig. 3, where as shown in fig. 3, cellular traffic exhibits a non-zero autocorrelation in the time dimension, indicating that prediction of future traffic by historical cellular traffic data is of research value. In fig. 3, the abscissa represents the time delay, and the ordinate represents the autocorrelation coefficient.
(2) Spatial dimension data correlation: we evaluate the data correlation of the cell (h, w) and the cell (h ', w') at a certain time by calculating the Pearson correlation coefficient ρ (Pearson correlation coeffi-cient). The pearson correlation coefficient is widely used to evaluate spatial correlation and can be expressed as:
where cov () denotes the covariance operation and σ denotes the standard deviation operation. After solving the pearson correlation coefficient for part of the cell SMS cellular traffic data, as shown in fig. 4, it can be seen that there is a spatial correlation for the cellular traffic data in different cells, and the spatial correlation does not keep consistent with the spatial distance. In fig. 4, the target unit is (4, 4), and the unit represents the correlation coefficient.
2. Cellular traffic prediction problem description
For a particular type of cellular data (SMS, call, internet), the city-wide traffic data at T instants is represented as a sequence of spatio-temporal matrices of length T
Wherein
Can be further expressed as:
wherein,
represented as a set of city-wide traffic cells,
representing a cellular unit v
(i,j) And (4) counting the flow data at the time t. Matrix array
Is a formulaic representation of fig. 2.
In this embodiment, we will
Further defined as a cellular flow chart at time t
Wherein each cell is represented as a point (vertex) for any one cell
Wherein
M = N × N. Each v contains sequence data of length T
Wherein v is
l =v
(i,j) L = (i-1) × N + j, this representation is because the dot relative positional relationship is ignored in the diagram structure:
represents a set of connected edges (edge) between each two points;
a correlation matrix is represented that is representative of,
each edge in epsilon is weighted and the correlation between two points is measured. In addition, we define the data of different historical moments for the same point v
Between the edge sets of the connection
Wherein τ represents an arbitrary time length; is defined at epsilon
t Is related to
And measuring the relevance of different points at different moments. In this embodiment, the goal of MVSTGN to implement urban cellular traffic prediction is to output a cellular traffic prediction value at time t +1 given historical urban cellular traffic data observed at P consecutive times before time t. Cellular traffic prediction is based on a complete modeling of the cellular traffic network spatio-temporal characteristics, so the cellular traffic prediction problem can be formulated as:
wherein
Indicating cellular traffic cell v
(i,j) Historical data at P past times, including unit v
(i,j) Time-related characteristics between different historical time data;
historical data representing all cellular traffic cells in the city-wide area at the past P times, including spatially correlated features between all cells in the same time dimension; f represents the feature extraction operation in the MVSTGN, and realizes the capture of the space-time characteristics of the cellular traffic network.
3. MVSTGN structure
3.1 Global spatial View
In cellular traffic, the global spatial correlation can be expressed as a weighted connection (i.e., a weighted edge) between every two vertices, which is dynamically changing with the characteristics of the two points. It is clear that a fixed-weight fully connected graph is not suitable for modeling the global spatial correlation that changes over time, so MVSTGN employs an attention mechanism to dynamically assign different weights to connections. In particular, two carefully designed attention modules are included within the global spatial perspective to capture global spatial correlations from the node level and the trend level, respectively. In addition, the global spatial perspective also comprises a gating fusion module which is used for selectively integrating spatial correlation of different levels.
The attention mechanism is chosen to determine the connections between vertices, based primarily on the following advantages:
(1) Compared with a mode of independently extracting features point by a multilayer perceptron (MLP), the attention mechanism realizes interaction between points. The attention mechanism determines the affinity of two-point features by calculating the Euclidean distance of the two-point features in a high-dimensional space, obtains attention weight, and aggregates the features of the points through the attention weight, so that the points interact with each other, and connection is determined between the two points.
(2) Compared with a mode of giving the same weight to points at different positions in a convolution kernel when the features are extracted through convolution (convolution), the attention mechanism dynamically distributes the weight according to the feature affinity, so that the mutual attention degree of similar features is higher, and the interference of noise is avoided. Furthermore, the attention mechanism guarantees that the interaction between all points is preserved by the last softmax operation. And compared with the method that the convolution operation is limited to extract features in a local receptive field, the attention mechanism can conveniently acquire global correlation.
(3) Compared with the characteristics of a multilayer perceptron and a convolution operation for calculating the learning parameters in a bit-by-bit mode, the attention mechanism calculates the parameters according to the characteristics of input information. When the location of the same input information changes, the attention weight does not change, which is obviously suitable for determining the correlation between two cellular traffic cells over time.
(4) The attention mechanism can construct multi-head attention (multi-head attention) in a parallel superposition mode, focus on various different information in the features, enable the correlation between two points to be more possible, and improve the robustness of the model.
3.1.1 node level attention Module
In this embodiment, we name the global spatial correlation determined by the traffic state similarity at a single instant as the node-level global spatial correlation. In general, the global spatial correlation at the node level is dynamically changing over time. For example, urban business and residential areas may experience consistent cellular traffic peaks at some point during the night, but may vary significantly during the day due to different user densities. Such spatial correlation at the node level is apparently not constrained by the distance between the units and exists globally. Therefore, we designed a node level attention module in this section to capture the global correlation between different cells due to traffic state similarity.
As shown in FIG. 5, first a learnable linear transformation matrix is passed
And
will be input into
Mapping to multiple d-dimensional spaces to generate linearly transformed features
And
where S ∈ {1, \8230;, S } represents a different d-dimensional mapping space, S being the total number of multidimensional spaces. Then by calculating each
And all of
The independent scale dot product (scaledot-product) obtains the weight of the edge between every two vertexes in different mapping spaces
The above operation can be expressed as:
wherein,
the importance of vertex n to vertex l in space s is indicated. Then, we regularize the weights by applying the softmax function and obtain every two vertex features in space s
Self attention (self) matrix between
Namely:
wherein,
is a self-attention moment array
The elements of (a) and (b),
is the normalized attention weight, with a value range of (0, 1). Self-attention from S mapping spaces
Multi-head attention A is formed by serial operation (collocation)
t This ensures that the various hidden dependencies are captured and stabilizes the learning process. Through the above operations, the weights of the edges between the vertices exhibit dynamically diverse distributions. Then, by calculating the vertex feature and
and adding residual connection (residual connection) to make the vertex feature
Aggregating the features of other points and implementing the updates, namely:
wherein,
representing vertex features
A learnable matrix mapped to space s; w is a group of
fc ∈R
Sd×D Is a learnable matrix; () represents element multiplication operations and | l represents concatenation operations. Through the formula (3-3), each vertex captures the relevance information from other points, the feature updating is realized, and the vertex features with high relevance tend to be consistent.
After the above attention operation, the vertex feature is input into a position-wise feed-forward network (position-wise feed-forward network), and the same operation is performed on the vertex feature vector of each position, so that the correction on the vertex feature is realized. The bitwise feedforward network comprises two linear transformations, which comprise a ReLU activation function operation in between. Another residual join operation is then added to the vertex feature. Finally, the features of each vertex encode the global spatial correlation from the node level, which can be finally expressed as:
wherein,
representing a learnable matrix in a linear transformation,
and
representing a learnable bias (bias) parameter in a linear transformation. Finally, the above operation will be viewed as one attention layer, and the MVSTGN achieves stable capture of relevance by tiling multiple attention layers. The above process is illustrated in fig. 5.
3.1.2 Trend level attention Module
Cellular traffic typically fluctuates widely over time series, so the global spatial correlation at the node level varies greatly over different time intervals. At the same time, we have observed that the traffic of different cells may remain similar over a continuous period of time. For example, the business districts in different areas of a city tend to show similar trends in change over the same period of time, which means that there is a richer global spatial correlation in the cellular traffic network. From this observation, we refer to the global spatial correlation arising from the similarity of the flux variation patterns in different cells in continuous time as the global spatial correlation of trend levels. To this end, we propose a trend level attention module for capturing the similarity between the trend level features and the trend level features for each vertex in the cellular flow graph.
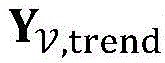
Specifically, the trend level characteristic of each vertex can be obtained by concatenating the flow data of the vertices over the historical time, as follows:
wherein,
similar to the operations in the node-level attention module, the trend-level attention module aggregates and updates the trend-level features of all vertices from a global spatial perspective by employing the same multi-headed attention operation
Finally, the process is carried out in a batch,
will be evenly split into trend grade vertex features at P moments
This is also the final output of the trend level attention module. The above process can be seen in fig. 1.
3.1.3 gated fusion Module
After capturing node-level and trend-level global correlations of cellular traffic through two attention modules, respectively, a gated fusion module is designed, information streams output by the node-level and trend-level attention modules are selected and fused in a self-adaptive mode, and selective capture and fusion of the two levels of global correlations are achieved. The gated fusion process can be formulated as:
wherein gs represents the global spatial correlation and Z learns the assigned weights. Z is obtained by the following formula,
wherein σ (·) denotes a sigmoid activation function,
and
representing a learnable matrix. The gated fusion module is shown in fig. 6. Through the above processes, the MVSTGN completes capture of the global correlation of the cellular traffic from the perspective of the global space, and outputs the vertex features with the global correlation.
4. Global temporal perspective
Unlike other types of traffic, cellular traffic exhibits a significant bursty character in the time dimension. For example, in urban road traffic, the congestion condition at the previous moment may affect the traffic flow at the next moment, i.e. the road traffic flow has a delay characteristic, which results in higher dependency on the traffic flow of the road approaching at the previous moment. However, the cellular flow does not have the characteristic, and the curve of the cellular flow along the time dimension has obvious abrupt change. This illustrates that sequence-based deep learning models RNN, LSTM, GRU, etc., which aim to capture the time dependency, do not model the temporal behavior of cellular traffic very well. The attention mechanism ignores the position relation among data, and dynamically determines the correlation among different data according to the data characteristics. Therefore, the interference of data mutation at the near moment can be weakened through the attention mechanism. In view of the above analysis, we have designed a global temporal attention module to capture global temporal correlations between traffic data at different times, from a global temporal perspective.
4.1, global temporal attention Module
For vertex
Its historical data P times before t time
As input to a global temporal attention module, wherein,
global spatial correlation information has been gained from global spatial view angle \31447. Next, a multi-headed attention mechanism as shown in FIG. 5 is applied to obtain the correlation matrix
To represent the importance of the traffic data at time m to the traffic data at time n, where m, n e { t- | τ = P-1, P-2, \ 8230;, 0}. Thereafter, the vertex v
l The features at the n moment aggregate the features at other moments according to the relevance weight to realize the embedding of the global time relevance information, which is as follows:
wherein,
representing a vertex v
l The characteristics at the time instant m are such that,
represents a learnable matrix will
Mapping to a high dimensional space s, W
fc ∈R
Sd×D Showing the learnable matrix added after a multi-headed attention operation. The vertex features for the P time instants that ultimately embed the global temporal correlation can be expressed as
Where gt represents the global temporal correlation.
Further, the MVSTGN performs multi-layer stacking of the above three types of attention modules, and completes embedding of global spatial and temporal correlations, and the output dimension of each layer is consistent with the original input dimension. Finally, features from different historical moments are integrated through time information integration operation within the global time perspective. The time information integration operation comprises two full connection layers, and a ReLU activation function is added between the full connection layers as follows:
wherein,
representing the output after the integration of the time information, the output characteristics having put global spatio-temporal correlation information in,
features that represent that v has been owed to the global spatio-temporal correlation of coal by ten at times t-P +1 to t,
representing a learnable matrix. After that time, the user can use the device,
will be sent into local space-time view angles and capture the local space-time correlation of cellular traffic through a densely connected convolution module. The three global spatiotemporal attention modules capture attention operating ranges and processes are shown in FIG. 7.
5. Local spatiotemporal views
We mention that cellular traffic has significant local aggregation properties, which indicates that there is a significant local dependency between cellular traffic cells. This local dependency is directly related to the location of the flow cell and remains relatively consistent at different times. The Convolutional Neural Network (CNN) can realize the extraction of features in a local receptive field range through the convolution operation of a kernel, and the superior performance of the CNN has been widely recognized in the deep learning field. Therefore, we employ a densely connected convolution module to further capture local space-time correlations in the cellular traffic network.
5.1 densely connected convolution Module
Output of global spatiotemporal attention Module
First of all, via a dimension changing operation, and in accordance with the cell ID mentioned at 3.1
Densely packing, generating input features of densely packed convolution modules
As shown in fig. 8, each convolutional layer in the densely connected convolutional module is connected to other layers, where the blocks in fig. 8 represent different scale convolution operations to extract the local spatial dependency of the cellular traffic network. Thus, the l-th convolutional layer takes as input the outputs of all the previous convolutional layers, which can be expressed as:
where f (-) represents a series of operations in the module, including batch normalization, reLU activation functions and convolution operations, which are to be performed sequentially.
Is to
After the dimension transformation operation, the feature map composed of all the vertexes in the cellular traffic network map, which has been encoded with the spatiotemporal correlation in the attention module. By creating shorter paths from convolutional layers near the input to convolutional layers near the output, the connection in the densely connected convolutional module effectively enhances feature propagation, reduces the likelihood of gradient vanishing, effectively utilizes early features of the data, and has fewer parameters than other types of convolutional networks. The final output of the densely connected convolution module obtains a final prediction result through a sigmoid activation function
6. Prediction of results and analysis
Table 1, table 2 and Table 3 show the predictive effect of MVSTGN on three types of cellular traffic data (SMS, call, internet), respectively, with the evaluation using three indices RMSE, MAE and R2. The experimental data demonstrates that the predictive performance of MVSTGN is superior to the comparative model and significantly improved on all indices.A fair comparison without additional information (cross-domain data or metadata) participating in the prediction results in RMSE:15% and MAE:23% on SMS traffic, respectively, RMSE:23% and MAE:17% on Call traffic, RMSE:5% and MAE:6% on Internet traffic, and a significant improvement in MAE:6% on STCNet with additional information participating in the prediction.
TABLE 1
Note: MVSTGN versus predictive capabilities of the comparative model for SMS cellular traffic. The evaluation indexes adopted are RMSE, MAE and R2.wlo denotes "without", w/denotes "with", "cross" denotes cross-domain data, and "meta" denotes metadata. The data in the table show that the optimal prediction effect of MVSTGN is achieved.
TABLE 2
Note: MVSTGN versus predictive capability of the comparative model for Call cellular traffic. The evaluation indexes adopted are RMSE, MAE and R2.wlo denotes "with out", w/denotes "with", "cross" denotes cross domain data, and "meta" denotes metadata. The data in the table show that the optimal prediction effect of MVSTGN is achieved.
TABLE 3
Note: MVSTGN and comparative model prediction capability for Internet cellular traffic. The evaluation indexes adopted are RMSE, MAE and R2.wlo denotes "without", w/denotes "with", "cross" denotes cross-domain data, and "meta" denotes metadata. The data in the table show that the optimal prediction effect of MVSTGN is achieved.
Still further, we have made a more extensive and interesting comparison, and we apply the latest road network traffic prediction model GMAN to the cellular traffic prediction task. The GMAN model has an attention-based spatio-temporal codec structure (encoder-decoder). Aiming at the road network flow, a time and space attention module is designed by GMAN, and a leading effect is achieved in a road flow prediction task. We obtained the GMAN implementation code from the public resource repository and developed the experiment in the same configuration as the experiment. GMAN obtained the results in the SMS traffic prediction task RMSE:170.7145, MAE. The experimental result shows that the GMAN model which achieves the leading effect in the road traffic flow prediction task does not perform well in cellular flow prediction. This is because cellular traffic, unlike road traffic, has a more complex dynamic temporal correlation and an ambiguous spatial correlation. For example, the road flow has obvious lag phenomenon in time, so that the time dependence of the traffic flow data is obvious, and the spatial correlation of roads is more definite because of the existence of the connection relation. Therefore, GMAN cannot achieve the leading effect in the task of cellular traffic prediction, which further demonstrates the advancement of MVSTGN based on a comprehensive analysis of cellular traffic spatiotemporal characteristics.
As shown in fig. 9, the present embodiment provides a method for cellular traffic prediction, which includes the following steps:
s1, acquiring cellular flow data;
s2, sequentially extracting features of the cellular traffic data from a global space visual angle, a global time visual angle and a local space-time visual angle;
s3, predicting the cellular flow according to the extracted features;
in the global space view, acquiring node-level global spatial correlation and trend-level global spatial correlation of different cellular flow units by adopting an attention mechanism, and fusing the two levels of global spatial correlation; in the global time view, acquiring the global correlation of the data of the same cellular flow unit at different historical moments by adopting an attention mechanism; and in the local space-time visual angle, continuously capturing the local space-time correlation after the global space-time correlation is captured by adopting convolution operation.
The present embodiment provides a cellular traffic prediction system, including:
the data acquisition module is used for acquiring cellular flow data;
the feature extraction module is used for sequentially extracting features of the cellular flow data from a global space view angle, a global time view angle and a local space-time view angle;
the flow prediction module is used for predicting the cellular flow according to the extracted features;
in the global space view, acquiring node level global space correlation and trend level global space correlation of different cellular flow units by adopting an attention mechanism, and fusing the two levels of global space correlation; in the global time view, acquiring the global correlation of the data of the same cellular flow unit at different historical moments by adopting an attention mechanism; and in the local space-time visual angle, continuously capturing the local space-time correlation after the global space-time correlation is captured by adopting convolution operation.
The embodiment provides a cellular traffic prediction device, including:
at least one processor;
at least one memory for storing at least one program;
when executed by the at least one processor, cause the at least one processor to implement the method of fig. 9.
Embodiments of the present application also disclose a computer program product or computer program comprising computer instructions stored in a computer readable storage medium. The computer instructions may be read by a processor of a computer device from a computer-readable storage medium, and the computer instructions executed by the processor cause the computer device to perform the method illustrated in fig. 9.
The present embodiment also provides a storage medium, which stores instructions or programs for executing the method for cellular traffic prediction provided in the embodiment of the method of the present invention, and when the instructions or the programs are executed, the steps implemented by any combination of the embodiments of the method may be executed, and the corresponding functions and advantages of the method are provided.
In alternative embodiments, the functions/acts noted in the block diagrams may occur out of the order noted in the operational illustrations. For example, two blocks shown in succession may, in fact, be executed substantially concurrently, or the blocks may sometimes be executed in the reverse order, depending upon the functionality/acts involved. Furthermore, the embodiments presented and described in the flow charts of the present invention are provided by way of example in order to provide a more thorough understanding of the technology. The disclosed methods are not limited to the operations and logic flows presented herein. Alternative embodiments are contemplated in which the order of various operations is changed and in which sub-operations described as part of larger operations are performed independently.
Furthermore, although the present invention is described in the context of functional modules, it should be understood that, unless otherwise stated to the contrary, one or more of the described functions and/or features may be integrated in a single physical device and/or software module, or one or more functions and/or features may be implemented in a separate physical device or software module. It will also be appreciated that a detailed discussion of the actual implementation of each module is not necessary for an understanding of the present invention. Rather, the actual implementation of the various functional modules in the apparatus disclosed herein will be understood within the ordinary skill of an engineer given the nature, function, and interrelationships of the modules. Accordingly, those of ordinary skill in the art will be able to practice the invention as set forth in the claims without undue experimentation. It is also to be understood that the specific concepts disclosed are merely illustrative of and not intended to limit the scope of the invention, which is defined by the appended claims and their full scope of equivalents.
The functions, if implemented in the form of software functional units and sold or used as a stand-alone product, may be stored in a computer readable storage medium. Based on such understanding, the technical solution of the present invention or a part thereof which substantially contributes to the prior art may be embodied in the form of a software product, which is stored in a storage medium and includes several instructions for causing a computer device (which may be a personal computer, a server, or a network device) to execute all or part of the steps of the method according to the embodiments of the present invention. And the aforementioned storage medium includes: a U-disk, a removable hard disk, a Read-Only Memory (ROM), a Random Access Memory (RAM), a magnetic disk or an optical disk, and other various media capable of storing program codes.
The logic and/or steps represented in the flowcharts or otherwise described herein, e.g., an ordered listing of executable instructions that can be considered to implement logical functions, can be embodied in any computer-readable medium for use by or in connection with an instruction execution system, apparatus, or device, such as a computer-based system, processor-containing system, or other system that can fetch the instructions from the instruction execution system, apparatus, or device and execute the instructions. For the purposes of this description, a "computer-readable medium" can be any means that can contain, store, communicate, propagate, or transport the program for use by or in connection with the instruction execution system, apparatus, or device.
More specific examples (a non-exhaustive list) of the computer-readable medium would include the following: an electrical connection (electronic device) having one or more wires, a portable computer diskette (magnetic device), a Random Access Memory (RAM), a read-only memory (ROM), an erasable programmable read-only memory (EPROM or flash memory), an optical fiber device, and a portable compact disc read-only memory (CDROM). Additionally, the computer-readable medium could even be paper or another suitable medium upon which the program is printed, as the program can be electronically captured, via for instance optical scanning of the paper or other medium, then compiled, interpreted or otherwise processed in a suitable manner if necessary, and then stored in a computer memory.
It should be understood that portions of the present invention may be implemented in hardware, software, firmware, or a combination thereof. In the above embodiments, the various steps or methods may be implemented in software or firmware stored in memory and executed by a suitable instruction execution system. For example, if implemented in hardware, as in another embodiment, any one or combination of the following technologies, which are well known in the art, may be used: a discrete logic circuit having a logic gate circuit for implementing a logic function on a data signal, an application specific integrated circuit having an appropriate combinational logic gate circuit, a Programmable Gate Array (PGA), a Field Programmable Gate Array (FPGA), or the like.
In the foregoing description of the specification, reference to the description of "one embodiment/example," "another embodiment/example," or "certain embodiments/examples," etc., means that a particular feature, structure, material, or characteristic described in connection with the embodiment or example is included in at least one embodiment or example of the invention. In this specification, schematic representations of the above terms do not necessarily refer to the same embodiment or example. Furthermore, the particular features, structures, materials, or characteristics described may be combined in any suitable manner in any one or more embodiments or examples.
While embodiments of the present invention have been shown and described, it will be understood by those of ordinary skill in the art that: various changes, modifications, substitutions and alterations can be made to the embodiments without departing from the principles and spirit of the invention, the scope of which is defined by the claims and their equivalents.
While the preferred embodiments of the present invention have been illustrated and described, it will be understood by those skilled in the art that various changes in form and details may be made therein without departing from the spirit and scope of the invention as defined by the appended claims.