CN111432720A - ECG-based cardiac ejection fraction screening - Google Patents
ECG-based cardiac ejection fraction screening Download PDFInfo
- Publication number
- CN111432720A CN111432720A CN201880078887.2A CN201880078887A CN111432720A CN 111432720 A CN111432720 A CN 111432720A CN 201880078887 A CN201880078887 A CN 201880078887A CN 111432720 A CN111432720 A CN 111432720A
- Authority
- CN
- China
- Prior art keywords
- ecg
- mammal
- ejection fraction
- computer
- data
- Prior art date
- Legal status (The legal status is an assumption and is not a legal conclusion. Google has not performed a legal analysis and makes no representation as to the accuracy of the status listed.)
- Pending
Links
Images


Classifications
-
- A—HUMAN NECESSITIES
- A61—MEDICAL OR VETERINARY SCIENCE; HYGIENE
- A61B—DIAGNOSIS; SURGERY; IDENTIFICATION
- A61B5/00—Measuring for diagnostic purposes; Identification of persons
- A61B5/72—Signal processing specially adapted for physiological signals or for diagnostic purposes
- A61B5/7235—Details of waveform analysis
- A61B5/7264—Classification of physiological signals or data, e.g. using neural networks, statistical classifiers, expert systems or fuzzy systems
- A61B5/7267—Classification of physiological signals or data, e.g. using neural networks, statistical classifiers, expert systems or fuzzy systems involving training the classification device
-
- A—HUMAN NECESSITIES
- A61—MEDICAL OR VETERINARY SCIENCE; HYGIENE
- A61B—DIAGNOSIS; SURGERY; IDENTIFICATION
- A61B5/00—Measuring for diagnostic purposes; Identification of persons
- A61B5/02—Detecting, measuring or recording pulse, heart rate, blood pressure or blood flow; Combined pulse/heart-rate/blood pressure determination; Evaluating a cardiovascular condition not otherwise provided for, e.g. using combinations of techniques provided for in this group with electrocardiography or electroauscultation; Heart catheters for measuring blood pressure
- A61B5/02028—Determining haemodynamic parameters not otherwise provided for, e.g. cardiac contractility or left ventricular ejection fraction
-
- A—HUMAN NECESSITIES
- A61—MEDICAL OR VETERINARY SCIENCE; HYGIENE
- A61B—DIAGNOSIS; SURGERY; IDENTIFICATION
- A61B5/00—Measuring for diagnostic purposes; Identification of persons
- A61B5/24—Detecting, measuring or recording bioelectric or biomagnetic signals of the body or parts thereof
- A61B5/316—Modalities, i.e. specific diagnostic methods
- A61B5/318—Heart-related electrical modalities, e.g. electrocardiography [ECG]
- A61B5/346—Analysis of electrocardiograms
- A61B5/349—Detecting specific parameters of the electrocardiograph cycle
- A61B5/352—Detecting R peaks, e.g. for synchronising diagnostic apparatus; Estimating R-R interval
-
- A—HUMAN NECESSITIES
- A61—MEDICAL OR VETERINARY SCIENCE; HYGIENE
- A61B—DIAGNOSIS; SURGERY; IDENTIFICATION
- A61B5/00—Measuring for diagnostic purposes; Identification of persons
- A61B5/24—Detecting, measuring or recording bioelectric or biomagnetic signals of the body or parts thereof
- A61B5/316—Modalities, i.e. specific diagnostic methods
- A61B5/318—Heart-related electrical modalities, e.g. electrocardiography [ECG]
- A61B5/346—Analysis of electrocardiograms
- A61B5/349—Detecting specific parameters of the electrocardiograph cycle
- A61B5/366—Detecting abnormal QRS complex, e.g. widening
-
- G—PHYSICS
- G06—COMPUTING; CALCULATING OR COUNTING
- G06N—COMPUTING ARRANGEMENTS BASED ON SPECIFIC COMPUTATIONAL MODELS
- G06N20/00—Machine learning
-
- G—PHYSICS
- G06—COMPUTING; CALCULATING OR COUNTING
- G06N—COMPUTING ARRANGEMENTS BASED ON SPECIFIC COMPUTATIONAL MODELS
- G06N3/00—Computing arrangements based on biological models
- G06N3/02—Neural networks
- G06N3/04—Architecture, e.g. interconnection topology
-
- G—PHYSICS
- G16—INFORMATION AND COMMUNICATION TECHNOLOGY [ICT] SPECIALLY ADAPTED FOR SPECIFIC APPLICATION FIELDS
- G16H—HEALTHCARE INFORMATICS, i.e. INFORMATION AND COMMUNICATION TECHNOLOGY [ICT] SPECIALLY ADAPTED FOR THE HANDLING OR PROCESSING OF MEDICAL OR HEALTHCARE DATA
- G16H40/00—ICT specially adapted for the management or administration of healthcare resources or facilities; ICT specially adapted for the management or operation of medical equipment or devices
- G16H40/60—ICT specially adapted for the management or administration of healthcare resources or facilities; ICT specially adapted for the management or operation of medical equipment or devices for the operation of medical equipment or devices
- G16H40/67—ICT specially adapted for the management or administration of healthcare resources or facilities; ICT specially adapted for the management or operation of medical equipment or devices for the operation of medical equipment or devices for remote operation
-
- G—PHYSICS
- G16—INFORMATION AND COMMUNICATION TECHNOLOGY [ICT] SPECIALLY ADAPTED FOR SPECIFIC APPLICATION FIELDS
- G16H—HEALTHCARE INFORMATICS, i.e. INFORMATION AND COMMUNICATION TECHNOLOGY [ICT] SPECIALLY ADAPTED FOR THE HANDLING OR PROCESSING OF MEDICAL OR HEALTHCARE DATA
- G16H50/00—ICT specially adapted for medical diagnosis, medical simulation or medical data mining; ICT specially adapted for detecting, monitoring or modelling epidemics or pandemics
- G16H50/20—ICT specially adapted for medical diagnosis, medical simulation or medical data mining; ICT specially adapted for detecting, monitoring or modelling epidemics or pandemics for computer-aided diagnosis, e.g. based on medical expert systems
-
- G—PHYSICS
- G16—INFORMATION AND COMMUNICATION TECHNOLOGY [ICT] SPECIALLY ADAPTED FOR SPECIFIC APPLICATION FIELDS
- G16H—HEALTHCARE INFORMATICS, i.e. INFORMATION AND COMMUNICATION TECHNOLOGY [ICT] SPECIALLY ADAPTED FOR THE HANDLING OR PROCESSING OF MEDICAL OR HEALTHCARE DATA
- G16H50/00—ICT specially adapted for medical diagnosis, medical simulation or medical data mining; ICT specially adapted for detecting, monitoring or modelling epidemics or pandemics
- G16H50/70—ICT specially adapted for medical diagnosis, medical simulation or medical data mining; ICT specially adapted for detecting, monitoring or modelling epidemics or pandemics for mining of medical data, e.g. analysing previous cases of other patients
Abstract
Systems, methods, devices, and techniques for estimating ejection fraction characteristics of a mammal. An Electrocardiogram (ECG) procedure is performed on the mammal and a computer system acquires ECG data describing ECG results over a period of time. The system provides ECG data-based predictive input to an ejection fraction predictive model, such as a neural network or other machine learning model. In response, the ejection fraction predictive model processes the input to generate an estimated ejection fraction characteristic of the mammal. The system outputs the estimated ejection fraction characteristics of the mammal for presentation to the user.
Description
Cross Reference to Related Applications
This application claims priority to U.S. application serial No. 62/599,163 filed on 12/15/2017 and U.S. application serial No. 62/569,268 filed on 6/10/2017. The disclosure of this prior application is considered part of the disclosure of the present application and is incorporated by reference into the present application in its entirety.
Technical Field
This document describes computer-based techniques for analyzing physiological electrical data (e.g., electrocardiographic data), such as for estimating ejection fraction characteristics of a patient.
Background
Ejection fraction is a key measure of heart health in humans and other mammals. Ejection fraction generally indicates the amount of blood ejected from the heart by each pump. With each pumping cycle (i.e., a "beat" or "cardiac cycle"), the heart muscle contracts and relaxes to push blood through the subject's arterial system. As the heart relaxes, the ventricles fill with blood. A portion of the blood is then pumped from the ventricle through the aorta and to the arterial system during the systolic phase of the pumping cycle. However, during systole, not all of the blood filling the ventricles during relaxation can be pumped out. The percentage of blood actually ejected from the ventricle during a pumping cycle is referred to as the ejection fraction. Although ejection fraction is typically related only to the measurement of the fraction of blood ejected from the left ventricle, for purposes of this specification, ejection fraction may alternatively refer to the fraction of blood ejected from the left ventricle only, the fraction of blood ejected from the right ventricle only, or the fractions of blood ejected from both the left and right ventricles, to indicate myocardial strength or health.
Ejection fractions greater than about 50-55% are generally considered normal for humans. However, some people suffer (often under unknown circumstances) from a low ejection fraction, for example, at or below the 50-55% range, or suffer from a very low ejection fraction, for example, at or below 35%. This is known as asymptomatic ventricular dysfunction (ASVD). Low or very low ejection fraction is often a marker of severe cardiac complications such as cardiac arrest, sudden death, and various stages of heart failure. When ASVD is diagnosed, there are effective treatments for treating ASVD or for preventing these complications.
Traditionally, an electrocardiogram is used to measure ejection fraction. During echocardiography, the sonographer uses an acoustic transducer to generate images of the heart using specialized techniques. Echocardiography is non-invasive, but typically requires a specialist to perform and interpret the procedure, and expensive equipment and infrastructure, typically located in the patient's healthcare provider's laboratory. Ejection fraction has also been measured using Magnetic Resonance Imaging (MRI) techniques, Computed Tomography (CT) techniques, and nuclear medicine scans. All of which require specially trained personnel and expensive equipment.
Disclosure of Invention
This specification discloses systems, methods, devices, and other techniques for estimating cardiac ejection fraction of a mammal based on an Electrocardiogram (ECG). An electrocardiogram is a measure of the electrical activity of the heart of a mammal. The pumping action of the heart is driven by successive cycles of electrical polarization and depolarization of the heart muscle. The electrical activity may be captured by an electrocardiogram, whereby electrodes are placed on the surface of the subject (e.g., on the chest and limbs of the subject), and the electrical potential between the pair of electrodes over a period of time is measured. The electrical signals captured by this process form an electrocardiogram. When an electrocardiogram is plotted to show the change in electrical potential between the electrodes over time, a waveform or ECG trace showing the polarization and depolarization of the heart can be seen in each of one or more cardiac cycles. For purposes of this specification, an electrocardiogram may include the conventional 12 leads, additional leads, or as few as a single lead of any number of leads. Additionally, the ECG may be acquired from an adhesive electrode, a conductive electrode, a capacitive electrode, a handheld electrode, a wear/garment electrode, a subcutaneous electrode, an electrode adhered to an implanted device, or any combination thereof.
The shape of the ECG waveform is affected by a number of factors. The techniques disclosed herein are premised, in part, on the recognition that a subject's ECG can be influenced by cardiac ejection fraction. For example, a subject with a low or very low ejection fraction may have subtle distortions on one or more portions of the ECG waveform compared to another subject with a normal ejection fraction. The underlying diseases affecting the heart (whether due to atherosclerosis, myopic processes, inflammation, valve disorders from any cause) impair the pumping capacity of the heart muscle. The underlying disease can similarly affect the metabolism of human muscle cells and their interconnections and lead to the deposition of fibrosis or infiltration of inflammatory cells, all of which lead to subtle electrical changes. These local electrical changes of the heart contribute to the deformation of the recordings on the surface ECG. Such deformations may not be visible to the naked eye, but may still be detected using a computer-based model in accordance with the techniques disclosed herein. Accordingly, the present specification describes how a subject's ECG can be used as a screening tool to predict ejection fraction characteristics of a subject. In many scenarios, ECG-based screening may be preferred over measuring ejection fraction by echocardiography or other means. ECG devices are generally more widely available than echocardiography devices and can be performed more quickly without a trained sonographer. Furthermore, consumer ECG devices and home ECG devices (e.g., single lead ECG patches) are becoming more common. Using the techniques disclosed herein, ECG devices in various scenarios (whether clinical or home-use) can be used to increase the number of people screened for low ejection fraction and the frequency of screening. In some cases, if the ECG screening of the subject indicates a sufficient likelihood of a low or very low ejection fraction, further evaluation of the condition may be performed to verify the condition, for example, by using other measurement modalities, such as echocardiography, MRI, or CT scans.
The subject matter disclosed herein includes a computer-implemented method. The method may be performed by a system comprising one or more computers at one or more locations. In some aspects, the system has one or more processors and one or more computer-readable media encoded with instructions that, when executed by the one or more processors, cause the processors to perform the method. Some aspects include only a computer-readable medium encoded with instructions that, when executed, cause the method to be performed.
The method includes receiving, by the system, Electrocardiogram (ECG) data describing an ECG of the mammal over a period of time. The system provides predictive input derived from ECG data to an ejection fraction predictive model. The predictive input can be processed using an ejection fraction predictive model to generate estimated ejection fraction characteristics for the mammal. The system then provides an estimated ejection fraction characteristic of the mammal for output.
These implementations and other implementations can optionally include one or more of the following features.
The ECG data can include one or more channels, each channel including a subset of ECG data that describes a respective lead of the ECG of the mammal over a time period. The predictive input may characterize a respective lead of the ECG for each of one or more channels of the ECG data.
The ECG data can include a plurality of channels, each channel including a subset of the ECG data that describes a respective one of a plurality of leads of the ECG of the mammal over a time period. The predictive input may characterize a plurality of leads of the ECG for each of a plurality of channels of the ECG data.
The time period for the ECG data to describe the ECG of the mammal may span multiple cardiac cycles of the mammal.
The mammal may be a human.
The ejection fraction predictive model may be a regression model, for example, a logistic regression model.
The ejection fraction predictive model may be a machine learning model, such as a neural network (e.g., a feed-forward neural network, a convolutional neural network, or a recurrent neural network).
The ejection fraction model may use clinical characteristics (including age, gender, weight, and/or the presence of measurable disease conditions, such as hypertension and diabetes) as inputs to further improve its output.
The ejection fraction model may also generate additional outputs, such as a risk of death within a determined period of time (e.g., a risk of death in the next year).
The estimated ejection fraction characteristic of the mammal may be a value representing an absolute (e.g., specific) estimate of the ejection fraction of the mammal.
The estimated ejection fraction characteristic of the mammal may be indicative of an estimated range of ejection fractions of the mammal.
Providing the estimated ejection fraction characteristic of the mammal for output may include providing the estimated ejection fraction characteristic for presentation to the mammal or a healthcare provider associated with the mammal.
The method may further include generating the predictive input by determining values for one or more morphological features of an ECG of the mammal. The predictive input may indicate values for one or more morphological features of the ECG of the mammal.
The morphological feature of the ECG of the mammal can include at least one of T wave amplitude, P wave area, T wave left slope, T wave right slope, P wave left slope, P wave right slope, T wave duration, P wave duration, PR interval, QRS duration, QRS amplitude, QRS area, QRS energy, QRS peak-to-peak ratio, or QT segment length.
The ejection fraction predictive model may be personalized for the mammal.
Unless defined otherwise, all technical and scientific terms used herein have the same meaning as commonly understood by one of ordinary skill in the art to which this invention pertains. Although methods and materials similar or equivalent to those described herein can be used in the practice of the present invention, suitable methods and materials are described below. All publications, patent applications, patents, and other references mentioned herein are incorporated by reference in their entirety. In case of conflict, the present specification, including definitions, will control. In addition, the materials, methods, and examples are illustrative only and not intended to be limiting.
The details of one or more embodiments of the invention are set forth in the accompanying drawings and the description below. Other features, objects, and advantages of the disclosure will be apparent from the description and drawings, and from the claims.
Drawings
Fig. 1 is a conceptual diagram of an example system for recording and processing ECG data and using the ECG data to estimate ejection fraction characteristics of a subject.
Fig. 2 is a flow chart of an example process for estimating ejection fraction characteristics of a subject using ECG data.
FIG. 3 is a diagram of an example ECG trace for one heartbeat of a patient. The ECG trace shows the component segments of the beat as well as various morphological waveform features.
Fig. 4 is a flow chart of an example process for selecting and using an appropriate ejection fraction prediction model corresponding to a particular characteristic of a subject.
FIG. 5 is a flow chart of an example process for using ECG-based ejection fraction estimation as a screening tool to determine whether further evaluation is necessary.
Fig. 6 is a flow diagram of an example process for training an ejection fraction prediction model (such as a neural network-based model).
Fig. 7 is a flow chart of an example process for predicting survival of a subject from cardiac conditions, such as low ejection fraction or very low ejection fraction, from ECG data of the subject.
FIG. 8 is a diagram of an example neural network model for estimating ejection fraction characteristics of a subject from ECG data.
Fig. 9 shows the results of a first neural network implementation of an ejection fraction prediction model that classifies patients into multiple cohorts based on whether the patients are predicted to have ejection fractions above or below 50%.
Fig. 10 shows the results of a second neural network implementation of the ejection fraction prediction model that classifies patients into multiple cohorts based on whether the predicted patients have ejection fractions above or below 35%.
Figure 11 is a graph showing the correlation between the model output and the true ejection fraction numerical value in the study.
FIG. 12 is a block diagram of an example computing device that may be used to implement the systems, methods, devices, and other techniques described in this specification.
FIG. 13 is a diagram representing a data mining pattern for training, validating, and testing convolutional neural network ejection fraction prediction models. To avoid cross-contamination between the data set and the network training based on the ECG of a particular patient, the ECG of each patient is used only once (and only in one of the groups). Patients with more than one data point were used for follow-up analysis.
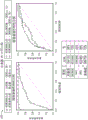
Fig. 14 depicts a receiver operating characteristic curve using a convolutional neural network to identify patients with EF < ═ 35%. ROC and area under the curve (AUC) were calculated using a validation and test (hold out) dataset. The same AUC demonstrates the robustness of the algorithm to different data sets.
Fig. 15 provides a pie chart showing the distribution of ejection fraction based on network classification. Of the patients classified as having low ejection fraction, 63.5% of patients have ejection fractions of 50% or less. If classified as normal, 1.3% of patients have an ejection fraction of < ═ 35%, and 90.1% of patients have an EF of > -50%.
Fig. 16 depicts a table depicting various patient characteristics and complications for patients participating in an example study and assessment of ejection fraction prediction models.
Figure 17 plots long-term results for patients with EF > -50% at the time of initial classification the risk of future L V dysfunction for patients classified by the network to a low EF and with an initial normal EF is significantly increased compared to patients with a normal EF classified as normal.
Like reference numbers and designations in the drawings indicate like elements.
Detailed Description
This specification discloses systems, methods, devices, and other techniques for estimating a cardiac ejection fraction of a mammal based on an Electrocardiogram (ECG) of the mammal. In some implementations, a machine learning model, such as a neural network, is configured to process predictive inputs characterizing ECG data and output an indication of an estimated ejection fraction of the mammal. The model may be trained to account for complex combinations of features that are otherwise indistinguishable to humans, but have been determined (e.g., by an iterative training process) to be relevant to a particular ejection fraction characteristic. Additional details regarding these and other techniques are provided in the description of fig. 1-12 below.
Fig. 1 is a conceptual diagram of an example system 100 for recording and processing ECG data and using the ECG data to estimate ejection fraction characteristics of a subject 102. For purposes of this example, the subject 102 will be considered a human being, and more particularly, a patient of a healthcare provider. However, it should be understood that the present specification is not limited to this example. In other implementations, the subject 102 may be a human that is not specifically associated with a healthcare provider, or may be any other mammal for which an appropriate model has been constructed to map ECG data to an ejection fraction estimate for that mammal.
A set of electrodes 104 is disposed on a surface of the patient 102 to enable recording of signals indicative of the electrical activity of the heart of the patient 102 during an ECG procedure. In some implementations, 10 leads are affixed to the patient to perform standard 12 lead ECG recordings (e.g., with several electrodes located on the chest near the heart region and other electrodes located on the patient's limbs). A 12 lead ECG is useful for acquiring multichannel ECG data, where the data for each channel represents a respective lead. Each lead is formed by an electrical potential between a pair of electrodes. Because of the variation in electrode positioning, different angles are formed by different pairs of electrodes of different leads, and thus each lead provides a different view of the patient's cardiac electrical activity. For example, the signals from each lead may be recorded simultaneously over a period of time (e.g., 5 seconds, 10 seconds, or 15 seconds) to capture information about the timing and location of electrical activity along different radial directions.
In some implementations, ECG data may be recorded using a sensor platform or electrode configuration in addition to or in addition to the 12-lead ECG configuration. For example, a removable ECG patch may be adhered to the surface of a patient, where the patch includes two or more electrodes forming one, two or more leads from which an ECG may be recorded. In some implementations, the patient 102 may manually contact a fixed pair of external electrodes using his or her fingers, or the patient 102 may wear a watch, wrist band, chest strap, or other device that secures two or more electrodes at locations on the patient 102 to sense the patient's cardiac electrical activity. A mobile computing device (e.g., smartphone 106) may be used by patient 102 or a healthcare provider to configure various aspects of an ECG procedure in a clinical or non-clinical setting.
The system 100 further includes a data recorder and control unit 108, an ECG processing system 110, and one or more input/output devices 112 a-b. In some implementations, leads extending from each of the electrodes 104 are coupled to a data logger and control unit 108 to allow for logging of the electrical signals sensed by the electrodes. For example, unit 108 may include an analog-to-digital (A/D) converter as well as other analog or digital signal conditioning circuitry, such as amplifiers, filters, and the like.
The data recorder and control unit 108 is communicatively coupled to an ECG processing system 110. The ECG processing system 110 is a system comprising one or more computers, which may be distributed over one or more physical locations. The system 110 may or may not be in the same physical location as the patient 102 and the data recorder and control unit 108. The system 110 may be coupled to peripheral devices such as a display screen 112a for presenting information to a user, and a mouse and keyboard 112b for receiving user input. Further, the system 110 can include various components 114-126 that facilitate processing of ECG data to determine estimated ejection fraction characteristics, estimated survival rates, and for presenting information regarding such estimates.
For example, the system 110 may include a preprocessor 114, the preprocessor 114 digitally conditioning ECG signals received from the data recorder and control unit 108. The preprocessor 114 may perform noise reduction, antialiasing, or other digital techniques to prepare ECG data describing the ECG of the patient 102 for further processing.
The system 110 further includes one or more ejection fraction prediction models 118. The models 118 are generally configured to process one or more predictive inputs that characterize the ECG data of the patient and generate an estimated ejection fraction characteristic of the patient 102 based on the predictive inputs. The ejection fraction characteristic may indicate, for example, an absolute estimate of the patient's ejection fraction (e.g., a particular value, such as 50%, 45%, 40%, 35%, 30%, or another value), or a classification of the patient's estimated ejection fraction (e.g., a normal ejection fraction greater than 50%, a low ejection fraction between 35% and 50%, or a very low ejection fraction below 35%).
As described in further detail below, the ejection fraction prediction model(s) 118 may be a regression model, a machine learning model, or both. In some implementations, the model(s) 118 are feed-forward, recursive, or convolutional neural networks, or are capsule networks. The neural network model may have fully connected layers and may employ a self-encoder network. In some implementations, the system 110 stores and maintains a plurality of ejection fraction prediction models 118. Each model 118 may correspond to a different set of patient characteristics (e.g., age, weight, gender, or other characteristics). When the ejection fraction of a new patient 102 is to be assessed, the system 110 may select the appropriate one of the models 118 that corresponds to the characteristics that match the characteristics of the patient 102. Each model 118 may be trained, for example, specifically on data points from the patient(s) having corresponding characteristics of the model 118. Other types of machine learning or regression models may also be applied, such as Support Vector Machines (SVMs), Hidden Markov Models (HMMs), and other linear or non-linear systems.
In some implementations, the system 110 maintains the survival estimation model(s) 120. The survival estimation model(s) 120 is configured to process the ECG data, the estimated ejection fraction characteristics, or both, in order to generate a prognosis of estimated future survival rate (e.g., 1-year, 2-year, 5-year, and/or 10-year survival rate) for the patient that is indicative of a likelihood of surviving the cardiac condition based on the ejection fraction characteristics of the patient. For example, the ejection fraction characteristic model 118 may be used to generate an estimated ejection fraction characteristic of the patient. The survival estimation model(s) 120 may then map the estimated ejection fraction characteristics to the future survival rate of the patient as determined from empirical data. For example, patients with very low ejection fraction may have a lower estimated 5-year survival rate than patients with normal ejection fraction. In other implementations, the survival estimation model(s) 120 can process predictive input characterizing the ECG of the patient and derive the estimated survival rate of the patient 102 directly from the predictive input without first starting from the estimated ejection fraction of the patient. In this way, the patient's ECG characteristics in addition to or in addition to ejection fraction may be considered in determining the estimated survival rate of the patient 102. The survival estimation model(s) 120 can be a regression model, a machine learning model, or both. In some implementations, the model(s) 120 are feed-forward, recursive, or convolutional neural networks, or are capsule networks. The neural network model may have fully connected layers and may employ a self-encoder network. In some implementations, the system 110 stores and maintains a plurality of survival estimation models 120. Each model 120 may correspond to a different set of patient characteristics (e.g., age, weight, gender, or other characteristics). When the ejection fraction of a new patient 102 is to be evaluated, the system 110 may select an appropriate one of the models 120 that corresponds to characteristics that match those of the patient 102. Each model 120 may be trained, for example, specifically on data points from the patient(s) having corresponding characteristics of the model 120.
A predictive input generator 116 processes ECG data from the data recorder and control unit 108 or the ECG signal preprocessor 114 to generate predictive input suitable for processing by the ejection fraction prediction model(s) 118 or the survival estimation model(s) 120. For example, predictive input generator 116 may normalize the vectorized ECG data from one or more channels (corresponding to one or more leads) to a format expected by ejection fraction prediction model(s) 118. In some implementations, the predictive input contains a time series of values that indicate the amplitude of the ECG of one or more leads at each point in time at a specified sampling frequency over a period of time spanning one or more cardiac cycles (e.g., 1 second, 2 seconds, 5 seconds, or 10 seconds). In some examples, the predictive input may represent ECG signals that span a relatively short amount of time (e.g., 1 second, 2 seconds, 5 seconds, or 10 seconds), although in other examples, the predictive input may represent ECG signals that span a relatively longer time (e.g., 30 seconds, 1 minute, 2 minutes, 5 minutes, 10 minutes, or longer). In some implementations, predictive input generator 116 averages ECGs from two or more cardiac cycles to generate an average ECG that represents an average cardiac cycle of patient 102. In some implementations, the predictive input generator 116 selects a portion of the ECG corresponding to a single cardiac cycle and characterizes only the selected portion of the ECG in the predictive input. The selected portion is thus a representative cardiac cycle of the patient 102.
In some implementations, ejection fraction predictive model(s) 118 and survival estimation model(s) 120 can instead process predictive input indicative of values of one or more morphological features of the patient's ECG, rather than processing actual time series data representing the amplitude of the ECG waveform over time. Morphological features are parameters that characterize the shape of an ECG waveform or a portion of an ECG waveform, such as a P-wave, QRS complex, or T-wave. Example morphology features that may be identified in the predictive input include T-wave amplitude, P-wave area, T-wave left slope, T-wave right slope, P-wave left slope, P-wave right slope, T-wave duration, P-wave duration, PR interval, QRS duration, QRS amplitude, QRS area, QRS energy, QRS peak-to-peak ratio, QT segment length, or a combination of two or more of these. A number of these features are graphically illustrated on the example ECG waveform 300 in fig. 3. In some implementations, the system 110 includes a feature extractor 126, which feature extractor 126 analyzes the ECG data and determines the values of any applicable morphological features to include predictive inputs to be processed by the ejection fraction prediction model 118.
The system 110 further includes a training subsystem 122 and a notification manager 124. The training subsystem 122 is configured to train the ejection fraction prediction model(s) 118, the survival estimation model(s) 120, or both. An example process 600 performed by the training subsystem 122 for training the ejection fraction prediction model 118 is described with respect to fig. 6. The notification manager 124 is configured to provide the estimated ejection fraction characteristics, the estimated survival rate, or both for output to one or more users. In some implementations, notification manager 124 provides the estimated ejection fraction characteristics for display on screen 112 a. Additionally, one or more notification services may be registered at the computing system 110, thereby causing the notification manager 124 to push the estimated ejection fraction characteristics, the survival rate estimates, or both, to each of the registered services for presentation by one or more devices (e.g., on a smartphone, at a healthcare provider's clinic, for visual, audible, and/or tactile presentation).
Fig. 2 is a flow diagram of an example process 200 for estimating ejection fraction characteristics of a subject using ECG data. Process 200 may be performed by a computing system (e.g., system 110 of fig. 1). At stage 202, the system acquires ECG data of the patient. The ECG data can include one or more channels, each of the one or more channels representing an ECG signal of a respective lead of an ECG procedure, and the data from each channel can be aligned in time. The ECG data may span a single cardiac cycle, a portion of a cardiac cycle, or multiple cardiac cycles of the patient. At stage 204, a predictive input generator of the system generates one or more predictive inputs from the ECG data to feed to an ejection fraction prediction model, such as ejection fraction prediction model 118. In some implementations, the predictive input represents a time series of values of the ECG waveform. In other implementations, values representing morphological features of the ECG waveform are predictively input (stage 206). At stage 208, the system provides predictive input to the ejection fraction prediction model for processing. At stage 210, the ejection fraction prediction model processes predictive input representing the patient's ECG outcome to generate an estimated (predicted) ejection fraction characteristic. In some implementations (212), the ejection fraction characteristic is an absolute estimate of the ejection fraction of the patient that identifies a particular value of the ejection fraction. In other implementations (214), the ejection fraction characteristic is a category or range of ejection fraction values (e.g., very low ejection fraction, or normal ejection fraction). For example, the ejection fraction model may be trained to classify the ejection fraction of the patient as one of two, three, or more possible ejection fraction categories defined by specified threshold ejection fraction values. The binary classification model may classify the ejection fraction of a patient into two possible categories. The system then stores and/or outputs the estimated ejection fraction characteristics at stage 216, e.g., for presentation to the patient or his or her healthcare provider.
In some implementations, rather than estimating the patient's current ejection fraction characteristics (as described in other implementations), the ejection fraction prediction model may be trained and configured to predict the patient's risk of progressing to a low ejection fraction or a very low ejection fraction in the future (e.g., in the next 1 month, 6 months, 1 year, 2 years, 5 years, or more) by detecting subtle features or changes in the patient's ECG that indicate early manifestations of the disease.
Fig. 3 is a diagram of an example ECG trace 300 for one heartbeat of a patient. The ECG trace shows the component segments of the beat as well as various morphological waveform features.
Fig. 4 is a flow diagram of an example process 400 for selecting and using an appropriate ejection fraction prediction model corresponding to a characteristic of a patient. Process 400 may be performed by a computing system, such as system 110 of fig. 1. In some instances, a global ejection fraction prediction model may be trained and used for various patients. However, in other examples, a more accurate or reliable estimate of the patient's ejection fraction may be determined using a patient-specific personalized model, or a more accurate or reliable estimate of the patient's ejection fraction may be determined using a semi-personalized model that has been trained on ECG data and ejection fraction characteristics measured from a population of patients having the same or similar characteristics as the new patient for which the ejection fraction estimate is desired. For example, multiple ejection fraction prediction models may be generated, each of which corresponds to a different set of patient characteristics, such as age, height, weight, Body Mass Index (BMI), gender, family history, any indication of other complications, such as diabetes, hypertension, hyperlipidemia, hypersensitive C-reactive protein (CRP), tobacco usage, a history of coronary artery disease, a history of inflammatory disease, or a combination of these. At stage 402, the system identifies a characteristic set of patients for which estimated ejection fraction characteristics are to be determined. At stage 404, the system selects one of the ejection fraction prediction models that corresponds to the patient's identified set of characteristics. For example, for a male patient over the age of 50, a model trained on data from subjects with similar characteristics to the patient may be selected, rather than selecting other models trained on data from subjects with other characteristics. At stage 406, the system generates an ejection fraction prediction using the selected ejection fraction prediction model corresponding to the characteristics of the patient. For example, the system may generate estimated ejection fraction characteristics according to process 200 described with respect to fig. 2 using the selected model.
While ECG-based estimation of a patient's ejection fraction may be a useful screening procedure, further evaluation of the patient may be necessary based on the results of the ECG-based screening procedure. Fig. 5 is a flow diagram of an example process 500 for screening potentially problematic ejection fraction levels using an ECG-based approach. The process 500 may be automated, for example, by the computing system 110, or may be performed by a healthcare provider or other appropriate individual. At stage 502, an estimated ejection fraction characteristic of the patient is obtained, e.g., based on the process 200 described with respect to fig. 2. At stage 504, the system determines whether the estimated ejection fraction characteristics, and optionally additional factors, satisfy one or more screening criteria that are used to guide the decision whether further assessment of the patient's condition is necessary. For example, the estimated ejection fraction characteristic may be an absolute value indicative of a predicted ejection fraction of the patient, and the screening criteria may include a threshold ejection fraction (e.g., 35% or 50%). If the patient's estimated ejection fraction is below a threshold, a subsequent procedure for further evaluation may be performed on the patient. The subsequent procedure may be, for example, echocardiography, MRI, CT scan, nuclear medicine diagnosis, or a combination of these. In some implementations, if a patient's ejection fraction characteristics are classified into a range of ECG values that are deemed to be at risk or unsafe, further medical assessments may be performed on that patient.
In some implementations, if the patient's ejection fraction is below a threshold (e.g., 35% or 50%) or the patient's ejection fraction characteristics are classified in a range of ECG values deemed to be at risk or unsafe, a therapeutic drug may be administered to the patient or a Therapy may be performed on the patient such drugs or therapies may include β receptor antagonist blockers, angiotensin receptor antagonists, statins (in coronary artery disease), defibrillators, cardiac resynchronization devices, and other well-defined therapies (see 2013ACCF/AHA Heart Failure management guidelines for the Heart Failure disease), blood Circulation (Circulation) 2013; 128: e240-e 327; and 2016: focus update for New pharmacologic Therapy for psychological Failure (ACC/cut AHA/AHA on New pharmacologic Therapy) focus update (ACC/cut AHA/HFA on New pharmacologic Therapy) for patients (ACC/H A/HFSA) with respect to psychological Therapy) and other well-defined blood fraction imaging or other blood fraction detection thresholds (e for general diagnosis) and other blood fraction detection of coronary artery disease, such as well-defined Therapy for systemic diagnosis of coronary artery disease, including 2016 or detection of other blood flow diseases with specific blood fraction characteristics in a range of coronary artery disease, 2016, or other well-defined Therapy for coronary artery disease.
Fig. 6 is a flow diagram of an example process 600 for training an ejection fraction prediction model (such as a neural network-based model). In some implementations, machine learning techniques such as gradient descent (including batch gradient descent or random gradient descent) may be used to train the ejection fraction model. Process 600 may be performed by a computing system, such as training subsystem 122 described with respect to FIG. 1. At stage 602, the system includes a set of multiple training data pairs. Each pair includes ECG predictive input that characterizes the ECG of a particular patient and the target ejection fraction characteristics of that patient. The target ejection fraction characteristic may be a "true" or measured ejection fraction characteristic determined from an echocardiogram or other available procedure. In some cases, the model is trained from data from many different patients. If the model is semi-personalized, the patients represented in the training set may share a set of common characteristics with each other. At stage 604, the training system selects a first training data pair for processing. At stage 606, predictive inputs from pairs of training data are provided to the ejection fraction prediction model. The ejection fraction prediction model may be, for example, a neural network machine learning model having one or more layers of sensors with associated weights/parameters for the activation functions associated with each sensor. These weights may be initialized randomly when training begins and gradually improve over time as additional training iterations are performed. At stage 608, the system processes the predictive input according to the current weights/parameters of the model and generates estimated ejection fraction characteristics. At stage 610, the estimated ejection fraction characteristic is compared to a target ejection fraction characteristic to determine an output error. This output error is then back-propagated through the network using gradient descent (back-propagate) for updating the current weights/parameters of the neural network. The process returns to stage 604 where another training data pair is selected and the operations at 604 and 612 are repeated until a training termination condition occurs.
Although ejection fraction prediction models may be trained from large data sets, the models themselves may be relatively compact. After training, the model may be relatively compact and may use less computational requirements to predict ejection fraction characteristics than may be needed during training.
While process 600 is generally related to a supervised learning process, in some implementations, an ejection fraction prediction model may be trained using unsupervised learning techniques.
Fig. 7 is a flow diagram of an example process 700 for predicting survival of a subject from cardiac conditions, such as low ejection fraction or very low ejection fraction, from ECG data of the subject. In some implementations, the process 700 is performed by a computing system that includes a survival prediction model, such as the model 120 of the ECG processing system 110 (fig. 1). At stage 702, the system acquires ECG data of a patient. The ECG data can include one or more channels, each of the one or more channels representing an ECG signal of a respective lead of an ECG procedure, and the data from each channel can be aligned in time. The ECG data may span a single cardiac cycle, a portion of a cardiac cycle, or multiple cardiac cycles of the patient. At stage 704, a predictive input generator of the system generates one or more predictive inputs from the ECG data to feed to the survival estimation model. In some implementations, the predictive input represents a time series of values of the ECG waveform. In other implementations, values representing morphological features of the ECG waveform are predictively input (706). At stage 708, the predictive input is provided to a survival estimation model, and at stage 710 the model processes the predictive input to determine an estimated survival rate of the patient based on the ECG of the patient. The estimated survival rate may be, for example, 1 month, 1 year, 2 years, 3 years, 4 years, 5 years, or 10 years of prognosis. The system may then provide the survival estimate for output, including for presentation to the patient, his or her healthcare provider, or both (stage 712).
Fig. 8 is a diagram of an example neural network model 800 for estimating ejection fraction characteristics of a subject from ECG data. The model 800 processes ECG predictive input that characterizes one or more channels of a patient's ECG. As can be seen in fig. 8, model 800 may include an input layer, an output layer, and one or more hidden layers therebetween for the perceptron and/or sigmoid neuron. For example, data from multiple channels may be processed and aggregated until the data is provided to a fully connected layer of the network. The model 800 may output a value or classification of an estimate of ejection fraction characteristics of a patient.
In some implementations, the neural network model 800 includes multiple convolutional layers for feature extraction. Each convolutional layer may include a constant or variable length filter that focuses attention on the current lead of the ECG or on multiple leads of the ECG simultaneously (e.g., k x 1 or kxm leads). After convolutional layers, the network may include one or more fully connected layers, each of which has the same or different number of neurons. No recurrent neural network layers, or one or more recurrent neural network layers, may be added before, after, or in parallel with the convolutional layer for temporal feature extraction. The skip layers and neurons may or may not be included.
Fig. 9 shows results 900 of a first neural network implementation of an ejection fraction prediction model that classifies patients into multiple cohorts according to whether they are predicted to have ejection fractions above or below 50%.
Fig. 10 shows the results 1000 of a second neural network implementation of an ejection fraction prediction model that classifies patients into multiple cohorts according to whether the predicted patients have ejection fractions above or below 35%.
FIG. 11 is a graph 1100 showing the correlation between model output and true ejection fraction numerical values in a study.
Although a number of examples are described herein for detecting a dysfunctional (low) ejection fraction in a patient using data from a standard 12-lead ECG, in other implementations, fewer leads (including even single lead ECG) may be used to effectively detect instances of low ejection fraction or to identify individuals who are prone to experiencing increased risk of developing ejection fraction conditions over a future period of time (e.g., 5 years). Ejection fraction prediction models can be trained and implemented based on data from any number of ECG leads, including single lead, any multi-lead configuration, and standard 12-lead ECGs. For example, a single lead ECG based on lead 1 has been shown to be particularly effective in providing reliable data from which an ejection fraction prediction model can generate ejection fraction predictions. Ejection fraction prediction based on single lead ECG or other non-traditional electrodes (e.g., less than the standard 12 lead ECG) can be advantageously extended to the access of screening devices implementing the ejection fraction prediction model described herein. For example, a pair of electrodes may be integrated with or communicatively coupled to a smartphone or other portable electronic device that allows an individual to conveniently capture his or her ECG and quickly obtain a prediction, e.g., by touching the electrodes using his or her fingertips. In other implementations, the electrodes may be provided in the form of a wearable patch for continuous monitoring over a period of time.
In certain examples, yet another advantage that may be achieved by at least some of the implementations described herein is the ability to detect low ejection fraction based on a short single temporal distribution of ECG data of a patient (e.g., from a single lead or multiple leads). For example, the system may only need to process relatively short samples of ECG data to generate a high confidence prediction of the ejection fraction status of the patient, such as whether the patient has a low EF. In some implementations, the ejection fraction prediction model is configured to predict whether a patient has a low EF (e.g., an EF of less than 35%, 40%, 50%) based on ECG sampling of 60 seconds or less. In some implementations, the ejection fraction prediction model is configured to predict whether a patient has a low EF (e.g., an EF of less than 35%, 40%, 50%) based on ECG sampling of 30 seconds or less. In some implementations, the ejection fraction prediction model is configured to predict whether a patient has a low EF (e.g., an EF of less than 35%, 40%, 50%) based on ECG sampling of 20 seconds or less. In some implementations, the ejection fraction prediction model is configured to predict whether a patient has a low EF (e.g., an EF of less than 35%, 40%, 50%) based on ECG sampling of 15 seconds or less. In some implementations, the ejection fraction prediction model is configured to predict whether a patient has a low EF (e.g., an EF of less than 35%, 40%, 50%) based on ECG sampling of 10 seconds or less. In some implementations, the ejection fraction prediction model is configured to predict whether a patient has a low EF (e.g., an EF of less than 35%, 40%, 50%) based on ECG sampling of 5 seconds or less. In some implementations, the ejection fraction prediction model is configured to predict whether a patient has a low EF (e.g., an EF of less than 35%, 40%, 50%) based on ECG sampling of 2 seconds or less. The acquisition time of the ECG may thus be relatively short and convenient for the patient. Additionally, using a machine learning model such as a convolutional neural network that has been trained on a large data set may allow for fast processing, which enables the computing system executing the model to return ejection fraction predictions based on the ECG input in a relatively short amount of time.
Certain implementations have been described with respect to models that estimate or predict an individual's ejection fraction. However, it should be understood that these techniques may be extended more broadly to facilitate the detection of various existing or impending models of structural heart disease, including abnormal ejection fraction, left ventricular mass abnormalities (e.g., elevated left ventricular mass, low left ventricular mass), valvular heart disease, ischemic heart disease, appendiceal abnormality, presence of shunt or Patent Foramen Ovale (PFO), enlargement of the heart chamber (e.g., left atrium, right atrium, left ventricle, right ventricle), or combinations of these and/or other structural heart disease.
FIG. 12 is a block diagram of computing devices 1200, 1250 that may be used to implement the systems and methods described in this document as either a client or a server or multiple servers. Computing device 1200 is intended to represent various forms of digital computers, such as notebook computers, desktop computers, workstations, personal digital assistants, servers, blade servers, mainframe computers, and other appropriate computers. Computing device 1250 is intended to represent various forms of mobile devices, such as personal digital assistants, cellular telephones, smart phones, and other similar computing devices. Additional computing devices 1200 or 1250 may include a Universal Serial Bus (USB) flash drive. The USB flash drive may store an operating system and other applications. The USB flash drive may include an input/output component, such as a wireless transmitter or a USB connector, that may be plugged into a USB port of another computing device. The components shown here, their connections and relationships, and their functions, are meant to be exemplary only, and are not meant to limit implementations described and/or claimed in this document.
The memory 1204 stores information within the computing device 1200. In one implementation, the memory 1204 is a volatile memory unit or units. In another implementation, the memory 1204 is a non-volatile memory unit or units. The memory 1204 may also be another form of computer-readable medium, such as a magnetic or optical disk.
The storage device 1206 can provide mass storage for the computing device 1200. In one implementation, the storage device 1206 may be or contain a computer-readable medium, such as a floppy disk device, a hard disk device, an optical disk device, a tape device (tape device), a flash memory or other similar solid state memory device, or an array of devices, including devices in a storage area network or other configurations. The computer program product may be tangibly embodied in an information carrier. The computer program product may also contain instructions that, when executed, perform one or more methods, such as those described above. The information carrier is a computer-readable medium or machine-readable medium, such as the memory 1204, the storage device 1206, or memory on processor 1202.
The high speed controller 1208 manages bandwidth-intensive operations for the computing device 1200, while the low speed controller 1212 manages lower bandwidth-intensive operations. The allocation of such functions is exemplary only. In one implementation, the high speed controller 1208 is coupled to the memory 1204, the display 1216 (e.g., via a graphics processor or accelerometer), and the altitude expansion port 1210, which high speed expansion port 1210 may accept various expansion cards (not shown). In this implementation, low-speed controller 1212 is coupled to storage device 1206 and to low-speed expansion port 1214. The low-speed expansion port may include various communication ports (e.g., USB, bluetooth, ethernet, wireless ethernet) that may be coupled to one or more input/output devices, such as a keyboard, a pointing device, or a network device, such as a switch or router, for example, through a network adapter.
The computing device 1200 may be implemented in a number of different forms, as shown in the figure. For example, it may be implemented as a standard server 1220, or multiple times in a group of such servers. It may also be implemented as part of a rack server system 1224. Further, it can also be implemented in a personal computer such as a notebook computer 1222. Alternatively, components from computing device 1200 may be combined with other components in a mobile device (not shown), such as device 1250. Each of such devices may include one or more of computing devices 1200, 1250, and a complete system may be made up of multiple computing devices 1200, 1250 communicating with each other.
The processor 1252 is capable of executing instructions within the computing device 1250, including instructions stored in the memory 1264. The processor may be implemented as a chipset of chips that include separate pluralities of analog and digital processors. Additionally, a processor may be implemented using any of a number of architectures. For example, the processor 1252 may be a CISC (Complex instruction set computer) processor, RISC (reduced instruction set computer) processor, or MISC (micro instruction set computer) processor. The processor may provide, for example, for coordination of the other components of the device 1250, such as control of user interfaces, execution of applications by device 1250, and wireless communication by device 1250.
The memory may include, for example, flash memory and/or NVRAM memory, as discussed below. In one implementation, a computer program product is tangibly embodied in an information carrier. The computer program product contains instructions that, when executed, perform one or more methods, such as those described above. The information carrier is a computer-or machine-readable medium, such as the memory 1264, expansion memory 1274, or memory on processor 1252, which may be received, for example, over transceiver 1268 or external interface 1262.
Various implementations of the systems and techniques described here can be realized in digital electronic circuitry, integrated circuitry, specially designed ASICs (application specific integrated circuits), computer hardware, firmware, software, and/or combinations thereof. These various implementations can include implementation in one or more computer programs that are executable and/or interpretable on a programmable system including at least one coupled programmable processor, which may be special or general purpose, for receiving and transmitting data and instructions from and to a storage system, at least one input device, and at least one output device.
As used herein, the terms "machine-readable medium," "computer-readable medium" refers to any computer program product, apparatus and/or device (e.g., magnetic discs, optical disks, memory, programmable logic devices (P L D)) used to provide machine instructions and/or data to a programmable processor, including a machine-readable medium that receives machine instructions as a machine-readable signal.
In order to provide for interaction with a user, the systems and techniques described here can be implemented with a computer having a display device (e.g., a CRT (cathode ray tube) or L CD (liquid crystal display) for displaying data to the user and a keyboard and a pointing device (e.g., a mouse or a trackball) by which the user can provide input to the computer.
The systems and techniques described here can be implemented in a computer system that includes a back-end component (e.g., as a data server), or that includes a middleware component (e.g., AN application server), or that includes a front-end component (e.g., a client computer having a graphical user interface or a web browser through which a user can interact with AN implementation of the systems and techniques described here), or any combination of such back-end, middleware, or front-end components.
The computing system may include clients and servers. A client and server are generally remote from each other and typically interact through a communication network. The relationship of client and server arises by virtue of computer programs running on the respective computers and having a client-server relationship to each other.
Example implementation
SUMMARY
This example pertains to an artificial intelligence ("AI") based study developed in accordance with the techniques described in this specification for detecting patients with asymptomatic low left ventricular dysfunction (a L VD) using non-invasive ten-second digital ECG with high fidelity.
The background A L VD is present in 2-9% of the population, is associated with reduced quality of life and longevity, and is generally treatable when detected the area under the curve (AUC) of BNP screening blood tests is 0.79-0.89 the study assumes that the use of Artificial Intelligence (AI) will enable ECG, a ubiquitous inexpensive test, to identify left ventricular systolic dysfunction.
Methods this study involved training a convolutional neural network using digitally stored 12-lead ECG and echocardiogram pairs of 44959 patients from the meio clinic (MAYO C L INIC) database for identifying patients with ventricular dysfunction (defined as Ejection Fraction (EF) < 35%). this network was subsequently tested on 52870 patients reserved for external validation.
Results of 52870 patients tested 4131 (7.8%) had an EF < 35%. ROC AUC of 0.93. sensitivity, specificity and accuracy of 86.3%, 85.7% and 85.7%, respectively. of 1335 patients screened for abnormalities in AI but with normal EF (false positive), 147 (11%) had at least one abnormality EF. in the future (9.5% incidence in 5 years) with a four-fold increase in progression to the future lower risk of L VEF indicating that the network can detect early, subclinical, metabolic or structural abnormalities present in ECG.
Conclusion application of artificial intelligence to ECG (a ubiquitous and generally low cost detection) allows ECG to serve as a powerful tool for screening left ventricular dysfunction and further for identifying individuals at increased risk of future progression of left ventricular dysfunction.
Method of producing a composite material
Data sources and study populations the studies acquired data from the meio clinic digital database after approval by the institutional review board. 163892 adult patients (18 years old and older) were identified using at least one digit acquired in a supine position between 1 month 1994 and 2 months 2017, a standard 10 second 12 lead ECG, and at least one transthoracic echocardiogram (TTE) acquired within 14 days of the exponential ECG (fig. 13). For patients with multiple ECG and TTE data sets that meet these criteria, the earliest pair is used for web creation, validation or testing, and subsequent TTE data is used for follow-up analysis. To obtain internal funding, preliminary proof of concept evaluation was performed using 2200 ECG-TTE data pairs, which were excluded from the existing analysis, leaving a cohort of 97829 patients, the first ECG-TEE paired data set of 97829 patients being used for the preliminary analysis.
The ECG is acquired at a sampling frequency of 500Hz using the general electric MARQUETTE ECG machine (Marquette, WI) and stored for subsequent retrieval using the MUSE data management system, comprehensive two-dimensional or Three-dimensional and Doppler echocardiograms are available for all patients at the time of acquisition quantitative data is recorded in a custom database (echocardiogram image management system, EIMS) developed in the Meito clinic, left ventricular Ejection Fraction (EF) is conventionally measured or estimated using standardized methods, and more than one value is likely to be recorded in most reports for the purposes of this study, the ejection value used in the model is the first available value from a standard hierarchical sequence, the Three-dimensional echocardiogram in the assessment of the left ventricular index (Three-dimensional echocardiogram analysis of ultrasound heart rate) (heart Q, Ahmard) is used as a Three-dimensional ultrasound imaging analysis of the left ventricular index (heart-dimensional imaging analysis) if the results of the heart-flow analysis of the results.
Major and minor results the major result is the ability of the AI network to identify patients with 35% or less L VEF using only ECG signals because of its obvious clinical and therapeutic significance, this value was chosen (Russo AM, Stainback RF, Bailey SR et al. ACCF/HRS/SCMA/ASE/HFSA/SCAI/SCCT/R2013. appropriate use criteria for implantable cardioversion and cardiac resynchronization therapy A. report by the American Society of Cardiology Foundation (ACCF/HRS/AHA/HFSA/SCAI/SCCT/SCMR 2013 intervention criteria for use in imaging patients-Heart disease-diagnosis-repair, health assessment, health care, health assessment, health care, health assessment, health care.
AI model development overview the study involves using the KERAS framework and TENSEORF L OW (GOOG L E, mountain View, CA) backend and PYTHON (van Rossum G. Python course), the Technical Report CS-R9526 (Pythontory, Technical Report CS-R9526) Amsterdan, CNN operations that have been applied to images (or videos), whereby convolution can be used to extract very subtle patterns in the data set, each 12 lead ECG is considered as a 12x 5000 (i.e., 12 leads, 10 seconds duration, 500Hz sampling frequency layer) image (van Rossum G. Python course, Technical Report-R9526 (which is called C. Python course G. Python course, the Technical Report CS-R9526 (which is called C. A. C. Python course) is connected to a hidden network function of a hidden network, which is used by a hidden network learning machine to prevent the hidden network from missing from the IEEE network, the national center meeting, the network, the hidden network learning of the hidden network of the No. 12x 5000 (12 leads, 10 seconds duration, 500Hz sampling frequency layer), the hidden network of the hidden nodes of the relevant Report CS-R9526, the hidden network of the hidden nodes, the hidden nodes of the.
AI model training due to the large size of our dataset, approximately 50% of the dataset was used to train the network. This leaves a very large data set for us to test the network to better assess its robustness (fig. 13). After being initially split into development and testing (set out) datasets, the development dataset was further partitioned into training data (80% of development set) and internal validation data (20%).
For training purposes, the ECG is fed to the network and the weights of the network are updated using an Adam optimizer (Kingma DP, Ba J. Adam: a Method for stochastic optimization (A Method for Stochastics optimization), 2014), with binary cross entropy as a loss function. After each epoch (epoch), the network is tested using an internal validation dataset and training is stopped after it is optimized. During this process, the network over-parameters are also fine-tuned and the network with the lowest loss value is selected. All ECGs are low pass filtered (100hz) to remove high frequency noise as well as quantization errors.
The validation data set ROC is used to select two thresholds with a low probability of L VEF, a first threshold is selected by giving the same weight to sensitivity and specificity, and a second threshold selected yields 90% sensitivity on the validation data set.
Secondary results — the AI-enhanced ECG for predicting future low EF assumes that, early in any disease progression affecting EF, the ECG signal will show subtle patterns of abnormalities because metabolic and structural disturbances have not yet affected a sufficient amount of myocardium to cause a decrease in EF, it is further assumed that the CNN will classify some of these cases as abnormalities, giving an initial occurrence of a false positive detection that will become true positive detection over time to test this assumption, a sub-study was designed to identify patients that meet the conditions 1) the network predicts that a patient has a low EF, 2) the echocardiogram performed for the patient over 14 days shows a normal EF (≧ 50%) indicating that false positive findings were determined by the algorithm, and 3) the patient will receive at least one additional echocardiogram on a future date (not used for training or testing), a control group is created using true negative cases (both algorithm and clinical determination are consistent with no low EF), for the control group, L% sensitivity is selected L. the sensitivity of the control group is adjusted for the low EF probability of occurrence of a regression analysis, and the likelihood of the occurrence of a low risk of adverse event is estimated by using the low probability of the COEF-regression analysis of the occurrence of the subject after the future age of the occurrence of the low EF.
Statistical considerations for the measurement of diagnostic performance (AUC, ROC, sensitivity), the sample size was so large that normal Confidence Intervals (CI) were expected to have a width of < 0.5%. therefore, due to their high accuracy, CI. serial data were not reported along with the estimated values as an average +/-sd. cox model together with bilateral p values were presented. survival analysis was conducted using SAS version 9.4. CNN was trained using KERAS (version 2.0.3) and tens orf L OW (version 1.0.1).
Study reporting this study was conceived, subsidized and performed entirely by the meio clinic. There is no industry support of any kind.
Results
A study population having a total of 625326 patients with ECG-TTE pairs was screened for identifying a study cohort selected for analysis (fig. 13) first ECG-TTE data pairs from patients who performed ECG and echocardiograms over a2 week interval comprised an analysis dataset consisting of 97829 patients, of which 35970 patients were in the training set, 8989 patients were in the validation set, and 52870 patients were in the stay test set no patients were in more than one cohort (fig. 13) the average age of the overall patient population was 61.8+/-16.5 years, and 7.8% of the patients in the population were < 35% in this population table 1 shows patient characteristics of the training set, validation set, and test set in the test dataset 4131 (7.8%) patients had an EF of 35% or less, 6740 (12.7%) had an EF of greater than 35% and less than 50% L VEF, and 675%) had an ECG index of greater than 35% or 50% within 3689 of the same day.
The AUC for the main results leave-out test dataset was 0.93 and was the same as the AUC for the internal validation dataset (0.93) (fig. 14). When a threshold that does not favor sensitivity was chosen, the overall accuracy was 85.7%, the specificity was 85.7% and the sensitivity was 86.3%, and the negative predictive value was 98.7%. Using a threshold value yields a sensitivity of 90% on the validation set and applying the algorithm to the test data set, the sensitivity is 89.1%, the specificity is 83%, the overall accuracy is 83.5%, and the negative predictive value is 98.9%. When patients without known complications (see fig. 16) were analyzed separately from the network, AUC increased to 0.98, sensitivity was 95.6%, specificity was 92.4%, negative predictive value was 99.8% and accuracy was 92.5%.
Network performance is not improved by additional input of age and gender. To understand whether the network "determines" age and gender based solely on ECG, the network is retrained for predicting age and gender from ECG. Age was predicted to be 8.7+/-6 years and gender was accurately determined in 87% of cases from ECG, AUC 0.94. This indicates that the network can reliably determine age and gender from ECG alone, explaining why its performance is not affected by age or gender, as it can compensate for these variables.
Classification of distributed EF values by AI algorithm when a threshold is selected that does not have a preference for sensitivity (i.e., a threshold that would yield equal sensitivity and specificity using validation data), 10544 (19.9%) patients in the test set were identified by the network as having a low EF. in these 10544 patients, 33.8% had an EF of 35% or less, 29.5% had an EF of 36-50%, and 36.6% had a normal EF. in the group identified as normal by the network, 1.3% had an EF of 35% or less, and 8.6% had a L VEF of 36-50%, with the remainder (90.1%) having a normal L VEF (fig. 17).
Secondary outcome-AI enhanced ECG for predicting future low EF among the patients identified by the network as having normal EF and also having normal concurrent EF as confirmed by echocardiography ("true negative"), 11515 patients received follow-up echocardiography. Of these truly negative patients, 302 patients progressed to low EF in median (IQR) follow-up in 3.8(1.4-7.5) years (FIG. 4: 10 annual incidence 4.4%). In contrast, 1335 patients were flagged by the network as having a low EF, but at the same time the echocardiogram showed a normal EF ("false positives"). Of these 1335 patients with initial "false positive" results, 147 patients (fig. 4: 10 annual incidence 20.8%) progressed to left ventricular dysfunction during mid-3.4 (IQR 1.2-6.8) years of follow-up. This represents a four-fold risk of future low EF when the AI algorithm defines ECG as abnormal (age and sex adjusted HR 4.1[3.3-5.0], p <0.001), indicating that the network identifies ECG abnormalities before significant ventricular dysfunction becomes apparent.
Discussion of the related Art
The abnormal left Ventricular contraction skills are associated With impaired quality of life, increased morbidity and increased mortality (McDonage AS. uses B-type natriuretic Peptide for Screening asymptomatic left Ventricular dysfunction (Screening for asymptomatic Ventricular dysfunction) 2008; 14: 5-8). the major cardiovascular professional Society has been a symptom-based treatment back book (Al-Khattib SM, Stevenson WG, Ackern MJ et Al; AHA/2017 for the early Management of patients With Ventricular Arrhythmias and cardiac Sudden death, and a preventive Guideline for the early detection of cardiac death of patients With Ventricular dysfunction and Clinical diagnosis of Heart disease (Clinical diagnosis of Heart disease) that is superior to the normal Heart disease (Heart disease) of Heart disease, Clinical diagnosis of Heart disease, Heart failure of Heart disease, Heart failure of Heart disease, cardiovascular disease, Heart disease, brain disease, Heart disease, brain disease, Heart disease, kidney disease, Heart disease, kidney disease, Heart disease, kidney disease, Heart disease, kidney disease, Heart disease, kidney disease, Heart disease, kidney.
The clinical tests of patients with obstructive Heart failure (Heidenreich PA, Albert NM, Allen L A et al) and the clinical tests of patients with ventricular dysfunction (Heart dysfunction, Heart disorder, Heart dysfunction, Heart disorder, Heart disease, Heart disorder, Heart disease, Heart disorder, Heart disorder, Heart disorder, Heart disorder, Heart.
However, by using approximately 45000 ECG and EF data pairs to train the network, the network is exposed to a sufficient number of ECG variants to classify individuals who do have low ejection scores, as demonstrated by an AUC of 0.93 when tested in the 52870 population of people, unlike prior applications of neural networks that mimic human skills in medicine, such as identifying the location of mammographic lesions (Salazar-L icea L A, Pedraza-Ortega, Pastrana-Palma A, aces-Fernandez MA. mammographic ROI and reducing false positive (L oction of mammograms's ROI and reduce of false positive) computer methods and Programs (computerized methods) in medicine, the ability of which to use AI 111-97 to enable the study of human skills to be expanded.
An important feature of our network is that it uses an inexpensive, standardized, ubiquitous test as its input-namely 12-lead ECG in many Rural areas of the United states (Gruca TS, pyro TH, Nelson GC. by Visiting physicians' offices to provide Cardiology Care in Rural areas (Providing Cardiology in Rural areas through visual Heart Association) 2016; 2016) and developing Chinese, one can only obtain limited Cardiology Care and imaging if a portable, inexpensive test for ventricular systolic dysfunction is available, allowing for optimal utilization of limited imaging resources, enabling individuals to benefit from proven treatments, such as β adrenergic blockers, angiotensin receptor antagonists, and using devices (defibrillator and cardiac resynchronization systems) if available (Yancy, JJ, J, Heart Failure, see the American Heart Association, Heart Management of Heart, Heart Management of Heart, Heart Failure, Heart Management, see the national Heart Association, Heart Management of Heart, Heart disease, Heart use of the Heart Handle, Heart Management of the national Heart disease, Heart test, the national Heart test with the national Heart Association, Heart test and Heart test, the national Heart test center, the like, (the national Heart test center, the national Heart test, the national center of Heart Failure, the national center of the national center, the national center of Heart Failure, the national center of Heart Failure, the national center of Heart Failure, the national center of Heart Failure, the national center of Heart Failure, the national center of the.
In this study, due to the refined results and treatment indications for this value, an EF of 35% or less was chosen as the detection threshold (Yancy CW, Jessup M, Bozkurt B et al. ACC/AHA/HFSA in 2017 for 2013ACCF/AHA Heart Failure Management Guidelines, the American Society of Cardiology/American Heart Association clinical Practice Guidelines Special group, and a reported Focused Update of the American Heart Failure Association (2017ACC/AHA/HFSA Focused Update of the2013ACCF/AHA Guidelines for the Management of Heart Failure: A Report of the American College of Cardiology/American Heart Association clinical Practice Guidelines and the Heart Failure diagnosis of American Society of Heart disease J.2017: American Society of Heart disease J.2017 J.. However, identifying EFs below 50% still has clinical significance. Thus, a "false positive" value of 45% is actually clinically meaningful (fig. 15). Additionally, the network can be easily configured to instead use different detection thresholds, e.g., identify an EF of < 40%. The ECG-TTE pairs are not acquired simultaneously. However, since the study included 100000 more ECG-TTE paired datasets, with more than 89% of TTEs performed within 24 hours of the ECG, the likelihood of time delay related inaccuracies was low. The convolutional neural network in this study was specifically trained to detect low EF-diastolic dysfunction and no heart failure. However, evidence-based therapies that reduce morbidity and mortality have been established for low EF therapy, which is sometimes asymptomatic, thus making detection of low EF particularly important.
Although various embodiments have been described in detail above, other modifications are possible. Moreover, the logic flows depicted in the figures do not require the particular order shown, or sequential order, to achieve desirable results. Other steps may be provided, or steps may be eliminated, from the described flows, and other components may be added to, or removed from, the described systems. Accordingly, other implementations are within the scope of the following claims.
Claims (51)
1. A computer-implemented method, comprising:
receiving, by a system comprising one or more computers, Electrocardiogram (ECG) data describing an ECG of a mammal over a period of time;
providing, by the system, predictive input derived from the ECG data to an ejection fraction predictive model;
processing the predictive input using the ejection fraction predictive model to generate an estimated ejection fraction characteristic of the mammal; and
providing the estimated ejection fraction characteristic of the mammal for output.
2. The computer-implemented method of claim 1, wherein the ECG data comprises one or more channels, each channel comprising a subset of respective leads in the ECG data that describe the ECG of the mammal over the time period,
wherein the predictive input characterizes the respective lead of the ECG for each of the one or more channels of the ECG data.
3. The computer-implemented method of claim 2, wherein the ECG data comprises a plurality of channels, each channel comprising a subset of a respective one of a plurality of leads in the ECG data describing the ECG of the mammal over the time period,
wherein the predictive input characterizes the plurality of leads of the ECG for each of the plurality of channels of the ECG data.
4. The computer-implemented method of claim 1, wherein the time period for the ECG data to describe the ECG of the mammal spans multiple cardiac cycles of the mammal.
5. The computer-implemented method of claim 1, wherein the mammal is a human.
6. The computer-implemented method of claim 1, wherein the ejection fraction predictive model is a regression model.
7. The computer-implemented method of claim 1, wherein the ejection fraction predictive model is a machine learning model.
8. The computer-implemented method of claim 7, wherein the ejection fraction predictive model is a neural network.
9. The computer-implemented method of claim 8, wherein the neural network is a feed-forward neural network, a convolutional neural network, or a recurrent neural network.
10. The computer-implemented method of claim 1, wherein the estimated ejection fraction characteristic of the mammal is a value representing an absolute estimate of the ejection fraction of the mammal.
11. The computer-implemented method of claim 1, wherein the estimated ejection fraction characteristic of the mammal is indicative of an estimated range of the ejection fraction of the mammal.
12. The computer-implemented method of claim 1, wherein providing the estimated ejection fraction characteristic of the mammal for output comprises providing the estimated ejection fraction characteristic for presentation to the mammal or a healthcare provider associated with the mammal.
13. The computer-implemented method of claim 1, further comprising generating the predictive input by determining values of one or more morphological features of the ECG of the mammal, wherein the predictive input indicates the values of the one or more morphological features of the ECG of the mammal.
14. The computer-implemented method of claim 13, wherein the morphological feature of the ECG of the mammal comprises at least one of a T-wave amplitude, a P-wave area, a T-wave left slope, a T-wave right slope, a P-wave left slope, a P-wave right slope, a T-wave duration, a P-wave duration, a PR interval, a QRS duration, a QRS amplitude, a QRS area, a QRS energy, a QRS peak-to-peak ratio, or a QT segment length.
15. The computer-implemented method of claim 1, wherein the ejection fraction predictive model is personalized for the mammal.
16. One or more non-transitory computer-readable media encoded with instructions that, when executed by one or more processors of a system, cause the one or more processors to perform operations comprising:
receiving, by the system, Electrocardiogram (ECG) data describing an ECG of the mammal over a period of time;
providing, by the system, predictive input derived from the ECG data to an ejection fraction predictive model;
processing the predictive input using the ejection fraction predictive model to generate an estimated ejection fraction characteristic of the mammal; and
providing the estimated ejection fraction characteristic of the mammal for output.
17. The computer-readable medium of claim 16, wherein the ECG data includes one or more channels, each channel including a subset of respective leads in the ECG data that describe the ECG of the mammal over the time period,
wherein the predictive input characterizes the respective lead of the ECG for each of the one or more channels of the ECG data.
18. The computer-readable medium of claim 17, wherein the ECG data includes a plurality of channels, each channel including a subset of a respective one of a plurality of leads in the ECG data that describes the ECG of the mammal over the time period,
wherein the predictive input characterizes the plurality of leads of the ECG for each of the plurality of channels of the ECG data.
19. The computer readable medium of claim 16, wherein the time period for the ECG data to describe the ECG of the mammal spans multiple cardiac cycles of the mammal.
20. The computer-readable medium of claim 16, wherein the mammal is a human.
21. The computer-readable medium of claim 16, wherein the ejection fraction predictive model is a regression model.
22. The computer-readable medium of claim 16, wherein the ejection fraction predictive model is a machine learning model.
23. The computer-readable medium of claim 22, wherein the predictive model of ejection fraction is a neural network.
24. The computer-readable medium of claim 23, wherein the neural network is a feed-forward neural network, a convolutional neural network, or a recurrent neural network.
25. The computer-readable medium of claim 16, wherein the estimated ejection fraction characteristic of the mammal is a value representing an absolute estimate of the ejection fraction of the mammal.
26. The computer-readable medium of claim 16, wherein the estimated ejection fraction characteristic of the mammal is indicative of an estimated range of the ejection fraction of the mammal.
27. The computer-readable medium of claim 16, wherein providing the estimated ejection fraction characteristic of the mammal for output comprises providing the estimated ejection fraction characteristic for presentation to the mammal or a healthcare provider associated with the mammal.
28. The computer-readable medium of claim 16, wherein the operations further comprise generating the predictive input by determining values for one or more morphological features of the ECG of the mammal, wherein the predictive input indicates the values for the one or more morphological features of the ECG of the mammal.
29. The computer-readable medium of claim 16, wherein the morphological feature of the ECG of the mammal comprises at least one of T-wave amplitude, P-wave area, T-wave left slope, T-wave right slope, P-wave left slope, P-wave right slope, T-wave duration, P-wave duration, PR interval, QRS duration, QRS amplitude, QRS area, QRS energy, QRS peak-to-peak ratio, or QT segment length.
30. The computer-readable medium of claim 16, wherein the ejection fraction predictive model is personalized for the mammal.
31. A computing system, comprising:
one or more processors; and
one or more computer-readable media encoded with instructions that, when executed by the one or more processors, cause the one or more processors to perform the method of any of claims 1-15.
32. A method for detecting asymptomatic low left ventricular dysfunction (a L VD) in a mammal, comprising:
acquiring Electrocardiogram (ECG) data describing an ECG of the mammal over a period of time; and
using a machine learning model to detect the presence of a L VD in the mammal based on the ECG data.
33. The method of claim 32, wherein acquiring the ECG data comprises capturing the ECG of the mammal from a data acquisition device coupled to ECG electrodes affixed to the mammal to form one or more leads.
34. The method of claim 32, wherein the mammal is a human.
35. The method of claim 32, wherein the ECG data describes a single lead ECG of the mammal.
36. The method of claim 35, wherein the single lead ECG corresponds to one of the leads in a 12 lead ECG.
37. The method of claim 36, wherein the one of the leads of the 12-lead ECG for which the single-lead ECG corresponds is lead 1, lead 2, lead 3, AvF, Av L, AvR, or V1-V6.
38. The method of claim 32, wherein the ECG data describes a multi-lead ECG of the mammal.
39. The method of claim 32, wherein the ECG data is captured from ECG electrodes integrated with or communicatively coupled to a smartphone, tablet, watch body, watch band, or wearable patch.
40. The method of claim 32, wherein the machine learning model comprises one or more of a convolutional neural network, a neural network with fully connected layers, a recursive neural network, a capsule network, and a neural network with a self-encoder.
41. The method of claim 32, wherein the ECG data describes a limited portion of the ECG for the mammal over a time period that is less than or equal to 60 seconds, 30 seconds, 20 seconds, 15 seconds, 10 seconds, 5 seconds, or 2 seconds.
42. The method of claim 32, wherein the ECG data is limited to a single beat describing the ECG from the mammal.
43. The method of claim 32, wherein the ECG data is limited to a single average beat describing the ECG from the mammal.
44. The method of claim 32, wherein the ECG data is limited to describing only a single median beat of the ECG from the mammal.
45. The method of any one of claims 42-44, wherein the ECG data describes a single beat and the data is multidimensional and extracted from a vector electrocardiogram.
46. A method of training a machine learning model to be invariant to lead displacement and invariant to body position when using one or more physical leads, the virtual leads being mathematically calculated from a set of leads, by using virtual leads for data enhancement during the training.
47. The method of claim 46, wherein the virtual leads are calculated from a 12 lead ECG device.
48. The method of claim 46, wherein the virtual leads are calculated from a multi-lead patch.
49. The method of claim 46, wherein the virtual lead comprises a weighted average of two or more positive leads selected from the group of leads consisting of leads 1-3, AvR, Av L, and AvF for mimicking electrode displacement or heart rotation in a vertical plane.
50. The method of claim 46, wherein the virtual lead comprises a weighted average of two or more lateral leads selected from a group of leads consisting of V1-V6 for mimicking electrode displacement or cardiac rotation in a horizontal plane.
51. The method of claim 46, wherein the virtual lead comprises a weighted average of all 12 leads for mimicking electrode displacement or cardiac rotation in both planes.
Applications Claiming Priority (5)
| Application Number | Priority Date | Filing Date | Title |
|---|---|---|---|
| US201762569268P | 2017-10-06 | 2017-10-06 | |
| US62/569,268 | 2017-10-06 | ||
| US201762599163P | 2017-12-15 | 2017-12-15 | |
| US62/599,163 | 2017-12-15 | ||
| PCT/US2018/054371 WO2019070978A1 (en) | 2017-10-06 | 2018-10-04 | Ecg-based cardiac ejection-fraction screening |
Publications (1)
| Publication Number | Publication Date |
|---|---|
| CN111432720A true CN111432720A (en) | 2020-07-17 |
Family
ID=65995234
Family Applications (1)
| Application Number | Title | Priority Date | Filing Date |
|---|---|---|---|
| CN201880078887.2A Pending CN111432720A (en) | 2017-10-06 | 2018-10-04 | ECG-based cardiac ejection fraction screening |
Country Status (7)
| Country | Link |
|---|---|
| US (3) | US20200397313A1 (en) |
| EP (1) | EP3691524A4 (en) |
| JP (2) | JP7262452B2 (en) |
| CN (1) | CN111432720A (en) |
| AU (1) | AU2018346412B2 (en) |
| CA (1) | CA3078519A1 (en) |
| WO (1) | WO2019070978A1 (en) |
Cited By (3)
| Publication number | Priority date | Publication date | Assignee | Title |
|---|---|---|---|---|
| CN112270951A (en) * | 2020-11-10 | 2021-01-26 | 四川大学 | Brand-new molecule generation method based on multitask capsule self-encoder neural network |
| CN116721777A (en) * | 2023-08-10 | 2023-09-08 | 中国医学科学院药用植物研究所 | Neural network-based drug efficacy evaluation method, device, equipment and medium |
| CN117058149A (en) * | 2023-10-12 | 2023-11-14 | 中南大学 | Method for training and identifying medical image measurement model of osteoarthritis |
Families Citing this family (34)
| Publication number | Priority date | Publication date | Assignee | Title |
|---|---|---|---|---|
| WO2016070128A1 (en) | 2014-10-31 | 2016-05-06 | Irhythm Technologies, Inc. | Wireless physiological monitoring device and systems |
| US11672464B2 (en) | 2015-10-27 | 2023-06-13 | Cardiologs Technologies Sas | Electrocardiogram processing system for delineation and classification |
| JP2020531225A (en) | 2017-08-25 | 2020-11-05 | カーディオログス テクノロジーズ エスアーエス | User interface for electrocardiogram analysis |
| US11484273B2 (en) * | 2018-03-06 | 2022-11-01 | International Business Machines Corporation | Determining functional age indices based upon sensor data |
| US11931207B2 (en) * | 2018-12-11 | 2024-03-19 | Eko.Ai Pte. Ltd. | Artificial intelligence (AI) recognition of echocardiogram images to enhance a mobile ultrasound device |
| US11446009B2 (en) * | 2018-12-11 | 2022-09-20 | Eko.Ai Pte. Ltd. | Clinical workflow to diagnose heart disease based on cardiac biomarker measurements and AI recognition of 2D and doppler modality echocardiogram images |
| US20210264238A1 (en) * | 2018-12-11 | 2021-08-26 | Eko.Ai Pte. Ltd. | Artificial intelligence (ai)-based guidance for an ultrasound device to improve capture of echo image views |
| US11301996B2 (en) * | 2018-12-11 | 2022-04-12 | Eko.Ai Pte. Ltd. | Training neural networks of an automatic clinical workflow that recognizes and analyzes 2D and doppler modality echocardiogram images |
| US20200293590A1 (en) * | 2019-03-17 | 2020-09-17 | Kirill Rebrov | Computer-implemented Method and System for Age Classification of First Names |
| US11445918B2 (en) * | 2019-08-30 | 2022-09-20 | Heart Test Laboratories, Inc. | Electrocardiogram-based assessment of diastolic function |
| US11657921B2 (en) | 2019-09-18 | 2023-05-23 | Tempus Labs, Inc. | Artificial intelligence based cardiac event predictor systems and methods |
| KR20220104144A (en) * | 2019-09-18 | 2022-07-26 | 템퍼스 랩스, 인크. | ECG-Based Future Atrial Fibrillation Predictor Systems and Methods |
| CN110693486B (en) * | 2019-09-27 | 2022-06-14 | 武汉中旗生物医疗电子有限公司 | Electrocardiogram abnormity labeling method and device |
| US11617528B2 (en) * | 2019-10-08 | 2023-04-04 | GE Precision Healthcare LLC | Systems and methods for reduced lead electrocardiogram diagnosis using deep neural networks and rule-based systems |
| JP7455295B2 (en) | 2020-01-15 | 2024-03-26 | 国立大学法人 東京医科歯科大学 | Biological information processing device and its control method |
| KR102563372B1 (en) | 2020-02-12 | 2023-08-03 | 아이리듬 테크놀로지스, 아이엔씨 | Method for Inferring Patient Physiological Characteristics Using Non-Invasive Cardiac Monitors and Recorded Cardiac Data |
| DE102020203848A1 (en) | 2020-03-25 | 2021-09-30 | Siemens Healthcare Gmbh | Method and device for controlling a medical device |
| CN111879772B (en) * | 2020-07-28 | 2021-11-05 | 食安慧(深圳)科技股份有限公司 | Food safety intelligent management method and system based on big data |
| DE102020004698A1 (en) | 2020-08-03 | 2022-02-03 | Hochschule Offenburg | Control for extracorporeal circulatory support |
| CN116322497A (en) | 2020-08-06 | 2023-06-23 | 意锐瑟科技公司 | Viscous physiological monitoring device |
| KR20230047456A (en) | 2020-08-06 | 2023-04-07 | 아이리듬 테크놀로지스, 아이엔씨 | Electrical Components for Physiological Monitoring Devices |
| US11457889B2 (en) * | 2021-01-25 | 2022-10-04 | Lazaro Eduardo Hernandez | System and method of non-invasive continuous echocardiographic monitoring |
| CN113077874B (en) * | 2021-03-19 | 2023-11-28 | 浙江大学 | Intelligent auxiliary diagnosis and treatment system and method for rehabilitation of spine diseases based on infrared thermal images |
| CN113080996B (en) * | 2021-04-08 | 2022-11-18 | 大同千烯科技有限公司 | Electrocardiogram analysis method and device based on target detection |
| KR102483567B1 (en) * | 2021-04-21 | 2023-01-04 | 주식회사 메디코아 | Method and system for predicting HRV index of 5 minutes or 3 minutes based on artificial intelligence from HRV data of less than 3 minutes |
| WO2022251747A1 (en) | 2021-05-28 | 2022-12-01 | Tempus Labs, Inc. | Ecg-based cardiovascular disease detection systems and related methods |
| KR102607446B1 (en) * | 2021-08-27 | 2023-11-30 | 주식회사 팬토믹스 | Heart failure diagnosis method by measuring ventricular ejection fraction |
| WO2023057200A1 (en) * | 2021-10-04 | 2023-04-13 | Biotronik Se & Co. Kg | Computer implemented method for determining a medical parameter, training method and system |
| WO2023097315A1 (en) * | 2021-11-29 | 2023-06-01 | Icahn School Of Medicine At Mount Sinai | Systems and methods for electrocardiogram deep learning interpretability |
| US20230309967A1 (en) * | 2022-04-05 | 2023-10-05 | Akhil VAID | Surfacing insights into left and right ventricular dysfunction through deep learning |
| WO2023230345A1 (en) * | 2022-05-27 | 2023-11-30 | Yale University | Articles and methods for format independent detection of hidden cardiovascular disease from printed electrocardiographic images using deep learning |
| TW202400082A (en) * | 2022-06-20 | 2024-01-01 | 陳崗熒 | Method for transforming index value based on ecg signal and system thereof |
| CN114831643B (en) * | 2022-07-04 | 2022-10-04 | 南京大学 | Electrocardiosignal monitoring devices and wearable equipment |
| WO2024049563A1 (en) * | 2022-08-29 | 2024-03-07 | Medtronic, Inc. | Identifying ejection fraction using a single lead cardiac electrogram sensed by a medical device |
Family Cites Families (13)
| Publication number | Priority date | Publication date | Assignee | Title |
|---|---|---|---|---|
| US4245646A (en) * | 1978-06-19 | 1981-01-20 | Picker Corporation | Nuclear cardiology apparatus and method |
| WO2007109059A2 (en) * | 2006-03-15 | 2007-09-27 | Board Of Trustees Of Michigan State University | Method and apparatus for determining ejection fraction |
| WO2009118729A2 (en) * | 2008-03-24 | 2009-10-01 | Deepbreeze Ltd. | Methods and systems for use in determination of a patient's heart condition |
| US8634911B2 (en) * | 2010-10-29 | 2014-01-21 | Medtronic, Inc. | Pacing interval determination for ventricular dyssynchrony |
| US20130165776A1 (en) * | 2011-12-22 | 2013-06-27 | Andreas Blomqvist | Contraction status assessment |
| US9968265B2 (en) * | 2012-08-17 | 2018-05-15 | Analytics For Life | Method and system for characterizing cardiovascular systems from single channel data |
| CN105228509B (en) * | 2013-03-14 | 2019-08-20 | 心脏起搏器股份公司 | Avoid the heart failure management being hospitalized again |
| US9737229B1 (en) * | 2013-06-04 | 2017-08-22 | Analytics For Life | Noninvasive electrocardiographic method for estimating mammalian cardiac chamber size and mechanical function |
| US9700219B2 (en) | 2013-10-17 | 2017-07-11 | Siemens Healthcare Gmbh | Method and system for machine learning based assessment of fractional flow reserve |
| US10039468B2 (en) * | 2013-11-12 | 2018-08-07 | Analytics For Life Inc. | Noninvasive electrocardiographic method for estimating mammalian cardiac chamber size and mechanical function |
| EP3166482B1 (en) | 2014-07-07 | 2019-09-25 | Zoll Medical Corporation | System and method for distinguishing a cardiac event from noise in an electrocardiogram (ecg) signal |
| EP3399907A4 (en) * | 2016-01-04 | 2019-08-28 | Aventusoft, LLC | System and method of measuring hemodynamic parameters from the heart valve signals |
| US20170347899A1 (en) * | 2016-06-03 | 2017-12-07 | FOURTH FRONTIER TECHNOLOGIES, Pvt. Ltd. | Method and system for continuous monitoring of cardiovascular health |
-
2018
- 2018-10-04 AU AU2018346412A patent/AU2018346412B2/en active Active
- 2018-10-04 US US16/754,007 patent/US20200397313A1/en active Pending
- 2018-10-04 EP EP18864365.4A patent/EP3691524A4/en active Pending
- 2018-10-04 JP JP2020519717A patent/JP7262452B2/en active Active
- 2018-10-04 WO PCT/US2018/054371 patent/WO2019070978A1/en unknown
- 2018-10-04 CA CA3078519A patent/CA3078519A1/en active Pending
- 2018-10-04 CN CN201880078887.2A patent/CN111432720A/en active Pending
-
2022
- 2022-11-07 US US18/053,200 patent/US20230089991A1/en active Pending
-
2023
- 2023-04-11 JP JP2023064119A patent/JP2023089112A/en active Pending
- 2023-10-31 US US18/385,523 patent/US20240081653A1/en active Pending
Cited By (5)
| Publication number | Priority date | Publication date | Assignee | Title |
|---|---|---|---|---|
| CN112270951A (en) * | 2020-11-10 | 2021-01-26 | 四川大学 | Brand-new molecule generation method based on multitask capsule self-encoder neural network |
| CN116721777A (en) * | 2023-08-10 | 2023-09-08 | 中国医学科学院药用植物研究所 | Neural network-based drug efficacy evaluation method, device, equipment and medium |
| CN116721777B (en) * | 2023-08-10 | 2023-10-27 | 中国医学科学院药用植物研究所 | Neural network-based drug efficacy evaluation method, device, equipment and medium |
| CN117058149A (en) * | 2023-10-12 | 2023-11-14 | 中南大学 | Method for training and identifying medical image measurement model of osteoarthritis |
| CN117058149B (en) * | 2023-10-12 | 2024-01-02 | 中南大学 | Method for training and identifying medical image measurement model of osteoarthritis |
Also Published As
| Publication number | Publication date |
|---|---|
| AU2018346412B2 (en) | 2023-11-23 |
| EP3691524A1 (en) | 2020-08-12 |
| US20230089991A1 (en) | 2023-03-23 |
| US20240081653A1 (en) | 2024-03-14 |
| JP2023089112A (en) | 2023-06-27 |
| JP2020536629A (en) | 2020-12-17 |
| WO2019070978A1 (en) | 2019-04-11 |
| JP7262452B2 (en) | 2023-04-21 |
| US20200397313A1 (en) | 2020-12-24 |
| CA3078519A1 (en) | 2019-04-11 |
| EP3691524A4 (en) | 2021-08-11 |
| AU2018346412A1 (en) | 2020-04-30 |
Similar Documents
| Publication | Publication Date | Title |
|---|---|---|
| CN111432720A (en) | ECG-based cardiac ejection fraction screening | |
| JP6567728B2 (en) | How to predict patient survival | |
| Romiti et al. | Artificial intelligence (AI) and cardiovascular diseases: An unexpected alliance | |
| CN112118783A (en) | Monitoring physiological status based on biological vibration and radio frequency data analysis | |
| KR20220104144A (en) | ECG-Based Future Atrial Fibrillation Predictor Systems and Methods | |
| US11000235B2 (en) | Monitoring procedure for early warning of cardiac episodes | |
| US20230335289A1 (en) | Systems and methods for generating health risk assessments | |
| US20230420132A1 (en) | Noninvasive heart failure detection | |
| Van den Eynde et al. | Successfully implemented artificial intelligence and machine learning applications in cardiology: State-of-the-art review | |
| Jiang et al. | Detection of left atrial enlargement using a convolutional neural network-enabled electrocardiogram | |
| US20210361217A1 (en) | Ecg-based age and sex estimation | |
| US20220087577A1 (en) | Method, apparatus and program for measuring electrocardiogram-based blood glucose using artificial intelligence | |
| Quartieri et al. | Artificial intelligence cloud platform improves arrhythmia detection from insertable cardiac monitors to 25 cardiac rhythm patterns through multi-label classification | |
| Zhu et al. | An intelligent cardiac health monitoring and review system | |
| Honarvar et al. | Enhancing convolutional neural network predictions of electrocardiograms with left ventricular dysfunction using a novel sub-waveform representation | |
| US20230389850A1 (en) | Noninvasive infarct size determination | |
| Gunduz | Heart Failure Detection with Deep Networks Based on Electrocardiography and Impedance Cardiography Signals | |
| González et al. | Multi-modal heart failure risk estimation based on short ECG and sampled long-term HRV | |
| Dhar et al. | Heart Failure Readmission Prediction Using Seismocardiogram Signal | |
| WO2023133166A9 (en) | System and method for determining a cardiac health status | |
| Ulka | Cardiac Health Assessment using HRV analysis | |
| ATTIA et al. | 11 Artificial Intelligence in Cardiovascular Medicine |
Legal Events
| Date | Code | Title | Description |
|---|---|---|---|
| PB01 | Publication | ||
| PB01 | Publication | ||
| WD01 | Invention patent application deemed withdrawn after publication |
Application publication date: 20200717 |
|
| WD01 | Invention patent application deemed withdrawn after publication |