WO2008067551A2 - Genetic analysis systems and methods - Google Patents
Genetic analysis systems and methods Download PDFInfo
- Publication number
- WO2008067551A2 WO2008067551A2 PCT/US2007/086138 US2007086138W WO2008067551A2 WO 2008067551 A2 WO2008067551 A2 WO 2008067551A2 US 2007086138 W US2007086138 W US 2007086138W WO 2008067551 A2 WO2008067551 A2 WO 2008067551A2
- Authority
- WO
- WIPO (PCT)
- Prior art keywords
- individual
- phenotype
- genotype
- profile
- risk
- Prior art date
Links
Classifications
-
- G—PHYSICS
- G16—INFORMATION AND COMMUNICATION TECHNOLOGY [ICT] SPECIALLY ADAPTED FOR SPECIFIC APPLICATION FIELDS
- G16B—BIOINFORMATICS, i.e. INFORMATION AND COMMUNICATION TECHNOLOGY [ICT] SPECIALLY ADAPTED FOR GENETIC OR PROTEIN-RELATED DATA PROCESSING IN COMPUTATIONAL MOLECULAR BIOLOGY
- G16B50/00—ICT programming tools or database systems specially adapted for bioinformatics
- G16B50/30—Data warehousing; Computing architectures
-
- G—PHYSICS
- G16—INFORMATION AND COMMUNICATION TECHNOLOGY [ICT] SPECIALLY ADAPTED FOR SPECIFIC APPLICATION FIELDS
- G16B—BIOINFORMATICS, i.e. INFORMATION AND COMMUNICATION TECHNOLOGY [ICT] SPECIALLY ADAPTED FOR GENETIC OR PROTEIN-RELATED DATA PROCESSING IN COMPUTATIONAL MOLECULAR BIOLOGY
- G16B20/00—ICT specially adapted for functional genomics or proteomics, e.g. genotype-phenotype associations
-
- C—CHEMISTRY; METALLURGY
- C12—BIOCHEMISTRY; BEER; SPIRITS; WINE; VINEGAR; MICROBIOLOGY; ENZYMOLOGY; MUTATION OR GENETIC ENGINEERING
- C12Q—MEASURING OR TESTING PROCESSES INVOLVING ENZYMES, NUCLEIC ACIDS OR MICROORGANISMS; COMPOSITIONS OR TEST PAPERS THEREFOR; PROCESSES OF PREPARING SUCH COMPOSITIONS; CONDITION-RESPONSIVE CONTROL IN MICROBIOLOGICAL OR ENZYMOLOGICAL PROCESSES
- C12Q1/00—Measuring or testing processes involving enzymes, nucleic acids or microorganisms; Compositions therefor; Processes of preparing such compositions
- C12Q1/68—Measuring or testing processes involving enzymes, nucleic acids or microorganisms; Compositions therefor; Processes of preparing such compositions involving nucleic acids
- C12Q1/6813—Hybridisation assays
- C12Q1/6827—Hybridisation assays for detection of mutation or polymorphism
-
- C—CHEMISTRY; METALLURGY
- C12—BIOCHEMISTRY; BEER; SPIRITS; WINE; VINEGAR; MICROBIOLOGY; ENZYMOLOGY; MUTATION OR GENETIC ENGINEERING
- C12Q—MEASURING OR TESTING PROCESSES INVOLVING ENZYMES, NUCLEIC ACIDS OR MICROORGANISMS; COMPOSITIONS OR TEST PAPERS THEREFOR; PROCESSES OF PREPARING SUCH COMPOSITIONS; CONDITION-RESPONSIVE CONTROL IN MICROBIOLOGICAL OR ENZYMOLOGICAL PROCESSES
- C12Q1/00—Measuring or testing processes involving enzymes, nucleic acids or microorganisms; Compositions therefor; Processes of preparing such compositions
- C12Q1/68—Measuring or testing processes involving enzymes, nucleic acids or microorganisms; Compositions therefor; Processes of preparing such compositions involving nucleic acids
- C12Q1/6813—Hybridisation assays
- C12Q1/6834—Enzymatic or biochemical coupling of nucleic acids to a solid phase
- C12Q1/6837—Enzymatic or biochemical coupling of nucleic acids to a solid phase using probe arrays or probe chips
-
- C—CHEMISTRY; METALLURGY
- C12—BIOCHEMISTRY; BEER; SPIRITS; WINE; VINEGAR; MICROBIOLOGY; ENZYMOLOGY; MUTATION OR GENETIC ENGINEERING
- C12Q—MEASURING OR TESTING PROCESSES INVOLVING ENZYMES, NUCLEIC ACIDS OR MICROORGANISMS; COMPOSITIONS OR TEST PAPERS THEREFOR; PROCESSES OF PREPARING SUCH COMPOSITIONS; CONDITION-RESPONSIVE CONTROL IN MICROBIOLOGICAL OR ENZYMOLOGICAL PROCESSES
- C12Q1/00—Measuring or testing processes involving enzymes, nucleic acids or microorganisms; Compositions therefor; Processes of preparing such compositions
- C12Q1/68—Measuring or testing processes involving enzymes, nucleic acids or microorganisms; Compositions therefor; Processes of preparing such compositions involving nucleic acids
- C12Q1/6876—Nucleic acid products used in the analysis of nucleic acids, e.g. primers or probes
- C12Q1/6883—Nucleic acid products used in the analysis of nucleic acids, e.g. primers or probes for diseases caused by alterations of genetic material
- C12Q1/6886—Nucleic acid products used in the analysis of nucleic acids, e.g. primers or probes for diseases caused by alterations of genetic material for cancer
-
- G—PHYSICS
- G01—MEASURING; TESTING
- G01N—INVESTIGATING OR ANALYSING MATERIALS BY DETERMINING THEIR CHEMICAL OR PHYSICAL PROPERTIES
- G01N33/00—Investigating or analysing materials by specific methods not covered by groups G01N1/00 - G01N31/00
- G01N33/48—Biological material, e.g. blood, urine; Haemocytometers
-
- G—PHYSICS
- G16—INFORMATION AND COMMUNICATION TECHNOLOGY [ICT] SPECIALLY ADAPTED FOR SPECIFIC APPLICATION FIELDS
- G16B—BIOINFORMATICS, i.e. INFORMATION AND COMMUNICATION TECHNOLOGY [ICT] SPECIALLY ADAPTED FOR GENETIC OR PROTEIN-RELATED DATA PROCESSING IN COMPUTATIONAL MOLECULAR BIOLOGY
- G16B20/00—ICT specially adapted for functional genomics or proteomics, e.g. genotype-phenotype associations
- G16B20/10—Ploidy or copy number detection
-
- G—PHYSICS
- G16—INFORMATION AND COMMUNICATION TECHNOLOGY [ICT] SPECIALLY ADAPTED FOR SPECIFIC APPLICATION FIELDS
- G16B—BIOINFORMATICS, i.e. INFORMATION AND COMMUNICATION TECHNOLOGY [ICT] SPECIALLY ADAPTED FOR GENETIC OR PROTEIN-RELATED DATA PROCESSING IN COMPUTATIONAL MOLECULAR BIOLOGY
- G16B20/00—ICT specially adapted for functional genomics or proteomics, e.g. genotype-phenotype associations
- G16B20/20—Allele or variant detection, e.g. single nucleotide polymorphism [SNP] detection
-
- G—PHYSICS
- G16—INFORMATION AND COMMUNICATION TECHNOLOGY [ICT] SPECIALLY ADAPTED FOR SPECIFIC APPLICATION FIELDS
- G16B—BIOINFORMATICS, i.e. INFORMATION AND COMMUNICATION TECHNOLOGY [ICT] SPECIALLY ADAPTED FOR GENETIC OR PROTEIN-RELATED DATA PROCESSING IN COMPUTATIONAL MOLECULAR BIOLOGY
- G16B20/00—ICT specially adapted for functional genomics or proteomics, e.g. genotype-phenotype associations
- G16B20/40—Population genetics; Linkage disequilibrium
-
- G—PHYSICS
- G16—INFORMATION AND COMMUNICATION TECHNOLOGY [ICT] SPECIALLY ADAPTED FOR SPECIFIC APPLICATION FIELDS
- G16B—BIOINFORMATICS, i.e. INFORMATION AND COMMUNICATION TECHNOLOGY [ICT] SPECIALLY ADAPTED FOR GENETIC OR PROTEIN-RELATED DATA PROCESSING IN COMPUTATIONAL MOLECULAR BIOLOGY
- G16B50/00—ICT programming tools or database systems specially adapted for bioinformatics
-
- C—CHEMISTRY; METALLURGY
- C12—BIOCHEMISTRY; BEER; SPIRITS; WINE; VINEGAR; MICROBIOLOGY; ENZYMOLOGY; MUTATION OR GENETIC ENGINEERING
- C12Q—MEASURING OR TESTING PROCESSES INVOLVING ENZYMES, NUCLEIC ACIDS OR MICROORGANISMS; COMPOSITIONS OR TEST PAPERS THEREFOR; PROCESSES OF PREPARING SUCH COMPOSITIONS; CONDITION-RESPONSIVE CONTROL IN MICROBIOLOGICAL OR ENZYMOLOGICAL PROCESSES
- C12Q2600/00—Oligonucleotides characterized by their use
- C12Q2600/156—Polymorphic or mutational markers
-
- C—CHEMISTRY; METALLURGY
- C12—BIOCHEMISTRY; BEER; SPIRITS; WINE; VINEGAR; MICROBIOLOGY; ENZYMOLOGY; MUTATION OR GENETIC ENGINEERING
- C12Q—MEASURING OR TESTING PROCESSES INVOLVING ENZYMES, NUCLEIC ACIDS OR MICROORGANISMS; COMPOSITIONS OR TEST PAPERS THEREFOR; PROCESSES OF PREPARING SUCH COMPOSITIONS; CONDITION-RESPONSIVE CONTROL IN MICROBIOLOGICAL OR ENZYMOLOGICAL PROCESSES
- C12Q2600/00—Oligonucleotides characterized by their use
- C12Q2600/172—Haplotypes
-
- Y—GENERAL TAGGING OF NEW TECHNOLOGICAL DEVELOPMENTS; GENERAL TAGGING OF CROSS-SECTIONAL TECHNOLOGIES SPANNING OVER SEVERAL SECTIONS OF THE IPC; TECHNICAL SUBJECTS COVERED BY FORMER USPC CROSS-REFERENCE ART COLLECTIONS [XRACs] AND DIGESTS
- Y02—TECHNOLOGIES OR APPLICATIONS FOR MITIGATION OR ADAPTATION AGAINST CLIMATE CHANGE
- Y02A—TECHNOLOGIES FOR ADAPTATION TO CLIMATE CHANGE
- Y02A90/00—Technologies having an indirect contribution to adaptation to climate change
- Y02A90/10—Information and communication technologies [ICT] supporting adaptation to climate change, e.g. for weather forecasting or climate simulation
Definitions
- SNPs are relatively rare in the human genome, they account for a majority of DNA sequence variations between individuals, occurring approximately once every 1,200 base pairs in the human genome (see International HapMap Project, www.hapmap.org). As more human genetic information becomes available, the complexity of SNPs is beginning to be understood. In turn, the occurrences of SNPs in the genome are becoming correlated to the presence of and/or susceptibility to various diseases and conditions.
- the present invention provides a method of assessing an individual's genotype correlations comprising: a) obtaining a genetic sample of the individual, b) generating a genomic pro e or e in ivi ua , c etermining t e in ivi ua s genotype correlations with phenotypes by comparing the individual's genomic profile to a current database of human genotype correlations with phenotypes, d) reporting the results from step c) to the individual or a health care manager of the individual, e) updating the database of human genotype correlations with an additional human genotype correlation as the additional human genotype correlation becomes known, f) updating the individual's genotype correlations by comparing the individual's genomic profile from step c) or a portion thereof to the additional human genotype correlation and determining an additional genotype correlation of the individual, and g) reporting the results from step f) to the individual or the health care manager of the individual.
- the present invention further provides a business method of assessing genotype correlations of an individual comprising: a) obtaining a genetic sample of the individual; b) generating a genomic profile for the individual; c) determining the individual's genotype correlations by comparing the individual's genomic profile to a database of human genotype correlations; d) providing results of the determining of the individual's genotype correlations to the individual in a secure manner; e) updating the database of human genotype correlations with an additional human genotype correlation as the additional human genotype correlation becomes known; f) updating the individual's genotype correlations by comparing the individual's genomic profile or a portion thereof to the additional human genotype correlation and determining an additional genotype correlation of the individual; and g) providing results of the updating of the individual's genotype correlations to the individual of the health care manager of the individual.
- Another aspect of the present invention is a method generating a phenotype profile for an individual comprising: a) providing a rule set comprising rules, each rule indicating a correlation between at least one genotype and at least one phenotype, b) providing a data set comprising genomic profiles of each of a plurality of individuals, wherein each genomic profile comprises a plurality of genotypes; c) periodically updating the rule set with at least one new rule, wherein the at least one new rule indicates a correlation between a genotype and a phenotype not previously correlated with each other in the rule set; d) applying each new rule to the genomic profile of at least one of the individuals, thereby correlating at least one genotype with at least one phenotype for the individual, and optionally, e) generating a report comprising the phenotype profile of the individual.
- the present invention also provides a system comprising a) a rule set comprising rules, each rule indicating a correlation between at least one genotype and at least one phenotype; co e t at pe o ca y up ates t e ru e set w t at east one new ru e, wherein the at least one new rule indicates a correlation between a genotype and a phenotype not previously correlated with each other in the rule set; c) a database comprising genomic profiles of a plurality of individuals; d) code that applies the rule set to the genomic profiles of individuals to determine phenotype profiles for the individuals; and e) code that generates reports for each individual.
- Another aspect of the present invention is transmission over a network, in a secure or non-secure manner, the methods and systems described above.
- FIG. 1 is a flow chart illustrating aspects of the method herein.
- FIG. 2 is an example of a genomic DNA quality control measure.
- FIG. 3 is an example of a hybridization quality control measure.
- FIG. 4 are tables of representative genotype correlations from published literature with test SNPs and effect estimates.
- A-I) represents single locus genotype correlations; J) respresents a two locus genotype correlation; K) represents a three locus genotype correlation; L) is an index of the ethnicity and country abbreviations used in A-K; M) is an index of the abbreviations of the Short Phenotype Names in A-K, the heritability, and the references for the heritability.
- FIG. 5A-J are tables of representative genotype correlations with effect estimates.
- FIG. 6A-F are tables of representative genotype correlations and estimated relative risks.
- FIG. 7 is a sample report. . is a sc ematic o a system or t e ana ysis an transmission ot genomic and phenotype profiles over a network.
- FIG. 9 is a flow chart illustrating aspects of the business method herein
- FIG. 10 The effect of the estimate of the prevalence on the relative risk estimations.
- Each of the plots correspond to a different value of the allele frequencies in the populations, assuming Hardy- Weinberg Equilibrium.
- the two black lines correspond to odds ratio of 9 and 6
- the two red lines correspond to 6 and 4
- the two blue lines correspond to odds ratio of 3 and 2.
- FIG. 11 The effect of the estimate of the allele frequencies on the relative risk estimations.
- Each of the plots correspond to a different value of the prevalence in the populations.
- the two black lines correspond to odds ratio of 9 and 6
- the two red lines correspond to 6 and 4
- the two blue lines correspond to odds ratio of 3 and 2.
- FIG. 12 Pairwise Comparison of the absolute values of the different models
- FIG. 13 Pairwise Comparison of the ranked values (GCI scores) based on the different models. The Spearman correlations between the different pairs are given in Table 2.
- FIG. 14 Effect of Prevalence Reporting on the GCI score.
- the Spearman correlation between any two prevalence values is at least 0.99.
- FIG. 15 are illustrations of sample webpages from a personalized portal.
- FIG. 16 are illustrations of sample webpages from a personalized portal for a person's risk for prostate cancer.
- FIG. 17 are illustrations of sample webpages from a personalized portal for an individual's risk for Crohn's disease.
- FIG. 18 is a histogram of GCI scores for Multiple Sclerosis based on the
- FIG. 19 is an individuals' lifetime risk for Multiple Sclerosis using GCI Plus.
- FIG. 20 is a histogram of GCI scores for Crohn's disease.
- FIG. 21 is a table of multilocus correlations. . : is a ta e o s an p enotype corre ations.
- FIG. 23 is a table of phenotypes and prevalences.
- FIG. 24 is a glossary for abbreviations in FIGS. 21 , 22, and 25.
- FIG. 25 is a table of SNPs and phenotype correlations.
- Genomic profiles are generated by determining genotypes from biological samples obtained from individuals.
- Biological samples obtained from individuals may be any sample from which a genetic sample may be derived. Samples may be from buccal swabs, saliva, blood, hair, or any other type of tissue sample. Genotypes may then be determined from the biological samples. Genotypes may be any genetic variant or biological marker, for example, single nucleotide polymorphisms (SNPs), haplotypes, or sequences of the genome.
- SNPs single nucleotide polymorphisms
- the genotype may be the entire genomic sequence of an individual.
- the genotypes may result from high-throughput analysis that generates thousands or millions of data points, for example, microarray analysis for most or all of the known SNPs. hi other embodiments, genotypes may also be determined by high throughput sequencing.
- the genotypes form a genomic profile for an individual.
- the genomic profile is stored digitally and is readily accessed at any point of time to generate phenotype profiles.
- Phenotype profiles are generated by applying rules that correlate or associate genotypes with phenotypes. Rules can be made based on scientific research that demonstrates a correlation between a genotype and a phenotype. The correlations may be curated or validated by a committee of one or more experts. By applying the rules to a genomic profile of an individual, the association between an individual's genotype and a phenotype may be determined. The phenotype profile for an individual will have this determination.
- the determination may be a positive association between an individual's genotype and a given phenotype, such that the individual has the given phenotype, or will develop the phenotype. Alternatively, it may be determined that the individual does not have, or will not develop, a given phenotype. In other embodiments, the determination may be a risk factor, estimate, or a probability that an individual has, or will develop a phenotype.
- e e ermina ions may e ma e ase on a num er o rules, tor example, a plurality of rules may be applied to a genomic profile to determine the association of an individual's genotype with a specific phenotype.
- the determinations may also incorporate factors that are specific to an individual, such as ethnicity, gender, lifestyle (for example, diet and exercise habits), age, environment (for example, location of residence), family medical history, personal medical history, and other known phenotypes.
- factors that are specific to an individual such as ethnicity, gender, lifestyle (for example, diet and exercise habits), age, environment (for example, location of residence), family medical history, personal medical history, and other known phenotypes.
- the incorporation of the specific factors may be by modifying existing rules to encompass these factors. Alternatively, separate rules may be generated by these factors and applied to a phenotype determination for an individual after an existing rule has been applied.
- Phenotypes may include any measurable trait or characteristic, such as susceptibility to a certain disease or response to a drug treatment. Other phenotypes that may be included are physical and mental traits, such as height, weight, hair color, eye color, sunburn susceptibility, size, memory, intelligence, level of optimism, and general disposition. Phenotypes may also include genetic comparisons to other individuals or organisms. For example, an individual may be interested in the similarity between their genomic profile and that of a celebrity. They may also have their genomic profile compared to other organisms such as bacteria, plants, or other animals.
- the collection of correlated phenotypes determined for an individual comprises the phenotype profile for the individual.
- the phenotype profile may be accessible by an on-line portal.
- the phenotype profile as it exists at a certain time may be provided in paper form, with subsequent updates also provided in paper form.
- the phenotype profile may also be provided by an on-line portal.
- the on-line portal may optionally be a secure on-line portal. Access to the phenotype profile may be provided to a subscriber, which is an individual who subscribes to the service that generates rules on correlations between phenotypes and genotypes, determines the genomic profile of an individual, applies the rules to the genomic profile, and generates a phenotype profile of the individual.
- Access may also be provided to non-subscribers, wherein they may have limited access to their phenotype profile and/or reports, or may have an initial report or phenotype profile generated, but updated reports will be generated only with purchase of a subscription.
- Health care managers and providers such as caregivers, physicians, and genetic counselors may also have access to the phenotype profile.
- a genomic profile may be generated for subscribers and non-subscribers and stored digitally but access to the phenotype profile and reports may be limited to subscribers.
- both subscribers and non-subscribers may access t eir genotype an p enotype pro i es, ut ave imite access, or have a limitation report generated for non-subscribers, whereas subscribers have full access and may have a full report generated.
- both subscribers and non-subscribers may have full access initially, or full initial reports, but only subscribers may access updated reports based on their stored genomic profile.
- GCI Genetic Composite Index
- This score incorporates known risk factors, as well as other information and assumptions such as the allele frequencies and the prevalence of a disease.
- the GCI can be used to qualitatively estimate the association of a disease or a condition with the combined effect of a set of Genetic markers.
- the GCI score can be used to provide people not trained in genetics with a reliable (i.e., robust), understandable, and/or intuitive sense of what their individual risk of a disease is compared to a relevant population based on current scientific research.
- the GCI score maybe used to generate GCI Plus scores.
- the GCI Plus score may contain all the GCI assumptions, including risk (such as lifetime risk), age-defined prevalence, and/or age-defined incidence of the condition.
- the lifetime risk for the individual may then be calculated as a GCI Plus score which is proportional to the individual's GCI score divided by the average GCI score.
- the average GCI score may be determined from a group of individuals of similar ancestral background, for example a group of Caucasians, Asians, East Indians, or other group with a common ancestral background. Groups may comprise of at least 5, 10, 15, 20, 25, 30, 35, 40, 45, 50, 55, or 60 individuals, hi some embodiments, the average may be determined from at least 75, 80, 95, or 100 individuals.
- the GCI Plus score may be determined by determining the GCI score for an individual, dividing the GCI score by the average relative risk and multiplying by the lifetime risk for a condition or phenotype. For example, using data from FIG. 22 and/or FIG. 25 with information in FIG. 24 to calculate GCI Plus scores such as in FIG. 19.
- the present invention encompasses using the GCI score as described herein, and one of ordinary skill in the art will readily recognize the use of GCI Plus scores or variations thereof, in place of GCI scores as described herein.
- a GCI score is generated for each disease or condition of interest. These GCI scores may be collected to form a risk profile for an individual. The GCI scores may be stored digitally so that they are readily accessible at any point of time to generate risk profiles. Risk profiles may be broken down by broad disease classes, such as cancer, heart sease, meta o c isor ers, psyc atr c sor ers, one isease, or age on-set disor ers. Broad disease classes may be further broken down into subcategories.
- sub-categories of cancer may be listed such as by type (sarcoma, carcinoma or leukemia, etc.) or by tissue specificity (neural, breast, ovaries, testes, prostate, bone, lymph nodes, pancreas, esophagus, stomach, liver, brain, lung, kidneys, etc.).
- a GCI score is generated for an individual, which provides them with easily comprehended information about the individual's risk of acquiring or susceptibility to at least one disease or condition.
- multiple GCI scores are generated for different diseases or conditions.
- at least one GCI score is accessible by an on-line portal.
- at least one GCI score may be provided in paper form, with subsequent updates also provided in paper form.
- access to at least one GCI score is provided to a subscriber, which is an individual who subscribes to the service.
- access is provided to non-subscribers, wherein they may have limited access to at least one of their GCI scores, or they may have an initial report on at least one of their GCI scores generated, but updated reports will be generated only with purchase of a subscription.
- health care managers and providers such as caregivers, physicians, and genetic counselors may also have access to at least one of an individual's GCI scores.
- a basic subscription may provide a phenotype profile where the subscriber may choose to apply all existing rules to their genomic profile, or a subset of the existing rules, to their genomic profile. For example, they may choose to apply only the rules for disease phenotypes that are actionable.
- the basic subscription may have different levels within the subscription class. For example, different levels may be dependent on the number of phenotypes a subscriber wants correlated to their genomic profile, or the number of people that may access their phenotype profile.
- Another level of basic subscription may be to incorporate factors specific to an individual, such as already known phenotypes such as age, gender, or medical history, to their phenotype profile.
- Still another level of the basic subscription may allow an individual to generate at least one GCI score for a disease or condition.
- a variation of this level may further allow an individual to specify for an automatic update of at least one GCI score for a disease or condition to be generated if their is any change in at least one GCI score due to changes in the analysis used to generate at least one GCI score.
- the individual may be notified of the automatic update by email, voice message, text message, mail delivery, or fax.
- u sc ers may a so generate reports t at ave t e r p enotype profile as we as information about the phenotypes, such as genetic and medical information about the phenotype.
- the prevalence of the phenotype in the population, the genetic variant that was used for the correlation, the molecular mechanism that causes the phenotype, therapies for the phenotype, treatment options for the phenotype, and preventative actions may be included in the report.
- the reports may also include information such as the similarity between an individual's genotype and that of other individuals, such as celebrities or other famous people.
- the information on similarity may be, but are not limited to, percentage homology, number of identical variants, and phenotypes that maybe similar.
- These reports may further contain at least one GCI score.
- the report may also provide links to other sites with further information on the phenotypes, links to on-line support groups and message boards of people with the same phenotype or one or more similar phenotypes, links to an on-line genetic counselor or physician, or links to schedule telephonic or in-person appointments with a genetic counselor or physician, if the report is accessed on-line.
- the information may be the website location of the aforementioned links, or the telephone number and address of the genetic counselor or physician.
- the subscriber may also choose which phenotypes to include in their phenotype profile and what information to include in their report.
- the phenotype profile and reports may also be accessible by an individual's health care manager or provider, such as a caregiver, physician, psychiatrist, psychologist, therapist, or genetic counselor.
- the subscriber may be able to choose whether the phenotype profile and reports, or portions thereof, are accessible by such individual's health care manager or provider.
- the present invention may also include a premium level of subscription.
- the premium level of subscription maintains their genomic profile digitally after generation of an initial phenotype profile and report, and provides subscribers the opportunity to generate phenotype profiles and reports with updated correlations from the latest research.
- subscribers have the opportunity to generate risk profile and reports with updated correlations from the latest research. As research reveals new correlations between genotypes and phenotypes, disease or conditions, new rules will be developed based on these new correlations and can be applied to the genomic profile that is already stored and being maintained.
- the new rules may correlate genotypes not previously correlated with any phenotype, correlate genotypes with new phenotypes, modify existing correlations, or provide the basis for adjustment of a GCI score based on a newly discovered association between a genotype and disease or condition.
- Subscribers may be informed of new correlations via e-mail or ot er e ectronic means, an i t e p enotype is o interest, t ey may choose to update t eir phenotype profile with the new correlation.
- Subscribers may choose a subscription where they pay for each update, for a number of updates or an unlimited number of updates for a designated time period (e.g. three months, six months, or one year).
- Another subscription level may be where a subscriber has their phenotype profile or risk profile automatically updated, instead of where the individual chooses when to update their phenotype profile or risk profile, whenever a new rule is generated based on a new correlation.
- subscribers may refer non-subscribers to the service that generates rules on correlations between phenotypes and genotypes, determines the genomic profile of an individual, applies the rules to the genomic profile, and generates a phenotype profile of the individual.
- Referral by a subscriber may give the subscriber a reduced price on subscription to the service, or upgrades to their existing subscriptions.
- Referred individuals may have free access for a limited time or have a discounted subscription price.
- Phenotype profiles and reports as well as risk profiles and reports may be generated for individuals that are human and non-human.
- individuals may include other mammals, such as bovines, equines, ovines, canines, or felines.
- Subscribers as used herein, are human individuals who subscribe to a service by purchase or payment for one or more services. Services may include, but are not limited to, one or more of the following: having their or another individual's, such as the subscriber's child or pet, genomic profile determined, obtaining a phenotype profile, having the phenotype profile updated, and obtaining reports based on their genomic and phenotype profile.
- "field-deployed" mechanisms may be gathered from individuals to generate phenotype profiles for individuals.
- an individual may have an initial phenotype profile generated based on genetic information.
- an initial phenotype profile is generated that includes risk factors for different phenotypes as well as suggested treatments or preventative measures.
- the profile may include information on available medication for a certain condition, and/or suggestions on dietary changes or exercise regimens.
- the individual may choose to see, or contact via a web portal or phone call, a physician or genetic counselor, to discuss their phenotype profile.
- the individual may decide to take a certain course of action, for example, take specific medications, change their diet, etc.
- the individual may then subsequently submit biological samples to assess changes in their physical condition and possible change in risk factors.
- Individuals may have the c anges e ermine y irec y su mi ing io ogica samp es o e acility or associate facility, such as a facility contracted by the entity generating the genetic profiles and phenotype profiles us) that generates the genomic profiles and phenotype profiles.
- the individuals may use a "field-deployed" mechanism, wherein the individual may submit their saliva, blood, or other biological sample into a detection device at their home, analyzed by a third party, and the data transmitted to be incorporated into another phenotype profile.
- an individual may have received an initial phenotype report based on their genetic data reporting the individual having an increased lifetime risk of myocardial infarction (MI).
- the report may also have suggestions on preventative measures to reduce the risk of MI, such as cholesterol lowering drugs and change in diet.
- the individual may choose to contact a genetic counselor or physician to discuss the report and the preventative measures and decides to change their diet. After a period of being on the new diet, the individual may see their personal physician to have their cholesterol level measured.
- the new information (cholesterol level) may be transmitted (for example, via the Internet) to the entity with the genomic information, and the new information used to generate a new phenotype profile for the individual, with a new risk factor for myocardial infarction, and/or other conditions.
- the individual may also use a "field-deployed" mechanism, or direct mechanism, to determine their individual response to specific medications.
- a drug For example, an individual may have their response to a drug measured, and the information may be used to determine more effective treatments.
- Measurable information include, but are not limited to, metabolite levels, glucose levels, ion levels (for example, calcium, sodium, potassium, iron), vitamins, blood cell counts, body mass index (BMI), protein levels, transcript levels, heart rate, etc., can be determined by methods readily available and can be factored into an algorithm to combine with initial genomic profiles to determine a modified overall risk estimate score.
- biological sample refers to any biological sample that can be isolated from an individual, including samples from which genetic material may be isolated.
- a “genetic sample” refers to DNA and/or RNA obtained or derived from an individual.
- genomic DNA refers to one or more chromosomal DNA molecules occurring naturally in the nucleus of a human cell, or a portion of the chromosomal DNA molecules.
- genomic profile refers to a set of information about an individual's genes, such as the presence or absence of specific SNPs or mutations.
- Genomic profiles include e geno ypes o in ivi ua s. enomic pro es may a so e su s an ia ly trie complete genomic sequence of an individual.
- the genomic profile may be at least 60%, 80%, or 95% of the complete genomic sequence of an individual.
- the genomic profile may be approximately 100% of the complete genomic sequence of an individual.
- "a portion thereof refers to the genomic profile of a subset of the genomic profile of an entire genome.
- the genotype may include the genetic variants and markers of an individual. Genetic markers and variants may include nucleotide repeats, nucleotide insertions, nucleotide deletions, chromosomal translocations, chromosomal duplications, or copy number variations. Copy number variation may include microsatellite repeats, nucleotide repeats, centromeric repeats, or telomeric repeats.
- the genotypes may also be SNPs, haplotypes, or diplotypes. A haplotype may refer to a locus or an allele. A haplotype is also referred to as a set of single nucleotide polymorphisms (SNPs) on a single chromatid that are statistically associated. A diplotype is a set of haplotypes.
- SNP single nucleotide polymorphism
- A adenosine
- G guanine
- T thymine
- SNP genomic profile refers to the base content of a given individual's DNA at SNP sites throughout the individual's entire genomic DNA sequence.
- a “SNP profile” can refer to an entire genomic profile, or may refer to a portion thereof, such as a more localized SNP profile which can be associated with a particular gene or set of genes.
- Phenotype is used to describe a quantitative trait or characteristic of an individual.
- Phenotypes include, but are not limited to, medical and non-medical conditions. Medical conditions include diseases and disorders. Phenotypes may also include physical traits, such as hair color, physiological traits, such as lung capacity, mental traits, such as memory retention, emotional traits, such as ability to control anger, ethnicity, such as ethnic background, ancestry, such as an individual's place of origin, and age, such as age expectancy or age of onset of different phenotypes.
- Phenotypes may also be monogenic, wherein it is thought that one gene may e corre ate w t a p enotype, or mu t gen c, w ere n more t an one gene is corre ated with a phenotype.
- a "rule” is used to define the correlation between a genotype and a phenotype.
- the rules may define the correlations by a numerical value, for example by a percentage, risk factor, or confidence score.
- a rule may incorporate the correlations of a plurality of genotypes with a phenotype.
- a "rule set" comprises more than one rule.
- a "new rule” may be a rule that indicates a correlation between a genotype and a phenotype for which a rule does not currently exist.
- a new rule may correlate an uncorrelated genotype with a phenotype.
- a new rule may also correlate a genotype that is already correlated with a phenotype to a phenotype it had not been previously correlated to.
- a "new rule” may also be an existing rule that is modified by other factors, including another rule. An existing rule may be modified due to an individual's known characteristics, such as ethnicity, ancestry, geography, gender, age, family history, or other previously determined phenotypes.
- genotype correlation refers to the statistical correlation between an individual's genotype, such as presence of a certain mutation or mutations, and the likelihood of being predisposed to a phenotype, such as a particular disease, condition, physical state, and/or mental state.
- the frequency with which a certain phenotype is observed in the presence of a specific genotype determines the degree of genotype correlation or likelihood of a particular phenotype.
- SNPs giving rise to the apolipoprotein E4 isoform are correlated with being predisposed to early onset Alzheimer's disease.
- Genotype correlations may also refer to correlations wherein there is not a predisposition to a phenotype, or a negative correlation.
- the genotype correlations may also represent an estimate of an individual to have a phenotype or be predisposed to have a phenotype.
- the genotype correlation may be indicated by a numerical value, such as a percentage, a relative risk factor, an effects estimate, or confidence score.
- Phenotype profile refers to a collection of a plurality of phenotypes correlated with a genotype or genotypes of an individual.
- Phenotype profiles may include information generated by applying one or more rules to a genomic profile, or information about genotype correlations that are applied to a genomic profile. Phenotype profiles may be generated by applying rules that correlate a plurality of genotypes with a phenotype.
- the probability or estimate may be expressed as a numerical value, such as a percentage, a numerical risk factor or a numerical confidence interval. The probability may also be expressed as high, moderate, or low.
- the phenotype profiles may also indicate the presence or absence of a phenotype or the risk o eve op ng a p enotype. or examp e, a pnenotype pro e may in icate the presence o ue eyes, or a high risk of developing diabetes.
- the phenotype profiles may also indicate a predicted prognosis, effectiveness of a treatment, or response to a treatment of a medical condition.
- the term risk profile refers to a collection of GCI scores for more than one disease or condition. GCI scores are based on analysis of the association between an individual's genotype with one or more diseases or conditions. Risk profiles may display GCI scores grouped into categories of disease. Further the Risk profiles may display information on how the GCI scores are predicted to change as the individual ages or various risk factors are adjusted. For example, the GCI scores for particular diseases may take into account the effect of changes in diet or preventative measures taken (smoking cessation, drug intake, double radical mastectomies, hysterectomies). The GCI scores may be displayed as a numerical measure, a graphical display, auditory feedback or any combination of the preceding.
- on-line portal refers to a source of information which can be readily accessed by an individual through use of a computer and internet website, telephone, or other means that allow similar access to information.
- the on-line portal may be a secure website.
- the website may provide links to other secure and non-secure websites, for example links to a secure website with the individual's phenotype profile, or to non-secure websites such as a message board for individuals sharing a specific phenotype.
- the practice of the present invention may employ, unless otherwise indicated, conventional techniques and descriptions of molecular biology, cell biology, biochemistry, and immunology, which are within the skill of the art.
- Such conventional techniques include nucleic acid isolation, polymer array synthesis, hybridization, ligation, and detection of hybridization using a label.
- Specific illustrations of suitable techniques are exemplified and referenced herein. However, other equivalent conventional procedures can also be used.
- Other conventional techniques and descriptions can be found in standard laboratory manuals and texts such as
- the individual provides a genetic sample, from which a personal genomic profile is generated.
- the data of the individual's genomic profile is queried for genotype correlations by comparing the profile against a database of established and validated human genotype correlations.
- the database of established and validated genotype correlations may be from peer- reviewed literature and further judged by a committee of one or more experts in the field, such as geneticists, epidemiologists, or statisticians, and curated.
- rules are made based on curated genotype correlations and are applied to an individual's genomic profile to generate a phenotype profile.
- Results of the analysis of the individual's genomic profile, phenotype profile, along with interpretation and supportive information, are provided to the individual of the individual's health care manager, to empower personalized choices for the individual's health care.
- a method of the invention is detailed as in FIG. 1, where an individual's genomic profile is first generated.
- An individual's genomic profile will contain information about an individual's genes based on genetic variations or markers.
- Genetic variations are genotypes, which make up genomic profiles.
- Such genetic variations or markers include, but are not limited to, single nucleotide polymorphisms, single and/or multiple nucleotide repeats, single and/or multiple nucleotide deletions, microsatellite repeats (small numbers of nucleotide repeats with a typical 5-1,000 repeat units), di-nucleotide repeats, tri-nucleotide repeats, sequence rearrangements (including translocation and duplication), copy number variations (both loss and gains at specific loci), and the like.
- Other genetic variations include chromosomal duplications and translocations as well as centromeric and telomeric repeats.
- Genotypes may also include haplotypes and diplotypes.
- genomic profiles may have at least 100,000, 300,000, 500,000, or 1 ,000,000 genotypes.
- the genomic profile may be substantially the complete genomic sequence of an individual.
- the genomic profile is at least 60%, 80%, or 95% of the complete genomic sequence of an individual.
- the genomic profile may be approximately 100% of the complete genomic sequence of an individual.
- Genetic samples that contain the targets include, but are not limited to, unamplified genomic DNA or RNA samples or amplified DNA (or cDNA). The targets may be particular regions of genomic DNA that contain genetic markers of particular interest. n s ep o - .
- a gene ic samp e o an in ivi ua is isolated trom a biological sample of an individual.
- biological samples include, but are not limited to, blood, hair, skin, saliva, semen, urine, fecal material, sweat, buccal, and various bodily tissues.
- tissues samples may be directly collected by the individual, for example, a buccal sample may be obtained by the individual taking a swab against the inside of their cheek.
- Other samples such as saliva, semen, urine, fecal material, or sweat, may also be supplied by the individual themselves.
- Other biological samples may be taken by a health care specialist, such as a phlebotomist, nurse or physician.
- blood samples may be withdrawn from an individual by a nurse.
- Tissue biopsies may be performed by a health care specialist, and kits are also available to health care specialists to efficiently obtain samples.
- a small cylinder of skin may be removed or a needle may be used to remove a small sample of tissue or fluids.
- kits are provided to individuals with sample collection containers for the individual's biological sample.
- the kit may also provide instructions for an individual to directly collect their own sample, such as how much hair, urine, sweat, or saliva to provide.
- the kit may also contain instructions for an individual to request tissue samples to be taken by a health care specialist.
- the kit may include locations where samples may be taken by a third party, for example kits may be provided to health care facilities who in turn collect samples from individuals.
- the kit may also provide return packaging for the sample to be sent to a sample processing facility, where genetic material is isolated from the biological sample in step 104.
- a genetic sample of DNA or RNA may be isolated from a biological sample according to any of several well-known biochemical and molecular biological methods, see, e.g., Sambrook, et al., Molecular Cloning: A Laboratory Manual (Cold Spring Harbor Laboratory, New York) (1989).
- kits and reagents for isolating DNA or RNA from biological samples such as those available from DNA Genotek, Gentra Systems, Qiagen, Ambion, and other suppliers.
- Buccal sample kits are readily available commercially, such as the MasterAmpTM Buccal Swab DNA extraction kit from Epicentre Biotechnologies, as are kits for DNA extraction from blood samples such as Extract-N-AmpTM from Sigma Aldrich.
- DNA from other tissues may be obtained by digesting the tissue with proteases and heat, centrifuging the sample, and using phenol-chloroform to extract the unwanted materials, leaving the DNA in the aqueous phase.
- the DNA can then be further isolated by ethanol precipitation.
- genomic is iso a e om saliva, tor examp e, using DNA self collection kit technology available from DNA Genotek, an individual collects a specimen of saliva for clinical processing. The sample conveniently can be stored and shipped at room temperature.
- DNA is isolated by heat denaturing and protease digesting the sample, typically using reagents supplied by the collection kit supplier at 50 0 C for at least one hour.
- the sample is next centrifuged, and the supernatant is ethanol precipitated.
- the DNA pellet is suspended in a buffer appropriate for subsequent analysis.
- RNA may be used as the genetic sample.
- genetic variations that are expressed can be identified from mRNA.
- the term "messenger RNA” or “mRNA” includes, but is not limited to pre-mRNA transcript(s), transcript processing intermediates, mature mRNA(s) ready for translation and transcripts of the gene or genes, or nucleic acids derived from the mRNA transcript(s). Transcript processing may include splicing, editing and degradation.
- a nucleic acid derived from an mRNA transcript refers to a nucleic acid for whose synthesis the mRNA transcript or a subsequence thereof has ultimately served as a template.
- RNA reverse transcribed from an mRNA a DNA amplified from the cDNA, an RNA transcribed from the amplified DNA, etc.
- RNA can be isolated from any of several bodily tissues using methods known in the art, such as isolation of RNA from unfractionated whole blood using the PAXgeneTM Blood RNA System available from PreAnalytiX.
- mRNA will be used to reverse transcribe cDNA, which will then be used or amplified for gene variation analysis.
- RNA Prior to genomic profile analysis, a genetic sample will typically be amplified, either from DNA or cDNA reverse transcribed from RNA.
- DNA can be amplified by a number of methods, many of which employ PCR. See, for example, PCR Technology: Principles and Applications for DNA Amplification (Ed. H. A. Erlich, Freeman Press, NY, N. Y., 1992); PCR Protocols: A Guide to Methods and Applications (Eds. Innis, et al., Academic Press, San Diego, Calif, 1990); Mattila et al., Nucleic Acids Res. 19, 4967 (1991); Eckert et al., PCR Methods and Applications 1, 17 (1991); PCR (Eds.
- LCR ligase chain reaction
- LCR ligase chain reaction
- DNA for example, Wu and Wallace, Genomics 4, 560 (1989), Landegren et al., Science 241, 1077 (1988) and Ba ⁇ inger et al. Gene 89: 117 (1990)
- transcription amplification Kwoh et al., Proc. Natl. ca . c : - an , se - susta ne sequence replicat on (Guatelli et al, Proc. Nat. Acad. ScL USA, 87:1874-1878 (1990) and WO90/06995)
- selective amplification of target polynucleotide sequences U.S. Pat. No.
- CP-PCR consensus sequence primed polymerase chain reaction
- AP-PCR arbitrarily primed polymerase chain reaction
- NABSA nucleic acid based sequence amplification
- RCA rolling circle amplification
- MDA multiple displacement amplification
- C2CA circle-to-circle amplification
- Generation of a genomic profile in step 106 is performed using any of several methods.
- Several methods are known in the art to identify genetic variations and include, but are not limited to, DNA sequencing by any of several methodologies, PCR based methods, fragment length polymorphism assays (restriction fragment length polymorphism (RFLP), cleavage fragment length polymorphism (CFLP)) hybridization methods using an allele-specific oligonucleotide as a template (e.g., TaqMan PCR method, the invader method, the DNA chip method), methods using a primer extension reaction, mass spectrometry (MALDI-TO F/MS method), and the like.
- RFLP restriction fragment length polymorphism
- CFLP cleavage fragment length polymorphism
- a high density DNA array is used for SNP identification and profile generation.
- Such arrays are commercially available from Affymetrix and Illumina (see Affymetrix GeneChip® 500K Assay Manual, Affymetrix, Santa Clara, CA (incorporated by reference); Sentrix® humanHap650Y genotyping beadchip, Illumina, San Diego, CA).
- a SNP profile can be generated by genotyping more than 900,000
- SNPs using the Affymetrix Genome Wide Human SNP Array 6.0 may be determined by using the Affymetrix GeneChip Human Mapping 500K Array Set.
- a subset of the human genome is amplified through a single primer amplification reaction using restriction enzyme digested, adaptor-ligated human genomic DNA. As shown in FIG. 2, the concentration of the ligated DNA may then be determined. The amplified DNA is then fragmented and the quality of the sample determined prior to continuing with step 106.
- the sample is denatured, labeled, and then hybridized to a microarray cons st ng o sma pro es at spec ic ocat ons on a coate quartz surface.
- the amount o label that hybridizes to each probe as a function of the amplified DNA sequence is monitored, thereby yielding sequence information and resultant SNP genotyping.
- Affymetrix GeneChip 500K Assay Use of the Affymetrix GeneChip 500K Assay is carried out according to the manufacturer's directions. Briefly, isolated genomic DNA is first digested with either a Nspl or Styl restriction endonuclease. The digested DNA is then ligated with a Nspl or Styl adaptor oligonucleotide that respectively anneals to either the Nspl or Styl restricted DNA. The adaptor- containing DNA following ligation is then amplified by PCR to yield amplified DNA fragments between about 200 and 1100 base pairs, as confirmed by gel electrophoresis. PCR products that meet the amplification standard are purified and quantified for fragmentation.
- PCR products are fragmented with DNase I for optimal DNA chip hybridization. Following fragmentation, DNA fragments should be less than 250 base pairs, and on average, about 180 base pairs, as confirmed by gel electrophoresis. Samples that meet the fragmentation standard are then labeled with a biotin compound using terminal deoxynucleotidyl transferase. The labeled fragments are next denatured and then hybridized into a GeneChip 250K array.
- the array is stained prior to scanning in a three step process consisting of a streptavidin phycoerythin (SAPE) stain, followed by an antibody amplification step with a biotinylated, anti-streptavidin antibody (goat), and final stain with streptavidin phycoerythin (SAPE).
- SAPE streptavidin phycoerythin
- the array is covered with an array holding buffer and then scanned with a scanner such as the Affymetrix GeneChip Scanner 3000.
- 500K Array Set is performed according to the manufacturer's guidelines, as shown in FIG. 3. Briefly, acquisition of raw data using GeneChip Operating Software (GCOS) occurs. Data may also be aquired using Affymetrix GeneChip Command ConsoleTM. The aquisition of raw data is followed by analysis with GeneChip Genotyping Analysis Software (GTYPE). For purposes of the present invention, samples with a GTYPE call rate of less than 80% are excluded. Samples are then examined with BRLMM and/or SNiPer algorithm analyses. Samples with a BRLMM call rate of less than 95% or a SNiPer call rate of less than 98% are excluded. Finally, an association analysis is performed, and samples with a SNiPer quality index of less than 0.45 and/or a Hardy- Weinberg p-value of less than 0.00001 are excluded.
- GTYPE GeneChip Genotyping Analysis Software
- DNA sequencing may also be used to sequence a substantial portion, or the entire, genomic sequence of an individual. Tra t ona y, common DNA sequenc ng as een ased on po yacry amide gel fractionation to resolve a population of chain-terminated fragments ⁇ Sanger et al., Proc. Natl. Acad. Sci. USA 74:5463-5467 (1977)). Alternative methods have been and continue to be developed to increase the speed and ease of DNA sequencing.
- high throughput and single molecule sequencing platforms are commercially available or under development from 454 Life Sciences (Branford, CT) (Margulies et al., Nature (2005) 437:376-380 (2005)); Solexa (Hayward, CA); Helicos BioSciences Corporation (Cambridge, MA) (U.S. application Ser. No. 11/167046, filed June 23, 2005), and Li-Cor Biosciences (Lincoln, NE) (U.S. application Ser. No. 11/118031, filed April 29, 2005).
- the profile is stored digitally in step 108, such profile may be stored digitally in a secure manner.
- the genomic profile is encoded in a computer readable format to be stored as part of a data set and may be stored as a database, where the genomic profile may be "banked", and can be accessed again later.
- the data set comprises a plurality of data points, wherein each data point relates to an individual. Each data point may have a plurality of data elements.
- One data element is the unique identifier, used to identify the individual's genomic profile. It may be a bar code.
- Another data element is genotype information, such as the SNPs or nucleotide sequence of the individual's genome.
- Data elements corresponding to the genotype information may also be included in the data point.
- the genotype information includes SNPs identified by microarray analysis
- other data elements may include the microarray SNP identification number, the SNP rs number, and the polymorphic nucleotide.
- Other data elements may be chromosome position of the genotype information, quality metrics of the data, raw data files, images of the data, and extracted intensity scores.
- the individual's specific factors such as physical data, medical data, ethnicity, ancestry, geography, gender, age, family history, known phenotypes, demographic data, exposure data, lifestyle data, behavior data, and other known phenotypes may also be incorporated as data elements.
- factors may include, but are not limited to, individual's: birthplace, parents and/or grandparents, relatives' ancestry, location of residence, ancestors' location of residence, environmental conditions, known health conditions, known drug interactions, family health conditions, lifestyle conditions, diet, exercise habits, marital status, and physical measurements, such as weight, height, cholesterol level, heart rate, blood pressure, glucose level and other measurements known in the art
- factors for an individual's relatives or ancestors, such as parents and grandparents may also be incorporated as data elements and used to determine an individual's risk for a phenotype or condition. .
- Information from the "banked" profile can then be accessed and utilized as desired. For example, in the initial assessment of an individual's genotype correlations, the individual's entire information (typically SNPs or other genomic sequences across, or taken from an entire genome) will be analyzed for genotype correlations, hi subsequent analyses, either the entire information can be accessed, or a portion thereof, from the stored, or banked genomic profile, as desired or appropriate.
- SNPs or other genomic sequences across, or taken from an entire genome will be analyzed for genotype correlations, hi subsequent analyses, either the entire information can be accessed, or a portion thereof, from the stored, or banked genomic profile, as desired or appropriate.
- genotype correlations are obtained from scientific literature. Genotype correlations for genetic variations are determined from analysis of a population of individuals who have been tested for the presence or absence of one or more phenotypic traits of interest and for genotype profile. The alleles of each genetic variation or polymorphism in the profile are then reviewed to determine whether the presence or absence of a particular allele is associated with a trait of interest. Correlation can be performed by standard statistical methods and statistically significant correlations between genetic variations and phenotypic characteristics are noted. For example, it may be determined that the presence of allele Al at polymorphism A correlates with heart disease.
- FIGS. 4, 5, and 6 are examples of correlations between genotypes and phenotypes from which rules to be applied to genomic profiles may be based.
- each row corresponds to a phenotype/locus/ethnicity, wherein FIGS. 4C through I contains further information about the correlations for each of these rows.
- the "Short Phenotype Name" of BC as noted in FIG. 4M, an index for the names of the short phenotypes, is an abbreviation for breast cancer.
- BC 4 which is the generic name for the locus, the gene LSPl is correlated to breast cancer.
- the published or functional SNP identified with this correlation is rs3817198, as shown in FIG. 4C, with the published risk allele being C, the nonrisk allele being T.
- the published SNP and alleles are identified through publications such as seminal publications as in FIGS. 4E-G. In the example of LSPl in FIG. 4E, the seminal publication is Easton et al., Nature 447:713-720 (2007).
- FIGS. 22 and 25 further list correlations.
- the correlations in FIGS. 22 and 25 may be used to calculate an in ivi ua s ⁇ S or a con i ion or p eno ype, or examp e, or ca culating a ut ⁇ i or u us score.
- the GCI or GCI Plus score may also incorporate information such as a condition's prevalence, for example in FIG. 23.
- the correlations may be generated from the stored genomic profiles.
- individuals with stored genomic profiles may also have known phenotype information stored as well. Analysis of the stored genomic profiles and known phenotypes may generate a genotype correlation.
- 250 individuals with stored genomic profiles also have stored information that they have previously been diagnosed with diabetes. Analysis of their genomic profiles is performed and compared to a control group of individuals without diabetes. It is then determined that the individuals previously diagnosed with diabetes have a higher rate of having a particular genetic variant compared to the control group, and a genotype correlation may be made between that particular genetic variant and diabetes.
- rules are made based on the validated correlations of genetic variants to particular phenotypes.
- Rules may be generated based on the genotypes and phenotypes correlated as listed in Table 1 , for example. Rules based on correlations may incorporate other factors such as gender (e.g. FIG. 4) or ethnicity (FIGS. 4 and 5), to generate effects estimates, such as those in FIGS. 4 and 5. Other measures resulting from rules may be estimated relative risk increase such as in FIG. 6. The effects estimates and estimated relative risk increase may be from the published literature, or calculated from the published literature. Alternatively, the rules may be based on correlations generated from stored genomic profiles and previously known phenotypes. In some embodiments, the rules are based on correlations in FIGS. 22 and 25.
- the genetic variants will be SNPs. While SNPs occur at a single site, individuals who carry a particular SNP allele at one site often predictably carry specific SNP alleles at other sites. A correlation of SNPs and an allele predisposing an individual to disease or condition occurs through linkage disequilibrium, in which the non- random association of alleles at two or more loci occur more or less frequently in a population than would be expected from random formation through recombination.
- nucleotide repeats or insertions may also be in linkage disequilibrium with genetic markers that have been shown to be associated with specific phenotypes.
- a nucleotide insertion is correlated with a phenotype and a SNP is in linkage disequilibrium with the nucleotide insertion.
- a rule is made based on the correlation between the SNP and the phenotype.
- a rule based on the correlation between the nucleotide insertion and the phenotype may also be made.
- Either rules or both rules may be app ie to a genom c pro i e, as t e presence o one may g ve a certain risk factor, the ot er may give another risk factor, and when combined may increase the risk.
- a disease predisposing allele cosegregates with a particular allele of a SNP or a combination of particular alleles of SNPs.
- a particular combination of SNP alleles along a chromosome is termed a haplotype, and the DNA region in which they occur in combination can be referred to as a haplotype block.
- a haplotype block can consist of one SNP, typically a haplotype block represents a contiguous series of 2 or more SNPs exhibiting low haplotype diversity across individuals and with generally low recombination frequencies.
- An identification of a haplotype can be made by identification of one or more SNPs that lie in a haplotype block.
- a SNP profile typically can be used to identify haplotype blocks without necessarily requiring identification of all SNPs in a given haplotype block.
- Genotype correlations between SNP haplotype patterns and diseases, conditions or physical states are increasingly becoming known.
- the haplotype patterns of a group of people known to have the disease are compared to a group of people without the disease.
- frequencies of polymorphisms in a population can be determined, and in turn these frequencies or genotypes can be associated with a particular phenotype, such as a disease or a condition.
- SNP-disease correlations include polymorphisms in Complement Factor H in age-related macular degeneration (Klein et al, Science: 308:385-389, (2005)) and a variant near the INSIG2 gene associated with obesity ⁇ Herbert et al, Science: 312:279-283 (2006)).
- SNP correlations include polymorphisms in the 9p21 region that includes CDKN2A and B, such as ) such as rsl 0757274, rs2383206, rsl3333040, rs2383207, and rslOl 16277 correlated to myocardial infarction (Helgadottir et al, Science 316:1491-1493 (2007); McPherson et al, Science 316:1488-1491 (2007))
- the SNPs may be functional or non- functional.
- a functional SNP has an effect on a cellular function, thereby resulting in a phenotype, whereas a non-functional SNP is silent in function, but may be in linkage disequilibrium with a functional SNP.
- the SNPs may also be synonymous or non-synonymous.
- SNPs that are synonymous are SNPs in which the different forms lead to the same polypeptide sequence, and are non-functional SNPs. If the SNPs lead to different polypetides, the SNP is non-synonymous and may or may not be functional.
- SNPs or other genetic markers, used to identify haplotypes in a diplotype, which is 2 or more haplotypes, may also be used to correlate phenotypes associated with a diplotype.
- n orma ion a ou an in ivi ua s ap o ypes, ip o ypes, an pro iles may be in the genomic profile of the individual.
- the genetic marker may have a r 2 or D' score, scores commonly used in the art to determine linkage disequilibrium, of greater than 0.5. In preferred embodiments, the score is greater than 0.6, 0.7, 0.8, 0.90, 0.95 or 0.99.
- the genetic marker used to correlate a phenotype to an individual's genomic profile may be the same as the functional or published SNP correlated to a phenotype, or different.
- test SNP and published SNP are the same, as are the test risk and nonrisk alleles are the same as the published risk and nonrisk alleles (FIGS. 4A and C).
- test SNP is different from its functional or published SNP, as are the test risk and nonrisk alleles to the published risk and nonrisk alleles.
- the test and published alleles are oriented relative to the plus strand of the genome, and from these columns, it can be inferred the homozygous risk or nonrisk genotype, which may generate a rule to be applied to the genomic profile of individuals such as subscribers.
- the test SNP may not yet be identified, but using the published SNP information, allelic differences or SNPs may be identified based on another assay, such as TaqMan.
- another assay such as TaqMan.
- the published SNP is rs 1061170 but a test SNP has not been identified.
- the test SNP may be identified by LD analysis with the published SNP.
- the test SNP may not be used, and instead, TaqMan or other comparable assay, will be used to assess an individual's genome having the test SNP.
- test SNPs may be "DIRECT" or "TAG” SNPs (FIGS. 4E-G, FIG. 5).
- SNPs are the test SNPs that are the same as the published or functional SNP, such as for BC 4. Direct SNPs may also be used for FGFR2 correlation with breast cancer, using the SNP rs 1073640 in Europeans and Asians, where the minor allele is A and the other allele is G (Easton et al, Nature 447:1087-1093 (2007)). Another published or functional SNP for FGFR2 correlation to breast cancer is rsl219648, also in Europeans and Asians ⁇ Hunter et al., Nat. Genet. 39:870-874 (2007)). Tag SNPs are where the test SNP is different from that of the functional or published SNP, as in for BCJ.
- SNPs may also be used for other genetic variants such as SNPs for CAMTAl (rs4908449), 9p21 (rsl0757274, rs2383206, rsl3333040, rs2383207, rs 10116277), COLlAl (rsl800012), FVL (rs6025), HLA-DQAl (rs4988889, rs2588331), eNOS (rsl799983), MTHFR (rsl801133), and APC (rs28933380).
- a a ases o s are pu ic y avai a e om, or example, the Internationa
- HapMap Project see www.hapmap.org, The International HapMap Consortium, Nature 426:789-796 (2003), and The International HapMap Consortium, Nature 437:1299-1320 (2005)
- HGMD Human Gene Mutation Database
- dbSNP Single Nucleotide Polymorphism database
- These databases provide SNP haplotypes, or enable the determination of SNP haplotype patterns. Accordingly, these SNP databases enable examination of the genetic risk factors underlying a wide range of diseases and conditions, such as cancer, inflammatory diseases, cardiovascular diseases, neurodegenerative diseases, and infectious diseases.
- the diseases or conditions may be actionable, in which treatments and therapies currently exist. Treatments may include prophylactic treatments as well as treatments that ameliorate symptoms and conditions, including lifestyle changes.
- Physical traits may include height, hair color, eye color, body, or traits such as stamina, endurance, and agility.
- Mental traits may include intelligence, memory performance, or learning performance.
- Ethnicity and ancestry may include identification of ancestors or ethnicity, or where an individual's ancestors originated from.
- the age may be a determination of an individual's real age, or the age in which an individual's genetics places them in relation to the general population. For example, an individual's real age is 38 years of age, however their genetics may determine their memory capacity or physical well-being may be of the average 28 year old. Another age trait may be a projected longevity for an individual.
- phenotypes may also include non-medical conditions, such as "fun" phenotypes. These phenotypes may include comparisons to well known individuals, such as foreign dignitaries, politicians, celebrities, inventors, athletes, musicians, artists, business people, and infamous individuals, such as convicts. Other "fun" phenotypes may include comparisons to other organisms, such as bacteria, insects, plants, or non-human animals. For example, an individual maybe interested to see how their genomic profile compares to that of their pet dog, or to a former president.
- the rules are applied to the stored genomic profile to generate a phenotype profile of step 116.
- information in FIGS. 4, 5, or 6 may form the basis of rules, or tests, to apply to an individual's genomic profile.
- the rules may encompass the information on test SNP and alleles, and the effect estimates of FIG. 4, where the UNITS for e ec es ima e is e uni s o e e ec es ima e, suc as , or o s-ra io co ence interval) or mean.
- the effects estimate may be a genotypic risk (FIGS.
- the effect estimate may be carrier risk, which is RR or RN vs NN.
- the effect estimate may be based on the allele, an allelic risk such as R vs. N.
- the test SNP frequency in the public HapMap is also noted in FIGS. 4H and I.
- information from FIGS. 21, 22, 23, and/or 25 may be used to generate information to apply to an individual's genomic profile.
- the information may be used to generate GCI or GCI Plus scores for an individual (for example, FIG. 19).
- the scores may be used to generate information on genetic risks, such as estimated lifetime risk, for one or more conditions in the phenotype profile of an individual (for example, FIG. 15).
- the methods allow calculating estimated lifetime risks or relative risks for one or more phenotypes or conditions as listed in FIGS. 22 or 25.
- the risk for a single condition may be based on one or more SNP.
- an estimated risk for a phenotype or condition may be based on at least 2, 3, 4, 5, 6, 7, 8, 9, 10, 11, or 12 SNPs, wherein the SNPs for estimating a risk may be published SNPs, test SNPs, or both (for example, FIG. 25).
- the estimated risk for a condition may be based on the SNPs as listed in FIG. 22 or 25. In some embodiments, the risk for a condition may be based on at least one SNP. For example, assessment of an individual's risk for Alzheimers (AD), colorectal cancer (CRC), osteoarthritis (OA) or exfoliation glaucoma (XFG), may be based on 1 SNP (for example, rs4420638 for AD, rs6983267 for CRC, rs4911178 for OA and rs2165241 for XFG).
- AD Alzheimers
- CRC colorectal cancer
- OA osteoarthritis
- XFG exfoliation glaucoma
- an individual's estimated risk maybe based on at least 1 or 2 SNPs (for example, rs9939609 and/or rs9291171 for BMIOB; DRBl*0301 DQA1*O5O1 and/or rs3087243 for GD; rsl800562 and/or rsl29128 for HEM).
- SNPs for example, rs9939609 and/or rs9291171 for BMIOB; DRBl*0301 DQA1*O5O1 and/or rs3087243 for GD; rsl800562 and/or rsl29128 for HEM.
- MI myocardial infarction
- MS multiple sclerosis
- PS psoriasis
- 1 , 2, or 3 SNPs may be used to assess an individual's risk for the condition (for example, rsl 866389, rsl333049, and/or rs6922269 for MI; rs6897932, rsl2722489, and/or DRBl *1501 for MS; rs6859018, rsl 1209026, and/or HLAC*0602 for PS).
- RLS restless legs syndrome
- CeID celiac disease
- 1, 2, 3, or 4 SNPs for example, rs6904723, rs2300478, rslO26732, and/or rs9296249 for RLS; rs6840978, rsl 1571315, rs2187668, and/or DQAl *0301 DQBl*0302 for CeID).
- 1, 2, 3, 4, 5, or 6 SNPs may be used (for example, rsl0737680, rsl0490924, rs541862, rs2230199, rslO ⁇ l 170, and/or rs9332739 for AMD; rs6679677, rsl 1203367, rs6457617, DRB*0101, DRB 1*0401, and/or DRBl *0404 for RA).
- 1, 2, 3, 4, 5, 6 or 7 SNPs may be used (for example, rs3803662, rs2981582, rs4700485, rs3817198, rsl7468277, rs6721996, and/or rs3803662).
- SNPs may be used (for example, rs2066845, rs5743293, rsl 0883365, rsl 7234657, rsl0210302, rs9858542, rsl 1805303, rsl000113, rsl7221417, rs2542151, and/or rsl 0761659 for CD; rsl3266634, rs4506565, rsl0012946, rs7756992, rslO811661, rsl2288738, rs8050136, rsl l l l875, rs4402960, rs5215, and/or rsl 801282 for T2D).
- the SNPs used as a basis for determining risk may be in linkage
- the phenotype profile of an individual may comprise a number of phenotypes.
- the assessment of a patient's risk of disease or other conditions such as likely drug response including metabolism, efficacy and/or safety, by the methods of the present invention allows for prognostic or diagnostic analysis of susceptibility to multiple, unrelated diseases and conditions, whether in symptomatic, presymptomatic or asymptomatic individuals, including carriers of one or more disease/condition predisposing alleles.
- these methods provide for general assessment of an individual's susceptibility to disease or condition without any preconceived notion of testing for a specific disease or condition.
- the methods of the present invention allow for assessment of an individual's susceptibility to any of the several conditions listed in Tables 1, FIG. 4, 5, or 6, based on the individual's genomic profile.
- the methods allow assessments of an individual's estimated lifetime risk or relative risk for one or more phenotype or condition, such as those in FIGS. 22 or 25.
- the assessment preferably provides information for 2 or more of these conditions, and more preferably, 3, 4, 5, 10, 20, 50, 100 or even more of these conditions.
- the phenotype profile results from the application of at least 20 rules to the genomic profile of an individual.
- at least 50 rules are applied to the genomic profile of an individual.
- a single rule for a phenotype may be applied for monogenic phenotypes. More than one rule may also be applied for a single phenotype, such as a multigenic p eno ype or a monogenic p eno ype w erein mu ip e gene ic varian s wi in a sing e gene affects the probability of having the phenotype.
- step 110 may be performed periodically, for example, daily, weekly, or monthly by one or more people of ordinary skill in the field of genetics, who scan scientific literature for new genotype correlations.
- the new genotype correlations may then be further validated by a committee of one or more experts in the field.
- Step 112 may then also be periodically updated with new rules based on the new validated correlations.
- the new rule may encompass a genotype or phenotype without an existing rule.
- a genotype not correlated with any phenotype is discovered to correlate with a new or existing phenotype.
- a new rule may also be for a correlation between a phenotype for which no genotype has previously been correlated to.
- New rules may also be determined for genotypes and phenotypes that have existing rules. For example, a rule based on the correlation between genotype A and phenotype A exists. New research reveals genotype B correlates with phenotype A, and a new rule based on this correlation is made. Another example is phenotype B is discovered to be associated with genotype A, and thus a new rule may be made.
- Rules may also be made on discoveries based on known correlations but not initially identified in published scientific literature. For example, it may be reported genotype C is correlated with phenotype C. Another publication reports genotype D is correlated with phenotype D. Phenotype C and D are related symptoms, for example phenotype C may be shortness of breath, and phenotype D is small lung capacity.
- a correlation between genotype C and phenotype D, or genotype D with phenotype C may be discovered and validated through statistical means with existing stored genomic profiles of individuals with genotypes C and D, and phenotypes C and D, or by further research. A new rule may then be generated based on the newly discovered and validated correlation.
- stored genomic profiles of a number of individuals with a specific or related phenotype may be studied to determine a genotype common to the individuals, and a correlation may be determined. A new rule may be generated based on this correlation.
- Rules may also be made to modify existing rules. For example, correlations between genotypes and phenotypes may be partly determined by a known individual characteristic, such as ethnicity, ancestry, geography, gender, age, family history, or any other nown p eno ypes o e in ivi ua . u es ase on ese nown in ividual characteristics may be made and incorporated into an existing rule, to provide a modified rule. The choice of modified rule to be applied will be dependent on the specific individual factor of an individual. For example, a rule may be based on the probability an individual who has phenotype E is 35% when the individual has genotype E.
- the probability is 5%.
- a new rule may be generated based on this result and applied to individuals with that particular ethnicity.
- the existing rule with a determination of 35% may be applied, and then another rule based on ethnicity for that phenotype is applied.
- the rules based on known individual characteristics may be determined from scientific literature or determined based on studies of stored genomic profiles. New rules may be added and applied to genomic profiles in step 114, as the new rules are developed, or they may be applied periodically, such as at least once a year.
- SNPs 3,000,000, or more SNPs, or whole genomic sequencing, more detailed SNP genomic profiles can be generated.
- cost-efficient analysis of finer SNP genomic profiles and updates to the master database of SNP -disease correlations will be enabled by advances in computational analytical methodology.
- a subscriber or their health care manager may access their genomic or phenotype profiles via an on-line portal or website as in step 118.
- Reports containing phenotype profiles and other information related to the phenotype and genomic profiles may also be provided to the subscriber or their health care manager, as in steps 120 and 122.
- the reports may be printed, saved on the subscriber's computer, or viewed on-line.
- a sample on-line report is shown in FIG. 7.
- the subscriber may choose to display a single phenotype, or more than one phenotype.
- the subscriber may also have different viewing options, for example, as shown in FIG. 7, a "Quick View" option.
- the phenotype may e a me ica con i ion an i eren rea men s an symp oms in e quick report may lin o other web pages that contain further information about the treatment. For example, by clicking on a drug, it will lead to website that contains information about dosages, costs, side effects, and effectiveness. It may also compare the drug to other treatments.
- the website may also contain a link leading to the drug manufacturer's website.
- Another link may provide an option for the subscriber to have a pharmacogenomic profile generated, which would include information such as their likely response to the drug based on their genomic profile.
- Links to alternatives to the drug may also be provided, such as preventative action such as fitness and weight loss, and links to diet supplements, diet plans, and to nearby health clubs, health clinics, health and wellness providers, day spas and the like may also be provided.
- Educational and informational videos, summaries of available treatments, possible remedies, and general recommendations may also be provided.
- the on-line report may also provide links to schedule in-person physician or genetic counseling appointments or to access an on-line genetic counselor or physician, providing the opportunity for a subscriber to ask for more information regarding their phenotype profile. Links to on-line genetic counseling and physician questions may also be provided on the on-line report.
- Reports may also be viewed in other formats such as a comprehensive view for a single phenotype, wherein more detail for each category is provided. For example, there may be more detailed statistics about the likelihood of the subscriber developing the phenotype, more information about the typical symptoms or phenotypes, such as sample symptoms for a medical condition, or the range of a physical non-medical condition such as height, or more information about the gene and genetic variant, such as the population incidence, for example in the world, or in different countries, or in different age ranges or genders.
- FIG. 15 shows a summary of estimated lifetime risks for a number of conditions. The individual may view more information for a specific condition, such as prostate cancer (FIG. 16) or Crohn's disease (FIG. 17).
- the report may be of a "fun" phenotype, such as the similarity of an individual's genomic profile to that of a famous individual, such as Albert Einstein.
- the report may display a percentage similarity between the individual's genomic profile to that of Einstein's, and may further display a predicted IQ of Einstein and that of the individual's. Further information may include how the genomic profile of the general population and their IQ compares to that of the individual's and Einstein's.
- t e report may sp ay a p enotypes that have been correlated to the subscriber's genomic profile.
- the report may display only the phenotypes that are positively correlated with an individual's genomic profile.
- the individual may choose to display certain subgroups of phenotypes, such as only medical phenotypes, or only actionable medical phenotypes.
- actionable phenotypes and their correlated genotypes may include Crohn's disease (correlated with IL23R and CARD 15), Type 1 diabetes (correlated with HLA-DR/DQ), lupus (correlated HLA-DRBl), psoriasis (HLA-C), multiple sclerosis (HLA-DQAl), Graves disease (HLA-DRBl), rheumatoid arthritis (HLA-DRBl), Type 2 diabetes (TCF7L2), breast cancer (BRCA2), colon cancer (APC), episodic memory (KIBRA), and osteoporosis (COLl Al).
- Crohn's disease correlated with IL23R and CARD 15
- Type 1 diabetes correlated with HLA-DR/DQ
- lupus correlated HLA-DRBl
- psoriasis HLA-C
- multiple sclerosis HLA-DQAl
- Graves disease HLA-DRBl
- rheumatoid arthritis HLA-DR
- the individual may also choose to display subcategories of phenotypes in their report, such as only inflammatory diseases for medical conditions, or only physical traits for non-medical conditions.
- the individual may choose to show all conditions an estimated risk was calculated for the individual by highlighting those conditions (for example, FIG. 15A, D), highlighting only conditions with an elevated risk (FIG. 15B), or only conditions with a reduced risk (FIG. 15C).
- Information submitted by and conveyed to an individual may be secure and confidential, and access to such information may be controlled by the individual.
- Information derived from the complex genomic profile may be supplied to the individual as regulatory agency approved, understandable, medically relevant and/or high impact data. Information may also be of general interest, and not medically relevant.
- Information can be securely conveyed to the individual by several means including, but not restricted to, a portal interface and/or mailing. More preferably, information is securely (if so elected by the individual) provided to the individual by a portal interface, to which the individual has secure and confidential access.
- Such an interface is preferably provided by on-line, internet website access, or in the alternative, telephone or other means that allow private, secure, and readily available access.
- the genomic profiles, phenotype profiles, and reports are provided to an individual or their health care manager by transmission of the data over a network.
- FIG. 8 is a block diagram showing a representative example logic device through which a phenotype profile and report may be generated.
- FIG. 8 shows a computer system (or digital device) 800 to receive and store genomic profiles, analyze genotype correlations, generate rules based on the analysis of genotype correlations, apply the rules to the genomic profiles, and produce a phenotype profile and report.
- the computer system 800 may be understood as a logical apparatus that can read instructions from media 811 and/or network port 805, which can optionally be connected to server 809 having fixed media 812. The system s own in .
- the communication medium can include any means of transmitting and/or receiving data.
- the communication medium can be a network connection, a wireless connection or an internet connection. Such a connection can provide for communication over the World Wide Web. It is envisioned that data relating to the present invention can be transmitted over such networks or connections for reception and/or review by a party 822.
- a computer-readable medium includes a medium suitable for transmission of a result of an analysis of a biological sample or a genotype correlation.
- the medium can include a result regarding a phenotype profile of an individual subject, wherein such a result is derived using the methods described herein.
- a personal portal will preferably serve as the primary interface with an individual for receiving and evaluating genomic data.
- a portal will enable individuals to track the progress of their sample from collection through testing and results. Through portal access, individuals are introduced to relative risks for common genetic disorders based on their genomic profile. The subscriber may choose which rules to apply to their genomic profile through the portal.
- one or more web pages will have a list of phenotypes and next to each phenotype a box in which a subscriber may select to include in their phenotype profile.
- the phenotypes may be linked to information on the phenotype, to help the subscriber make an informed choice about the phenotype they want included in their phenotype profile.
- the webpage may also have phenotypes organized by disease groups, for example as actionable diseases or not. For example, a subscriber may choose actionable phenotypes only, such as HLA-DQAl and celiac disease. The subscriber may also choose to display pre or post symptomatic treatments for the phenotypes.
- the individual may choose actionable phenotypes with pre- symptomatic treatments (outside of increased screening), for celiac disease, a pre-symptomatic treatment of gluten free diet.
- pre-symptomatic treatments for celiac disease
- a pre-symptomatic treatment of gluten free diet may be Alzheimer's, the pre- symptomatic treatment of statins, exercise, vitamins, and mental activity.
- Thrombosis is another example, with a pre-symptomatic treatment of avoid oral contraceptives and avoid sitting still for long periods of time.
- An example of a phenotype with an approved post symptomatic treatment is wet AMD, correlated with CFH, wherein individuals may obtain laser treatment for their condition.
- T e p enotypes may a so e organize y type or c ass of disease or conditions, for example neurological, cardiovascular, endocrine, immunological, and so forth. Phenotypes may also be grouped as medical and non-medical phenotypes. Other groupings of phenotypes on the webpage may be by physical traits, physiological traits, mental traits, or emotional traits. The webpage may further provide a section in which a group of phenotypes are chosen by selection of one box.
- "Fun" phenotypes may include comparisons to celebrities or other famous individuals, or to other animals or even other organisms.
- a list of genomic profiles available for comparison may also be provided on the webpage for selection by the subscriber to compare to the subscriber's genomic profile.
- the on-line portal may also provide a search engine, to help the subscriber navigate the portal, search for a specific phenotype, or search for specific terms or information revealed by their phenotype profile or report.
- Links to access partner services and product offerings may also be provided by the portal. Additional links to support groups, message boards, and chat rooms for individuals with a common or similar phenotype may also be provided.
- the on-line portal may also provide links to other sites with more information on the phenotypes in a subscriber's phenotype profile.
- the on-line portal may also provide a service to allow subscribers to share their phenotype profile and reports with friends, families, or health care managers. Subscribers may choose which phenotypes to show in the phenotype profile they want shared with their friends, families, or health care managers.
- the phenotype profiles and reports provide a personalized genotype correlation to an individual.
- the genotype correlations provided to an individual can be used in determining personal health care and lifestyle choices. If a strong correlation is found between a genetic variant and a disease for which treatment is available, detection of the genetic variant may assist in deciding to begin treatment of the disease and/or monitoring of the individual. In the case where a statistically significant correlation exists but is not regarded as a strong correlation, an individual can review the information with a personal physician and decide an appropriate, beneficial course of action. Potential courses of action that could be beneficial to an individual in view of a particular genotype correlation include administration of therapeutic treatment, monitoring for potential need of treatment or effects of treatment, or making life- style changes in diet, exercise, and other personal habits/activities.
- an actionable phenotype such as celiac disease may have a pre-symptomatic treatment of a gluten-free diet.
- genotype correlation information could be applied through pharmacogenomics to predict the likely response an n v ua wou ave to treatment wit a particu ar rug or regimen ot drugs, suc as the likely efficacy or safety of a particular drug treatment.
- Subscribers may choose to provide the genomic and phenotype profiles to their health care managers, such as a physician or genetic counselor.
- the genomic and phenotype profiles may be directly accessed by the healthcare manager, by the subscriber printing out a copy to be given to the healthcare manager, or have it directly sent to the healthcare manager through the on-line portal, such as through a link on the on-line report.
- Medical information may include prevention and wellness information.
- the information provided to the individual patient by the present invention will enable patients to make informed choices for their health care. In this manner, patients will be able to make choices that may help them avoid and/or delay diseases that their individual genomic profile (inherited DNA) makes more likely.
- patients will be able to employ a treatment regime that personally fits their specific medical needs. Individuals also will have the ability to access their genotype data should they develop an illness and need this information to help their physician form a therapeutic strategy.
- Genotype correlation information could also be used in cooperation with genetic counseling to advise couples considering reproduction, and potential genetic concerns to the mother, father and/or child.
- Genetic counselors may provide information and support to subscribers with phenotype profiles that display an increased risk for specific conditions or diseases. They may interpret information about the disorder, analyze inheritance patterns and risks of recurrence, and review available options with the subscriber. Genetic counselors may also provide supportive counseling refer subscribers to community or state support services. Genetic counseling may be included with specific subscription plans. In some embodiments, genetic counseling maybe scheduled within 24 hours of request and available during of hours such as evenings, Saturdays, Sundays, and/or holidays.
- An individual's portal will also facilitate delivery of additional information beyond an initial screening. Individuals will be informed about new scientific discoveries that relate to their personal genetic profile, such as information on new treatments or prevention strategies for their current or potential conditions. The new discoveries may also be delivered to their healthcare managers.
- the subscribers, or their healthcare provi ers are in orme o new genotype corre a ions an new researc about the phenotypes in the subscriber's phenotype profiles, by e-mail.
- e-mails of "fun" phenotypes are sent to subscribers, for example, an e-mail may inform them that their genomic profile is 77% identical to that of Abraham Lincoln and that further information is available via an on-line portal.
- the present invention also provides a system of computer code for generating new rules, modifying rules, combining rules, periodically updating the rule set with new rules, maintaining a database of genomic profile securely, applying the rules to the genomic profiles to determine phenotype profiles, and for generating reports.
- Computer code for notifying subscribers of new or revised correlations new or revised rules, and new or revised reports, for example with new prevention and wellness information, information about new therapies in development, or new treatments available.
- the present invention provides a business method of assessing an individual's genotype correlations based on comparison of the patient's genome profile against a clinically- derived database of established, medically relevant nucleotide variants.
- the present invention further provides a business method for using the stored genomic profile of the individual for assessing new correlations that were not initially known, to generate updated phenotype profiles for an individual, without the requirement of the individual submitting another biological sample.
- a flow chart illustrating the business method is in FIG. 9.
- a revenue stream for the subject business method is generated in part at step 101, when an individual initially requests and purchases a personalized genomic profile for genotype correlations for a multitude of common human diseases, conditions, and physical states.
- a request and purchase can be made through any number of sources, including but not limited to, an on-line web portal, an on-line health service, and an individual's personal physician or similar source of personal medical attention.
- the genomic profile may be provided free, and the revenue stream is generated at a later step, such as step 103.
- a subscriber, or customer makes a request for purchase of a phenotype profile.
- a customer is provided a collection kit for a biological sample used for genetic sample isolation at step 103.
- a o ec ion i is provi e y expe i e e iv ry, suc as courier service a provi es same-day or overnight delivery.
- a container for a sample is included in the collection kit.
- the kit may also include instructions for sending the sample to the sample processing facility, or laboratory, and instructions for accessing their genomic profile and phenotype profile, which may occur through an on-line portal.
- genomic DNA can be obtained from any of a number of types of biological samples.
- genomic DNA is isolated from saliva, using a commercially available collection kit such as that available from DNA Genotek.
- a commercially available collection kit such as that available from DNA Genotek.
- Use of saliva and such a kit allows for a non-invasive sample collection, as the customer conveniently provides a saliva sample in a container from a collection kit and then seals the container.
- a saliva sample can be stored and shipped at room temperature.
- a customer After depositing a biological sample into a collection or specimen container, a customer will deliver the sample to a laboratory for processing at step 105. Typically, the customer may use packaging materials provided in the collection kit to deliver/send the sample to a laboratory by expedited delivery, such as same-day or overnight courier service.
- the laboratory that processes the sample and generates the genomic profile may adhere to appropriate governmental agency guidelines and requirements.
- a processing laboratory may be regulated by one or more federal agencies such as the Food and Drug Administration (FDA) or the Centers for Medicare and Medicaid Services (CMS), and/or one or more state agencies.
- FDA Food and Drug Administration
- CMS Centers for Medicare and Medicaid Services
- a clinical laboratory may be accredited or approved under the Clinical Laboratory Improvement Amendments of 1988 (CLIA).
- a genomic SNP profile is generated.
- a high density array such as the commercially available platforms from Affymetrix or Illumina, is used for SNP identification and profile generation.
- a SNP profile may be generated using an Affymetrix GeneChip assay, as described above in more detail. As technology evolves, there may be other technology vendors who can generate high density SNP profiles.
- a genomic profile for a subscriber will be the genomic sequence of the subscriber.
- genomic profile and related information may be confidential, with access to this proprietary information and the genomic profile limited as directed by the individual and/or his or her personal physician. Others, such as family and the genetic counselor of the individual may also be permitted access by the subscriber.
- the database or vault may be located on-site with the processing laboratory.
- the database may be located at a separate location.
- the genomic profile data generated by the processing lab can be imported at step 111 to a separate facility that contains the database.
- the individual's genetic variations are then compared against a clinically-derived database of established, medically relevant genetic variants in step 115.
- the genotype correlations may not be medically relevant but still incorporated into the database of genotype correlations, for example, physical traits such as eye color, or "fun" phenotypes such as genomic profile similarity to a celebrity.
- the medically relevant SNPs may have been established through the scientific literature and related sources.
- the non-SNP genetic variants may also be established to be correlated with phenotypes.
- the correlation of SNPs to a given disease is established by comparing the haplotype patterns of a group of people known to have the disease to a group of people without the disease. By analyzing many individuals, frequencies of polymorphisms in a population can be determined, and in turn these genotype frequencies can be associated with a particular phenotype, such as a disease or a condition. Alternatively, the phenotype may be a non-medical condition.
- the relevant SNPs and non-SNP genetic variants may also be determined through analysis of the stored genomic profiles of individuals rather than determined by available published literature. Individuals with stored genomic profiles may disclose phenotypes that have previously been determined. Analysis of the genotypes and disclosed phenotypes of the individuals may be compared to those without the phenotypes to determine a correlation that may then be applied to other genomic profiles. Individuals that have their genomic profiles determined may fill out questionnaires about phenotypes that have previously been determined.
- Questionnaires may contain questions about medical and non-medical conditions, such as iseases previous y iagnose , ami y is ory o me ica con i ions, i estyle, physical trai s, mental traits, age, social life, environment and the like.
- an individual may have their genomic profile determined free of charge if they fill out a questionnaire.
- the questionnaires are to be filled out periodically by the individuals in order to have free access to their phenotype profile and reports.
- the individuals that fill out the questionnaires may be entitled to a subscription upgrade, such that they have more access than their previous subscription level, or they may purchase or renew a subscription at a reduced cost.
- All information deposited in the database of medically relevant genetic variants at step 121 is first approved by a research/clinical advisory board for scientific accuracy and importance, coupled with review and oversight by an appropriate governmental agency if warranted at step 119.
- a research/clinical advisory board for scientific accuracy and importance, coupled with review and oversight by an appropriate governmental agency if warranted at step 119.
- the FDA may provide oversight through approval of algorithms used for validation of genetic variant (typically SNP, transcript level, or mutation) correlative data.
- scientific literature and other relevant sources are monitored for additional genetic variant-disease or condition correlations, and following validation of their accuracy and importance, along with governmental agency review and approval, these additional genotype correlations are added to the master database at step 125.
- the database of approved, validated medically-relevant genetic variants, coupled with a genome-wide individual profile, will advantageously allow genetic risk-assessment to be performed for a large number of diseases or conditions.
- individual genotype correlations can be determined through comparison of the individual's nucleotide (genetic) variants or markers with a database of human nucleotide variants that have been correlated to a particular phenotype, such as a disease, condition, or physical state.
- a particular phenotype such as a disease, condition, or physical state.
- An individual will receive relative risk and/or predisposition data on a wide range of scientifically validated disease states (e.g., Alzheimer's, cardiovascular disease, blood clotting).
- disease states e.g., Alzheimer's, cardiovascular disease, blood clotting
- genotype correlations in Table 1 may be included.
- SNP disease correlations in the database may include, but are not limited to, those correlations shown in FIG. 4.
- Other correlations from FIGS. 5 and 6 may also be included.
- the subject business method therefore provides analysis of risk to a multitude of diseases and conditions without any preconceived notion of what those diseases and conditions might entail.
- n o er em o imen s, e geno ype corre a ions a are coupled to the genome wide individual profile are non-medically relevant phenotypes, such as "fun" phenotypes or physical traits such as hair color.
- a rule or rule set is applied to the genomic profile or SNP profile of an individual, as described above. Application of the rules to a genomic profile generates a phenotype profile for the individual.
- the master database of human genotype correlations is expanded with additional genotype correlations as new correlations become discovered and validated.
- An update can be made by accessing pertinent information from the individual's genomic profile stored in a database as desired or appropriate. For example, a new genotype correlation that becomes known may be based on a particular gene variant. Determination of whether an individual may be susceptible to that new genotype correlation can then be made by retrieving and comparing just that gene portion of the individual's entire genomic profile.
- results of the genomic query preferably are analyzed and interpreted so as to be presented to the individual in an understandable format.
- the results of an initial screening are then provided to the patient in a secure, confidential form, either by mailing or through an on-line portal interface, as detailed above.
- the report may contain the phenotype profile as well as genomic information about the phenotypes in the phenotype profile, for example basic genetics about the genes involved or the statistics of the genetic variants in different populations.
- Other information based on the phenotype profile that may be included in the report are prevention strategies, wellness information, therapies, symptom awareness, early detection schemes, intervention schemes, and refined identification and sub-classification of the phenotypes. Following an initial screening of an individual's genomic profile, controlled, moderated updates are or can be made.
- Updates of an individual's genomic profile are made or are available in conjunction with updates to the master database as new genotype correlations emerge and are both validated and approved. New rules based on the new genotype correlations may be applied to the initial genomic profile to provide updated phenotype profiles.
- An updated genotype correlation profile can be generated by comparing the relevant portion of the individual's genomic profile to a new genotype correlation at step 127. For example, if a new genotype correlation is found based on variation in a particular gene, then that gene portion of the individual's genomic profile can be analyzed for the new genotype correlation.
- one or more new rules may be applied to generate an updated phenotype profile, rather than an en ire ru e se w ru es a a alrea y een app ie . e resu s o e individual's up a e genotype correlations are provided in a secure manner at step 129.
- Initial and updated phenotype profiles may be a service provided to subscribers or customers. Varying levels of subscriptions to genomic profile analysis and combinations thereof can be provided. Likewise, subscription levels can vary to provide individuals choices of the amount of service they wish to receive with their genotype correlations. Thus, the level of service provided would vary with the level of service subscription purchased by the individual.
- An entry level subscription for a subscriber may include a genomic profile and an initial phenotype profile. This may be a basic subscription level. Within the basic subscription level may be varying levels of service. For example, a particular subscription level could provide references for genetic counseling, physicians with particular expertise in treating or preventing a particular disease, and other service options. Genetic counseling may be obtained on-line or by telephone. In another embodiment, the price of the subscription may depend on the number of phenotypes an individual chooses for their phenotype profile. Another option may be whether the subscriber chooses to access on-line genetic counseling.
- a subscription could provide for an initial genome-wide, genotype correlation, with maintenance of the individual's genomic profile in a database; such database may be secure if so elected by the individual. Following this initial analysis, subsequent analyses and additional results could be made upon request and additional payment by the individual. This may be a premium level of subscription.
- updates of an individual's risks are performed and corresponding information made available to individuals on a subscription basis.
- the updates may be available to subscribers who purchase the premium level of subscription.
- Subscription to genotype correlation analysis can provide updates with a particular category or subset of new genotype correlations according to an individual's preferences. For example, an individual might only wish to learn of genotype correlations for which there is a known course of treatment or prevention. To aid an individual in deciding whether to have an additional analysis performed, the individual can be provided with information regarding additional genotype correlations that have become available. Such information can be conveniently mailed or e-mailed to a subscriber.
- ⁇ x may be provided within , ⁇ x , ig es eve may provi e a su scnoer to unnmiie ⁇ up a es and reports.
- the subscriber's profile may be updated as new correlations and rules are determined.
- subscribers may also permit access to unlimited number of individuals, such as family members and health care managers.
- the subscribers may also have unlimited access to on-line genetic counselors and physicians.
- the next level of subscription within the premium level may provide more limited aspects, for example a limited number of updates.
- the subscriber may have a limited number of updates for their genomic profile within a subscription period, for example, 4 times a year.
- the subscriber may have their stored genomic profile updated once a week, once a month, or once a year.
- the subscriber may only have a limited number of phenotypes they may choose to update their genomic profile against.
- a personal portal will also conveniently allow an individual to maintain a subscription to risk or correlation updates and information updates or alternatively, make requests for updated risk assessment and information.
- varying subscription levels could be provided to allow individuals choices of various levels of genotype correlation results and updates and may different subscription levels may be chosen by the subscriber via their personal portal.
- Any of these subscription options will contribute to the revenue stream for the subject business method.
- the revenue stream for the subject business method will also be added by the addition of new customers and subscribers, wherein the new genomic profiles are added to the database.
- Table 1 Representative genes having genetic variants correlated with a phenotype.
- Genetic markers and variants may include SNPs, nucleotide repeats, nucleotide insertions, nucleotide deletions, chromosomal translocations, chromosomal duplications, or copy number variations.
- Copy number variation may include microsatellite repeats, nucleotide repeats, centromeric repeats, or telomeric repeats.
- information about the association of multiple genetic markers with one or more diseases or conditions is combined and analyzed to produce a GCI score.
- the GCI score can be used to provide people not trained in genetics with a reliable (i.e., robust), understandable, and/or intuitive sense of what their individual risk of disease is compared to a relevant population based on current scientific research.
- a method for generating a robust GCI score for the combined effect of different loci is based on a reported individual risk for each locus studied. For example a disease or condition of interest is identified and then informational sources, including but not limited to databases, patent publications and scientific literature, are queried for information on the association of the disease of condition with one or more genetic loci.
- informational sources are curated and assessed using quality criteria. In some embodiments the assessment process involves multiple steps. In other embodiments the informational sources are assessed for multiple quality criteria.
- the information derived from informational sources is used to identify the odds ratio or relative risk for one or more genetic loci for each disease or condition of interest.
- the odds ratio (OR) or relative risk (RR) for at least one genetic loci is not available from available informational sources.
- the RR is then calculated using (1) reported OR of multiple alleles of same locus, (2) allele frequencies from data sets, such as the HapMap data set, and/or (3) disease/condition prevalence from available sources (e.g., CDC, National Center for Health Statistics, etc.) to derive RR of all alleles of interest.
- the ORs of multiple alleles of same locus are estimated separately or independently.
- the ORs of multiple alleles of same locus are combined to account for dependencies between the ORs of the different alleles.
- established disease models are used to generate an intermediate score that represents the risk of an individual according to the model chosen.
- ano er em o imen a me o is use a ana yzes multiple mo ⁇ eis tor a disease or condition of interest and which correlates the results obtained from these different models; this minimizes the possible errors that may be introduced by choice of a particular disease model.
- This method minimizes the influence of reasonable errors in the estimates of prevalence, allele frequencies and ORs obtained from informational sources on the calculation of the relative risk. Because of the "linearity" or monotonic nature of the effect of a prevalence estimate on the RR, there is little or no effect of incorrectly estimating the prevalence on the final rank score; provided that the same model is applied consistently to all individuals for which a report is generated.
- a method is used that takes into account environmental/behavioral/demographic data as additional "loci.”
- data may be obtained from informational sources, such as medical or scientific literature or databases (e.g., associations of smoking w/lung cancer, or from insurance industry health risk assessments).
- a GCI score is produced for one or more complex diseases. Complex diseases may be influenced by multiple genes, environmental factors, and their interactions. A large number of possible interactions needs to be analyzed when studying complex diseases, hi one embodiment a procedure is used to correct for multiple comparisons, such as the Bonferroni correction.
- the Simes's test is used to control the overall significance level (also known as the "familywise error rate") when the tests are independent or exhibit a special type of dependence (Sarkar S. (1998)). Some probability inequalities for ordered MTP2 random variables: a proof of the Simes conjecture. Ann Stat 26:494—504). Simes's test rejects the global null hypothesis that all AT test-specific null hypotheses are true ifp ⁇ ak/K for any k in 1,...JC. (Simes RJ (1986) An improved Bonferroni procedure for multiple tests of significance. Biometrika 73:751—754.).
- J R Stat Soc Ser B 57:289-300 step-up procedure that controls the false-discovery rate when testing a large number of possible gene x gene interactions in multilocus association studies.
- an individual is ranked in comparison to a population of individuals based on their intermediate score to produce a final rank score, which may be represented as rank in the population, such as the 99 th percentile or 99 th , 98 th , 97 th , 96 th , 95 th , 94 th , 93 rd , 92 nd , 91 st , 90 th , 89 th , 88 th , 87 th , 86 th , 85 th , 84 th , 83 rd , 82 nd , 81 st , 80 th , 79 th , 78 th , 77 th , 76 th , 75 th , 74 th , 73 rd , 72 nd , 71 st , 70 th , 69 th , 65 th , 60 th , 55 th , 45
- the rank may score may be displayed as a range, such as the 100 th to 95 th percentile, the 95 th to 85 th percentile, the 85 th to 60 th percentile, or any sub-range between the 100 th and 0 th percentile.
- the individual is ranked in quartiles, such as the top 75 th quartile, or the lowest 25 th quartile.
- the individual is ranked in comparison to the mean or median score of the population.
- the population to which the individual is compared to includes a large number of people from various geographic and ethnic backgrounds, such as a global population.
- the population to which an individual is compared to is limited to a particular geography, ancestry, ethnicity, sex, age (fetal, neonate, child, adolescent, teenager, adult, geriatric individual) disease state (such as symptomatic, asymptomatic, carrier, early- onset, late onset).
- the population to which the individual is compared is derived from information reported in public and/or private informational sources.
- an individual's GCI score, or GCI Plus score is visualized using a display.
- a screen such as a computer monitor or television screen
- the display is a static display such as a printed page.
- the display may include but is not limited to one or more of the following: bins (such as 1-5, 6-10, 11-15, 16-20, 21-25, 26-30, 31-35, 36-40, 41-45, 46-50, 51-55, 56-60, 61-65, 66-70, 71-75, 76-80, 81- 85, 86-90, 91-95, 96-100), a color or grayscale gradient, a thermometer, a gauge, a pie chart, a histogram or a bar graph.
- FIGS. 18 and 19 are different displays for MS and FIG. 20 is for Crohn's disease).
- a thermometer is used to display GCI score and disease/condition prevalence.
- thermometer displays a level that changes with the reported GCI score, for example, FIGS. 15-17, the color corresponds to the risk.
- the thermometer may display a colorimetric change as the GCI score increases (such as c anging om ue, or a ower score, progressive y to re , or a igher GCl score).
- a thermometer displays both a level that changes with the reported GCI score and a colorimetric change as the risk rank increases
- an individual's GCI score is delivered to an individual by using auditory feedback.
- the auditory feedback is a verbalized instruction that the risk rank is high or low.
- the auditory feedback is a recitation of a specific GCI score such as a number, a percentile, a range, a quartile or a comparison with the mean or median GCI score for a population.
- a live human delivers the auditory feedback in person or over a telecommunications device, such as a phone (landline, cellular phone or satellite phone) or via a personal portal.
- the auditory feedback is delivered by an automated system, such as a computer.
- the auditory feedback is delivered as part of an interactive voice response (IVR) system, which is a technology that allows a computer to detect voice and touch tones using a normal phone call.
- IVR interactive voice response
- an individual may interact with a central server via an IVR system.
- the IVR system may respond with pre-recorded or dynamically generated audio to interact with individuals and provide them with auditory feedback of their risk rank.
- an individual may call a number that is answered by an IVR system.
- the IVR system asks the subject to select options from a menu, such as a touch tone or voice menu. One of these options may provide an individual with his or her risk rank.
- an individual's GCI score is visualized using a display and delivered using auditory feedback, such as over a personal portal.
- auditory feedback such as over a personal portal.
- This combination may include a visual display of the GCI score and auditory feedback, which discusses the relevance of the GCI score to the individual's overall health and possible preventive measures, may be advised.
- e in ivi ua s score is compare o e ap ap is ri u ion ana me resulting score is the individual's rank in this population.
- the resolution of the reported score may be low due to the assumptions made during the process.
- the population will be partitioned into quantiles (3-6 bins), and the reported bin would be the one in which the individual's rank falls.
- the number of bins may be different for different diseases based on considerations such as the resolution of the score for each disease. In case of ties between the scores of different HapMap individuals, the average rank will be used.
- a higher GCI score is interpreted as an indication of an increased risk for acquiring or being diagnosed with a condition or disease.
- mathematical models are used to derive the GCI score.
- the GCI score is based on a mathematical model that accounts for the incomplete nature of the underlying information about the population and/or diseases or conditions, hi some embodiments the mathematical model includes certain at least one presumption as part of the basis for calculating the GCI score, wherein said presumption includes, but is not limited to: a presumption that the odds ratio values are given; a presumption that the prevalence of the condition is known; a presumption that the genotype frequencies in the population are known; and a presumption that the customers are from the same ancestry background as the populations used for the studies and as the HapMap; a presumption that the amalgamated risk is a product of the different risk factors of the individual genetic markers.
- the GCI may also include a presumption that the mutli-genotypic frequence of a genotype is the product of frequencies of the alleles of each of the SNPs or individual genetic markers (for example, the different SNPs or genetic markers are independent across the population).
- a GCI score is computed under the assumption that the risk attributed to the set of Genetic markers is the product of the risks attributed to the individual Genetic markers. This means that the different Genetic markers attribute independently of the other Genetic markers to the risk of the disease.
- SNP i we denote the three possible genotype values as rr ,nr , and n n .
- the genotype information of an individual can be described by a vector, (g ,...,gj , where g. can be 0,1, or 2, according to the number of risk alleles in position i.
- ⁇ 1 the relative risk of a heterozygous genotype in position i compared to a
- GCI(g ,...,g,) A [ ⁇ ⁇ g * .
- the relative risks for different Genetic markers are known and the multiplicative model can be used for risk assessment.
- the study design prevents the reporting of the relative risks.
- the relative risk cannot be calculated directly from the data without further assumptions. Instead of reporting the relative risks, it is customary to report the odds ratio (OR) of the genotype, which are the odds of carrying the disease given the risk genotype (either r Ir I. or
- OR2 ⁇ , (a - p) + b ⁇ + c ⁇ ' 2 2 a + b% + (c- p) ⁇ 2
- Equation system 1 is equivalent to the Zhang and Yu formula in Zhang J and Yu K. (What's the relative risk? A method of correcting the odds ratio in cohort studies of common outcomes. JAMA, 280: 1690-1 , 1998), which is incorporated by reference in its entirety.
- the effect of different parameters (prevalence, allele frequencies, and odds ratio errors) on the estimates of the relative risks is measured.
- the relative risk from a set of values of different odds ratios and different allele frequencies is computed (under HWE), and the results of these calculations is plotted for prevalence values ranging from 0 to 1.
- the resulting relative risks can be plotted as a function of the risk-allele frequencies.
- the Genetic Composite Index is calculated by using a reference set that represents the relevant population.
- This reference set may be one of the populations in the HapMap, or anther genotype dataset.
- the GCI is computed as follows. For each of the k risk loci, the relative risk is calculated from the odds ratio using the equation system 1. Then, the multiplicative score for each individual in the reference set is calculated.
- the GCI of an individual with a multiplicative score of s is the fraction of all individuals in the reference dataset with a score of s' ⁇ s. For instance, if 50% of the individuals in the reference set have a multiplicative score smaller than s, the final GCI score of the individual would be 0.5.
- the multiplicative model is used.
- other models that may be used for the purpose of determining the GCI score.
- Other suitable models include but are not limited to:
- Het Harvard Modified Score
- HapMap CEU population for 10 SNPs associated with T2D.
- the relevant SNPs were rs7754840, rs4506565, rs7756992, rslO811661, rsl2804210, rs8050136, rai l 11875, rs4402960, rs5215, rsl801282.
- an odds ratio for three possible genotypes is reported in the literature.
- the CEU population consists of thirty mother- father-child trios. Sixty parents from this population were used in order to avoid dependencies. One of the individuals that had a no-call in one of the 10 SNPs was excluded, resulting in a set of 59 individuals.
- the GCI rank for each of the individuals was then calculated using several different models. was o serve a or is a ase i eren mo e s pro ⁇ uce ⁇ mgniy corre a e results. Figures 12 & 13.
- the Spearman correlation was calculated between each pair of models (Table 2), which showed that the Multiplicative and Additive model had a correlation coefficient of 0.97, and thus the GCI score would be robust using either the additive or multiplicative models.
- the correlation between the Harvard modified scores and the multiplicative model was 0.83, and the correlation coefficient between the Harvard scores and the additive model was 0.7.
- using the maximum odds ratio as the genetic score yielded a dichotomous score which was defined by one SNP. Overall these results indicate score ranking provided a robust framework that minimized model dependency.
- Table 2 The Spearman correlations for the score distributions on the CEU data between model pairs.
- the model can be extended to the situations where an arbitrary number of possible variants occur.
- the present invention uses a robust scoring framework for the quantification of risk factors. While different genetic models may result in different scores, the results are usually correlated. Therefore the quantification of risk factors is generally not dependent on the model used.
- a method that estimates the relative risks from the odds ratios of multiple alleles in a case-control study is also provided in the present invention.
- the method takes into consideration the allele frequencies, the prevalence of the disease, and the dependencies between the relative risks of the different alleles. The performance of the approach on simulated case-control studies was measured, and found to be extremely accurate.
- N denote the risk and non-risk alleles of this particular SNP.
- D) denote the probability of getting affected by the disease given that a person is homozygous for the risk allele, heterozygous, or homozygous for the non-risk allele respectively.
- f * RR,fRN and fNN are used to denote the frequencies of the three genotypes in the population. Using these definitions, the relative risks are defined as
- ⁇ D) can be estimated, i.e., the frequency of RR among the cases and the controls, as well as P(R ⁇
- Bayes law can be used to get:
- the odds ratios are typically advantageous since there is usually no need to have an estimate of the allele frequencies in the population; in order to calculate the odds ratios typically what is needed is the genotype frequencies in the cases and in the controls.
- the genotype data itself is not available, but the summary data, such as the odds-ratios are available. This is the case when meta-analysis is being performed based on results from previous case-control studies. In this case, how to find the relative risks from the odds ratios is demonstrated. Using the fact that the following equation holds:
- Equation system 1 is equivalent to the Zhang and Yu formula; however, here the allele frequency in the population is taken into account. Furthermore, our method takes into account the fact that the two relative risks depend on each other, while previous methods suggest to compute each of the relative risks independently.
- the individual is provided a sample tube in the kit, such as that available from
- DNA Genotek into which the individual deposits a sample of saliva (approximately 4 mis) from which genomic DNA will be extracted.
- the saliva sample is sent to a CLIA certified laboratory for processing and analysis.
- the sample is typically sent to the facility by overnight mail in a shipping container that is conveniently provided to the individual in the collection kit.
- genomic DNA is isolated from saliva.
- DNA self collection kit technology available from DNA Genotek, an individual collects a specimen of about 4 ml saliva for clinical processing. After delivery of the sample to an appropriate laboratory for processing, DNA is isolated by heat denaturing and protease digesting the sample, typically using reagents supplied by the collection kit supplier at 50 0 C for at least one hour. The sample is next centrifuged, and the supernatant is ethanol precipitated. The DNA pellet is suspended in a buffer appropriate for subsequent analysis.
- the individual's genomic DNA is isolated from the saliva sample, according to well known procedures and/or those provided by the manufacturer of a collection kit. Generally, the sample is first heat denatured and protease digested. Next, the sample is centrifuged, and the supernatant is retained. The supernatant is then ethanol precipitated to yield a pellet containing approximately 5-16 ug of genomic DNA. The DNA pellet is suspended in 10 mM Tris pH 7.6, 1 mM EDTA (TE).
- TE 10 mM Tris pH 7.6, 1 mM EDTA
- a SNP profile is generated by hybridizing the genomic DNA to a commercially available high density SNP array, such as those available from Affymetrix or Illumina, using instrumentation and instructions provided by the array manufacturer. The individual's SNP profile is deposited into a secure database or vault.
- the patient's data structure is queried for risk-imparting SNPs by comparison to a clinically-derived database of established, medically relevant SNPs whose presence in a genome correlates to a given disease or condition.
- the database contains information of the statistical correlation of particular SNPs and SNP haplotypes to particular diseases or conditions. For example, as shown in Example III, polymorphisms in the apolipoprotein E gene give rise to differing isoforms of the protein, which in turn correlate with a statistical likelihood of developing Alzheimer's Disease. As another example, individuals possessing a variant of the blood clotting protein Factor V known as Factor V Leiden have an increased tendency to clot.
- a number of genes in which SNPs have been associated to a disease or condition phenotype are s own n a e . e n ormation in t e ata ase is approve y a research/clinical adv sory board for its scientific accuracy and importance, and may be reviewed with governmental agency oversight.
- the database is continually updated as more SNP-disease correlations emerge from the scientific community.
- a genomic profile is generated, genotype correlations are made, and the results are provided to the individual as described in Example I.
- subsequent, updated correlations are or can be determined as additional genotype correlations become known.
- the subscriber has a premium level subscription and their genotype profile and is maintained in a secure database. The updated correlations are performed on the stored genotype profile.
- I could have determined that a particular individual does not have ApoE4 and thus is not predisposed to early-onset Alzheimer's Disease, and that this individual does not have Factor V Leiden. Subsequent to this initial determination, a new correlation could become known and validated, such that polymorphisms in a given gene, hypothetically gene XYZ, are correlated to a given condition, hypothetically condition 321. This new genotype correlation is added to the master database of human genotype correlations. An update is then provided to the particular individual by first retrieving the relevant gene XYZ data from the particular individual's genomic profile stored in a secure database. The particular individual's relevant gene XYZ data is compared to the updated master database information for gene XYZ.
- the particular individual's susceptibility or genetic predisposition to condition 321 is determined from this comparison. The results of this determination are added to the particular individual's genotype correlations. The updated results of whether or not the particular individual is susceptible or genetica y pre ispose to con ition is provi e to t e particu ar individual, along with interpretative and supportive information.
- AD Alzheimer's disease
- APOE apolipoprotein E
- ApoE2 contains 112/158 cys/cys
- ApoE3 contains 112/158 cys/arg
- ApoE4 contains 112/158 arg/arg.
- Table 3 the risk of Alzeimer's disease onset at an earlier age increases with the number of APOE ⁇ 4 gene copies.
- Table 3 the relative risk of AD increases with number of APOE ⁇ 4 gene copies.
- the following information is exemplary of information that could be supplied to an individual having a genomic SNP profile that shows the presence of the gene for Factor V Leiden.
- the individual may have a basic subscription in which the information may be supplied in an initial report.
- Factor V Leiden is not a disease, it is the presence of a particular gene that is passed on from one's parents.
- Factor V Leiden is a variant of the protein Factor V (5) which is needed for blood clotting. People who have a Factor V deficiency are more likely to bleed badly while people with Factor V Leiden have blood that has an increased tendency to clot.
- the genes for the Factor V are passed on from one's parents. As with all inherited characteristics, one gene is inherited from the mother and one from the father. So, it is possible to inherit: -two normal genes or one Factor V Leiden gene and one normal gene -or two Factor V Leiden genes. Having one Factor V Leiden gene will result in a slightly higher risk of developing a thrombosis, but having two genes makes the risk much greater.
- Factor V Leiden only slightly increases the risk of getting a blood clot and many people with this condition will never experience thrombosis. There are many things one can do to avoid getting blood clots. Avoid standing or sitting in the same position for long periods of time. When traveling long distances, it is important to exercise regularly - the blood must not 'stand still'. Being overweight or smoking will greatly increase the risk of blood clots. Women carrying the Factor V Leiden gene should not take the contraceptive pill as this will significantly increase the chance of getting thrombosis. Women carrying the Factor V Leiden gene should also consult their doctor before becoming pregnant as this can also increase the risk of thrombosis.
- the gene for Factor V Leiden can be found in a blood sample.
- a blood clot in the leg or the arm can usually be detected by an ultrasound examination.
- Clots can also be detected by X-ray after injecting a substance into the blood to make the clot stand out.
- a blood clot in the lung is harder to find, but normally a doctor will use a radioactive substance to test the distribution of blood flow in the lung, and the distribution of air to the lungs. The two patterns should match - a mismatch indicates the presence of a clot.
Abstract
Description


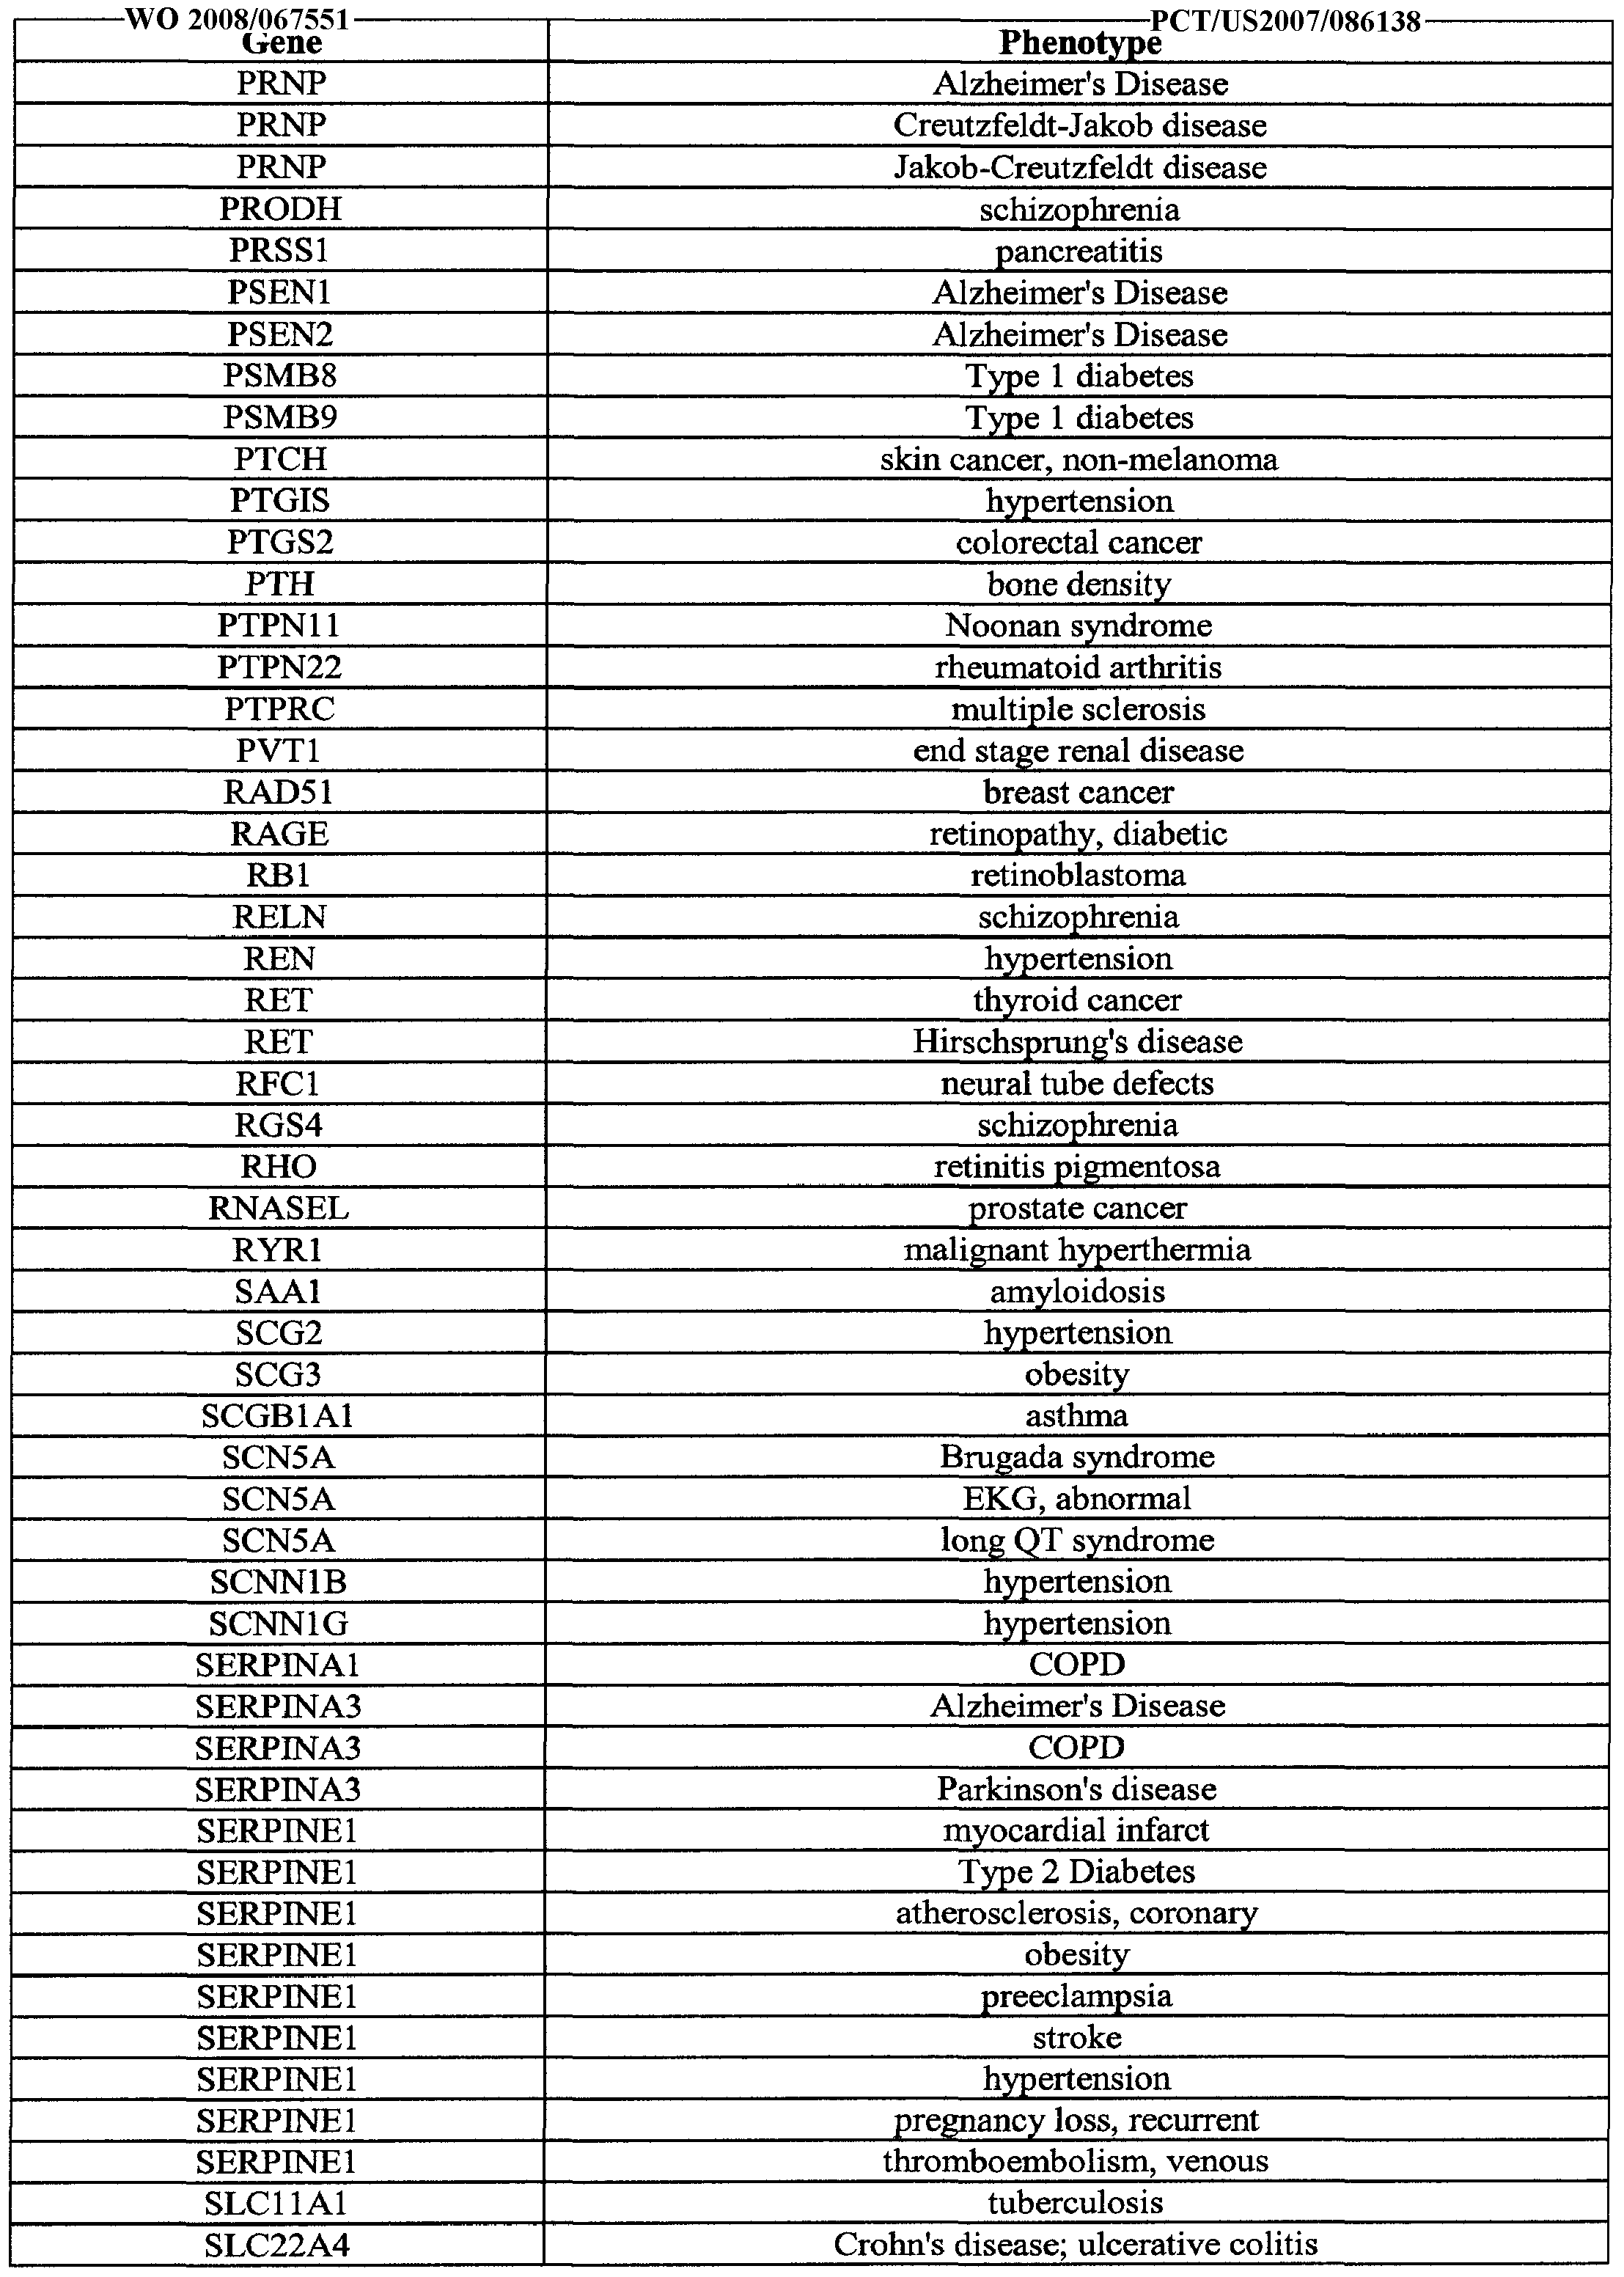


Claims
Priority Applications (8)
| Application Number | Priority Date | Filing Date | Title |
|---|---|---|---|
| KR1020097013756A KR20090105921A (en) | 2006-11-30 | 2007-11-30 | Genetic analysis systems and methods |
| JP2009539519A JP2010522537A (en) | 2006-11-30 | 2007-11-30 | Genetic analysis systems and methods |
| US12/516,915 US9092391B2 (en) | 2006-11-30 | 2007-11-30 | Genetic analysis systems and methods |
| CA002671267A CA2671267A1 (en) | 2006-11-30 | 2007-11-30 | Genetic analysis systems and methods |
| EP07854875A EP2102651A4 (en) | 2006-11-30 | 2007-11-30 | Genetic analysis systems and methods |
| CN2007800500195A CN101617227B (en) | 2006-11-30 | 2007-11-30 | Genetic analysis systems and methods |
| AU2007325021A AU2007325021B2 (en) | 2006-11-30 | 2007-11-30 | Genetic analysis systems and methods |
| HK10106416.1A HK1139737A1 (en) | 2006-11-30 | 2010-06-30 | Genetic analysis systems and methods |
Applications Claiming Priority (12)
| Application Number | Priority Date | Filing Date | Title |
|---|---|---|---|
| US86806606P | 2006-11-30 | 2006-11-30 | |
| US60/868,066 | 2006-11-30 | ||
| US95112307P | 2007-07-20 | 2007-07-20 | |
| US60/951,123 | 2007-07-20 | ||
| US11/781,679 | 2007-07-23 | ||
| US11/781,679 US20080131887A1 (en) | 2006-11-30 | 2007-07-23 | Genetic Analysis Systems and Methods |
| US97219807P | 2007-09-13 | 2007-09-13 | |
| US60/972,198 | 2007-09-13 | ||
| US98562207P | 2007-11-05 | 2007-11-05 | |
| US60/985,622 | 2007-11-05 | ||
| US98968507P | 2007-11-21 | 2007-11-21 | |
| US60/989,685 | 2007-11-21 |
Publications (2)
| Publication Number | Publication Date |
|---|---|
| WO2008067551A2 true WO2008067551A2 (en) | 2008-06-05 |
| WO2008067551A3 WO2008067551A3 (en) | 2008-12-11 |
Family
ID=38962435
Family Applications (1)
| Application Number | Title | Priority Date | Filing Date |
|---|---|---|---|
| PCT/US2007/086138 WO2008067551A2 (en) | 2006-11-30 | 2007-11-30 | Genetic analysis systems and methods |
Country Status (10)
| Country | Link |
|---|---|
| EP (1) | EP2102651A4 (en) |
| JP (2) | JP2010522537A (en) |
| KR (1) | KR20090105921A (en) |
| CN (1) | CN103642902B (en) |
| AU (1) | AU2007325021B2 (en) |
| CA (1) | CA2671267A1 (en) |
| GB (1) | GB2444410B (en) |
| HK (1) | HK1139737A1 (en) |
| TW (1) | TWI363309B (en) |
| WO (1) | WO2008067551A2 (en) |
Cited By (35)
| Publication number | Priority date | Publication date | Assignee | Title |
|---|---|---|---|---|
| WO2010017520A1 (en) * | 2008-08-08 | 2010-02-11 | Navigenics, Inc. | Methods and systems for personalized action plans |
| WO2010030929A1 (en) * | 2008-09-12 | 2010-03-18 | Navigenics, Inc. | Methods and systems for incorporating multiple environmental and genetic risk factors |
| WO2010044683A1 (en) * | 2008-10-15 | 2010-04-22 | Nikola Kirilov Kasabov | Data analysis and predictive systems and related methodologies |
| US7972787B2 (en) | 2007-02-16 | 2011-07-05 | Massachusetts Eye And Ear Infirmary | Methods for detecting age-related macular degeneration |
| WO2012006669A1 (en) * | 2010-07-13 | 2012-01-19 | Fitgenes Pty Ltd | System and method for determining personal health intervention |
| WO2012054653A2 (en) | 2010-10-19 | 2012-04-26 | Medtronic, Inc. | Diagnostic kits, genetic markers, and methods for scd or sca therapy selection |
| JP2012528573A (en) * | 2009-06-01 | 2012-11-15 | ジェネティック テクノロジーズ リミテッド | Breast cancer risk assessment method |
| US8340950B2 (en) | 2006-02-10 | 2012-12-25 | Affymetrix, Inc. | Direct to consumer genotype-based products and services |
| US8718950B2 (en) | 2011-07-08 | 2014-05-06 | The Medical College Of Wisconsin, Inc. | Methods and apparatus for identification of disease associated mutations |
| WO2014151081A1 (en) * | 2013-03-15 | 2014-09-25 | Pathway Genomics Corporation | Method and system to predict response to pain treatments |
| WO2015049593A1 (en) * | 2013-10-04 | 2015-04-09 | Hans-Michael Dosch | Method for reversing recent-onset type 1 diabetes (t1d) by administering substance p (sp) |
| US9092391B2 (en) | 2006-11-30 | 2015-07-28 | Navigenics, Inc. | Genetic analysis systems and methods |
| WO2015171370A1 (en) | 2014-05-05 | 2015-11-12 | Medtronic, Inc. | Methods and compositions for scd, crt, crt-d, or sca therapy identification and/or selection |
| WO2017048945A1 (en) * | 2015-09-16 | 2017-03-23 | Good Start Genetics, Inc. | Systems and methods for medical genetic testing |
| EP3066603A4 (en) * | 2013-11-04 | 2017-08-02 | MediSapiens Oy | Method and system for estimating genomic health |
| AU2016226162B2 (en) * | 2015-03-03 | 2017-11-23 | Nantomics, Llc | Ensemble-based research recommendation systems and methods |
| WO2018042185A1 (en) * | 2016-09-02 | 2018-03-08 | Imperial Innovations Ltd | Methods, systems and apparatus for identifying pathogenic gene variants |
| US10202637B2 (en) | 2013-03-14 | 2019-02-12 | Molecular Loop Biosolutions, Llc | Methods for analyzing nucleic acid |
| EP2636003B1 (en) * | 2010-11-01 | 2019-08-14 | Koninklijke Philips N.V. | In vitro diagnostic testing including automated brokering of royalty payments for proprietary tests |
| US10429399B2 (en) | 2014-09-24 | 2019-10-01 | Good Start Genetics, Inc. | Process control for increased robustness of genetic assays |
| US10437858B2 (en) | 2011-11-23 | 2019-10-08 | 23Andme, Inc. | Database and data processing system for use with a network-based personal genetics services platform |
| WO2020132456A1 (en) * | 2018-12-20 | 2020-06-25 | The Johns Hopkins University | Treating type 1 diabetes, other autoimmune diseases |
| US10851414B2 (en) | 2013-10-18 | 2020-12-01 | Good Start Genetics, Inc. | Methods for determining carrier status |
| US10896742B2 (en) | 2018-10-31 | 2021-01-19 | Ancestry.Com Dna, Llc | Estimation of phenotypes using DNA, pedigree, and historical data |
| US11041851B2 (en) | 2010-12-23 | 2021-06-22 | Molecular Loop Biosciences, Inc. | Methods for maintaining the integrity and identification of a nucleic acid template in a multiplex sequencing reaction |
| US11053548B2 (en) | 2014-05-12 | 2021-07-06 | Good Start Genetics, Inc. | Methods for detecting aneuploidy |
| US11101038B2 (en) | 2015-01-20 | 2021-08-24 | Nantomics, Llc | Systems and methods for response prediction to chemotherapy in high grade bladder cancer |
| US11149308B2 (en) | 2012-04-04 | 2021-10-19 | Invitae Corporation | Sequence assembly |
| CN114360732A (en) * | 2022-01-12 | 2022-04-15 | 平安科技(深圳)有限公司 | Medical data analysis method and device, electronic equipment and storage medium |
| US11348692B1 (en) | 2007-03-16 | 2022-05-31 | 23Andme, Inc. | Computer implemented identification of modifiable attributes associated with phenotypic predispositions in a genetics platform |
| US11408024B2 (en) | 2014-09-10 | 2022-08-09 | Molecular Loop Biosciences, Inc. | Methods for selectively suppressing non-target sequences |
| US11514085B2 (en) | 2008-12-30 | 2022-11-29 | 23Andme, Inc. | Learning system for pangenetic-based recommendations |
| US11657902B2 (en) | 2008-12-31 | 2023-05-23 | 23Andme, Inc. | Finding relatives in a database |
| US11680284B2 (en) | 2015-01-06 | 2023-06-20 | Moledular Loop Biosciences, Inc. | Screening for structural variants |
| US11840730B1 (en) | 2009-04-30 | 2023-12-12 | Molecular Loop Biosciences, Inc. | Methods and compositions for evaluating genetic markers |
Families Citing this family (59)
| Publication number | Priority date | Publication date | Assignee | Title |
|---|---|---|---|---|
| FR2934698B1 (en) * | 2008-08-01 | 2011-11-18 | Commissariat Energie Atomique | PREDICTION METHOD FOR THE PROGNOSIS OR DIAGNOSIS OR THERAPEUTIC RESPONSE OF A DISEASE AND IN PARTICULAR PROSTATE CANCER AND DEVICE FOR PERFORMING THE METHOD. |
| US8367333B2 (en) * | 2008-12-12 | 2013-02-05 | Decode Genetics Ehf. | Genetic variants as markers for use in diagnosis, prognosis and treatment of eosinophilia, asthma, and myocardial infarction |
| DE102010013114B4 (en) * | 2010-03-26 | 2012-02-16 | Rüdiger Lawaczeck | Prediagnostic safety system |
| KR20110136638A (en) * | 2010-06-15 | 2011-12-21 | 재단법인 게놈연구재단 | Online social network construction method and system with personal genome data |
| US20120078901A1 (en) * | 2010-08-31 | 2012-03-29 | Jorge Conde | Personal Genome Indexer |
| US20140310215A1 (en) * | 2011-09-26 | 2014-10-16 | John Trakadis | Method and system for genetic trait search based on the phenotype and the genome of a human subject |
| WO2013055911A1 (en) | 2011-10-14 | 2013-04-18 | Dana-Farber Cancer Institute, Inc. | Znf365/zfp365 biomarker predictive of anti-cancer response |
| KR101295785B1 (en) * | 2011-10-31 | 2013-08-12 | 삼성에스디에스 주식회사 | Apparatus and Method for Constructing Gene-Disease Relation Database |
| KR20140009854A (en) * | 2012-07-13 | 2014-01-23 | 삼성전자주식회사 | Method and apparatus for analyzing gene information for treatment decision |
| KR101967248B1 (en) * | 2012-08-16 | 2019-04-10 | 삼성전자주식회사 | Method and apparatus for analyzing personalized multi-omics data |
| JP5844715B2 (en) * | 2012-11-07 | 2016-01-20 | 学校法人沖縄科学技術大学院大学学園 | Data communication system, data analysis apparatus, data communication method, and program |
| KR101533395B1 (en) * | 2013-01-21 | 2015-07-08 | 이상열 | Method and system estimating resemblance between subject using single nucleotide polymorphism |
| WO2014119914A1 (en) * | 2013-02-01 | 2014-08-07 | 에스케이텔레콤 주식회사 | Method for providing information about gene sequence-based personal marker and apparatus using same |
| TW201516725A (en) * | 2013-10-18 | 2015-05-01 | Tci Gene Inc | Single nucleotide polymorphism disease incidence prediction system |
| DE202014010499U1 (en) | 2013-12-17 | 2015-10-20 | Kymab Limited | Targeting of human PCSK9 for cholesterol treatment |
| KR101400946B1 (en) | 2013-12-27 | 2014-05-29 | 한국과학기술정보연구원 | Biological network analyzing device and method thereof |
| KR102131973B1 (en) * | 2013-12-30 | 2020-07-08 | 주식회사 케이티 | Method and System for personalized healthcare |
| WO2016008899A1 (en) | 2014-07-15 | 2016-01-21 | Kymab Limited | Targeting human pcsk9 for cholesterol treatment |
| DE202015009006U1 (en) | 2014-07-15 | 2016-08-19 | Kymab Limited | Targeting of human PCSK9 for cholesterol treatment |
| EP3332790A1 (en) | 2014-07-15 | 2018-06-13 | Kymab Limited | Antibodies for use in treating conditions related to specific pcsk9 variants in specific patients populations |
| WO2016023916A1 (en) | 2014-08-12 | 2016-02-18 | Kymab Limited | Treatment of disease using ligand binding to targets of interest |
| EP3219809B1 (en) * | 2014-09-03 | 2021-10-27 | Otsuka Pharmaceutical Co., Ltd. | Pathology determination assistance device, method, program and storage medium |
| WO2016071701A1 (en) | 2014-11-07 | 2016-05-12 | Kymab Limited | Treatment of disease using ligand binding to targets of interest |
| JP2018513445A (en) * | 2015-02-09 | 2018-05-24 | 10エックス ゲノミクス,インコーポレイテッド | System and method for fading using structural variation identification and variant call data |
| KR102508971B1 (en) * | 2015-07-22 | 2023-03-09 | 주식회사 케이티 | Method and apparatus for predicting the disease risk |
| EP3350721A4 (en) * | 2015-09-18 | 2019-06-12 | Fabric Genomics, Inc. | Predicting disease burden from genome variants |
| KR101795662B1 (en) * | 2015-11-19 | 2017-11-13 | 연세대학교 산학협력단 | Apparatus and Method for Diagnosis of metabolic disease |
| FR3045874B1 (en) * | 2015-12-18 | 2019-06-14 | Axlr, Satt Du Languedoc Roussillon | ARCHITECTURE FOR GENOMIC DATA ANALYSIS |
| JP6776576B2 (en) * | 2016-03-28 | 2020-10-28 | 富士通株式会社 | Database processing program, database processing device and database processing method |
| KR101991007B1 (en) * | 2016-05-27 | 2019-06-20 | (주)메디젠휴먼케어 | A system and apparatus for disease-related genomic analysis using SNP |
| RU2765241C2 (en) * | 2016-06-29 | 2022-01-27 | Конинклейке Филипс Н.В. | Disease-oriented genomic anonymization |
| KR101815529B1 (en) | 2016-07-29 | 2018-01-30 | (주)신테카바이오 | Human Haplotyping System And Method |
| CN106778083A (en) * | 2016-11-28 | 2017-05-31 | 墨宝股份有限公司 | A kind of method and device for automatically generating genetic test report |
| EP3553737A4 (en) * | 2016-12-12 | 2019-11-06 | Nec Corporation | Information processing device, genetic information creation method, and program |
| WO2018168986A1 (en) * | 2017-03-15 | 2018-09-20 | 東洋紡株式会社 | Gene testing method and gene testing kit |
| CN108629153A (en) * | 2017-03-23 | 2018-10-09 | 广州康昕瑞基因健康科技有限公司 | Cma gene analysis method and system |
| US20200174021A1 (en) * | 2017-08-08 | 2020-06-04 | Queensland University Of Technology | Methods for diagnosis of early stage heart failure |
| KR102073590B1 (en) * | 2017-08-17 | 2020-02-06 | (주)에이엔티홀딩스 | Method, system and non-transitory computer-readable recording medium for providing a service based on genetic information |
| KR102097540B1 (en) * | 2017-12-26 | 2020-04-07 | 주식회사 클리노믹스 | Method for disease and phenotype risk score calculation |
| CN108549795A (en) * | 2018-03-13 | 2018-09-18 | 刘吟 | Genetic counselling information system based on pedigree chart frame |
| GB201810897D0 (en) * | 2018-07-03 | 2018-08-15 | Chronomics Ltd | Phenotype prediction |
| CN109355368A (en) * | 2018-10-22 | 2019-02-19 | 江苏美因康生物科技有限公司 | A kind of kit and method of quick detection hypertension individuation medication gene pleiomorphism |
| GB2578727A (en) * | 2018-11-05 | 2020-05-27 | Earlham Inst | Genomic analysis |
| JP7137520B2 (en) * | 2019-04-23 | 2022-09-14 | ジェネシスヘルスケア株式会社 | How to determine the risk of pancreatitis |
| JP7137524B2 (en) * | 2019-04-24 | 2022-09-14 | ジェネシスヘルスケア株式会社 | Methods for determining risk of knee osteoarthritis |
| JP7137525B2 (en) * | 2019-04-24 | 2022-09-14 | ジェネシスヘルスケア株式会社 | How to determine the risk of contact dermatitis |
| JP7137523B2 (en) * | 2019-04-24 | 2022-09-14 | ジェネシスヘルスケア株式会社 | How to determine your risk of hives |
| JP7137521B2 (en) * | 2019-04-24 | 2022-09-14 | ジェネシスヘルスケア株式会社 | How to determine your risk of psoriasis |
| JP7137522B2 (en) * | 2019-04-24 | 2022-09-14 | ジェネシスヘルスケア株式会社 | How to determine your scoliosis risk |
| JP7137526B2 (en) * | 2019-04-24 | 2022-09-14 | ジェネシスヘルスケア株式会社 | Methods for determining the risk of atopic dermatitis |
| KR102357453B1 (en) * | 2019-06-24 | 2022-02-04 | (주) 아이크로진 | Service method and platform for visualizing using a gene information |
| KR102091790B1 (en) * | 2019-09-02 | 2020-03-20 | 주식회사 클리노믹스 | System for providng genetic zodiac sign using genetic information between examinees and organisms |
| KR102179850B1 (en) * | 2019-12-06 | 2020-11-17 | 주식회사 클리노믹스 | System and method for predicting health using analysis device for intraoral microbes (bacteria, virus, viroid, and/or fungi) |
| KR102151716B1 (en) * | 2019-12-06 | 2020-09-04 | 주식회사 클리노믹스 | System for providing gemetic surmane information using genomic information |
| KR102136207B1 (en) * | 2019-12-31 | 2020-07-21 | 주식회사 클리노믹스 | Sytem for providing personalized social contents imformation based on genetic information and method thereof |
| KR102138165B1 (en) * | 2020-01-02 | 2020-07-27 | 주식회사 클리노믹스 | Method for providing identity analyzing service using standard genome map database by nationality, ethnicity, and race |
| KR102223362B1 (en) * | 2020-08-10 | 2021-03-05 | 주식회사 쓰리빌리언 | System and method to identify disease associated genetic variants by using symptom associated genetic variants relationship |
| KR102223361B1 (en) * | 2020-09-23 | 2021-03-05 | 주식회사 쓰리빌리언 | System for diagnosing genetic disease using gene network |
| CN113921143B (en) * | 2021-10-08 | 2024-04-16 | 天津金域医学检验实验室有限公司 | Personalized estimation method and system for Bayes factors in coseparation analysis |
Family Cites Families (20)
| Publication number | Priority date | Publication date | Assignee | Title |
|---|---|---|---|---|
| JP2000067139A (en) * | 1998-08-25 | 2000-03-03 | Hitachi Ltd | Electronic medical sheet system |
| AU785341B2 (en) * | 1999-08-27 | 2007-01-25 | Iris Biotechnologies Inc. | Artificial intelligence system for genetic analysis |
| AU1367201A (en) * | 1999-10-01 | 2001-05-10 | Orchid Biosciences, Inc. | Method and system for providing genotype clinical information over a computer network |
| US20030208454A1 (en) * | 2000-03-16 | 2003-11-06 | Rienhoff Hugh Y. | Method and system for populating a database for further medical characterization |
| JP2002107366A (en) * | 2000-10-02 | 2002-04-10 | Hitachi Ltd | Diagnosis-assisting system |
| US20050026117A1 (en) * | 2000-12-04 | 2005-02-03 | Judson Richard S | System and method for the management of genomic data |
| US20020128860A1 (en) * | 2001-01-04 | 2002-09-12 | Leveque Joseph A. | Collecting and managing clinical information |
| US20020187483A1 (en) * | 2001-04-20 | 2002-12-12 | Cerner Corporation | Computer system for providing information about the risk of an atypical clinical event based upon genetic information |
| US7461006B2 (en) * | 2001-08-29 | 2008-12-02 | Victor Gogolak | Method and system for the analysis and association of patient-specific and population-based genomic data with drug safety adverse event data |
| US20030104453A1 (en) * | 2001-11-06 | 2003-06-05 | David Pickar | System for pharmacogenetics of adverse drug events |
| US20040053263A1 (en) * | 2002-08-30 | 2004-03-18 | Abreu Maria T. | Mutations in NOD2 are associated with fibrostenosing disease in patients with Crohn's disease |
| WO2004109551A1 (en) * | 2003-06-05 | 2004-12-16 | Hitachi High-Technologies Corporation | Information providing system and program using base sequence related information |
| GB0313964D0 (en) * | 2003-06-16 | 2003-07-23 | Mars Inc | Genotype test |
| US7084264B2 (en) * | 2003-07-16 | 2006-08-01 | Chau-Ting Yeh | Viral sequences |
| US8222005B2 (en) * | 2003-09-17 | 2012-07-17 | Agency For Science, Technology And Research | Method for gene identification signature (GIS) analysis |
| CN1867922A (en) * | 2003-10-15 | 2006-11-22 | 株式会社西格恩波斯特 | Method of determining genetic polymorphism for judgment of degree of disease risk, method of judging degree of disease risk, and judgment array |
| US20050209787A1 (en) * | 2003-12-12 | 2005-09-22 | Waggener Thomas B | Sequencing data analysis |
| US7127355B2 (en) * | 2004-03-05 | 2006-10-24 | Perlegen Sciences, Inc. | Methods for genetic analysis |
| WO2006008045A1 (en) * | 2004-07-16 | 2006-01-26 | Bayer Healthcare Ag | Single nucleotide polymorphisms as prognostic tool to diagnose adverse drug reactions (adr) and drug efficacy |
| EP1824996A2 (en) * | 2004-11-19 | 2007-08-29 | Oy Jurilab Ltd | Method and kit for detecting a risk of essential arterial hypertension |
-
2007
- 2007-11-30 AU AU2007325021A patent/AU2007325021B2/en not_active Ceased
- 2007-11-30 GB GB0723512A patent/GB2444410B/en active Active
- 2007-11-30 KR KR1020097013756A patent/KR20090105921A/en not_active Application Discontinuation
- 2007-11-30 CN CN201310565723.1A patent/CN103642902B/en active Active
- 2007-11-30 EP EP07854875A patent/EP2102651A4/en not_active Ceased
- 2007-11-30 TW TW096145856A patent/TWI363309B/en not_active IP Right Cessation
- 2007-11-30 JP JP2009539519A patent/JP2010522537A/en active Pending
- 2007-11-30 CA CA002671267A patent/CA2671267A1/en not_active Abandoned
- 2007-11-30 WO PCT/US2007/086138 patent/WO2008067551A2/en active Application Filing
-
2010
- 2010-06-30 HK HK10106416.1A patent/HK1139737A1/en not_active IP Right Cessation
-
2014
- 2014-05-16 JP JP2014102062A patent/JP2014140387A/en active Pending
Non-Patent Citations (1)
| Title |
|---|
| See references of EP2102651A4 * |
Cited By (71)
| Publication number | Priority date | Publication date | Assignee | Title |
|---|---|---|---|---|
| US8340950B2 (en) | 2006-02-10 | 2012-12-25 | Affymetrix, Inc. | Direct to consumer genotype-based products and services |
| US9092391B2 (en) | 2006-11-30 | 2015-07-28 | Navigenics, Inc. | Genetic analysis systems and methods |
| US7972787B2 (en) | 2007-02-16 | 2011-07-05 | Massachusetts Eye And Ear Infirmary | Methods for detecting age-related macular degeneration |
| US8232056B2 (en) | 2007-02-16 | 2012-07-31 | Massachusetts Eye And Ear Infirmary | Methods for detecting neovascular age-related macular degeneration |
| US11791054B2 (en) | 2007-03-16 | 2023-10-17 | 23Andme, Inc. | Comparison and identification of attribute similarity based on genetic markers |
| US11581096B2 (en) | 2007-03-16 | 2023-02-14 | 23Andme, Inc. | Attribute identification based on seeded learning |
| US11581098B2 (en) | 2007-03-16 | 2023-02-14 | 23Andme, Inc. | Computer implemented predisposition prediction in a genetics platform |
| US11621089B2 (en) | 2007-03-16 | 2023-04-04 | 23Andme, Inc. | Attribute combination discovery for predisposition determination of health conditions |
| US11515047B2 (en) | 2007-03-16 | 2022-11-29 | 23Andme, Inc. | Computer implemented identification of modifiable attributes associated with phenotypic predispositions in a genetics platform |
| US11482340B1 (en) | 2007-03-16 | 2022-10-25 | 23Andme, Inc. | Attribute combination discovery for predisposition determination of health conditions |
| US11495360B2 (en) | 2007-03-16 | 2022-11-08 | 23Andme, Inc. | Computer implemented identification of treatments for predicted predispositions with clinician assistance |
| US11348691B1 (en) | 2007-03-16 | 2022-05-31 | 23Andme, Inc. | Computer implemented predisposition prediction in a genetics platform |
| US11515046B2 (en) | 2007-03-16 | 2022-11-29 | 23Andme, Inc. | Treatment determination and impact analysis |
| US11600393B2 (en) | 2007-03-16 | 2023-03-07 | 23Andme, Inc. | Computer implemented modeling and prediction of phenotypes |
| US11735323B2 (en) | 2007-03-16 | 2023-08-22 | 23Andme, Inc. | Computer implemented identification of genetic similarity |
| US11545269B2 (en) | 2007-03-16 | 2023-01-03 | 23Andme, Inc. | Computer implemented identification of genetic similarity |
| US11348692B1 (en) | 2007-03-16 | 2022-05-31 | 23Andme, Inc. | Computer implemented identification of modifiable attributes associated with phenotypic predispositions in a genetics platform |
| CN102171697A (en) * | 2008-08-08 | 2011-08-31 | 纳维哲尼克斯公司 | Methods and systems for personalized action plans |
| US20140172444A1 (en) * | 2008-08-08 | 2014-06-19 | Navigenics, Inc. | Methods and Systems for Personalized Action Plans |
| WO2010017520A1 (en) * | 2008-08-08 | 2010-02-11 | Navigenics, Inc. | Methods and systems for personalized action plans |
| TWI423063B (en) * | 2008-08-08 | 2014-01-11 | Navigenics Inc | Methods and systems for personalized action plans |
| GB2478065A (en) * | 2008-08-08 | 2011-08-24 | Navigenics Inc | Method and systems for personalized action plans |
| US20100042438A1 (en) * | 2008-08-08 | 2010-02-18 | Navigenics, Inc. | Methods and Systems for Personalized Action Plans |
| JP2015007985A (en) * | 2008-09-12 | 2015-01-15 | ナビジェニクス インコーポレイティド | Method and system for incorporating multiple environmental and genetic risk factors |
| TWI423151B (en) * | 2008-09-12 | 2014-01-11 | Navigenics Inc | Methods and systems for incorporating multiple environmental and genetic risk factors |
| CN102187344A (en) * | 2008-09-12 | 2011-09-14 | 纳维哲尼克斯公司 | Methods and systems for incorporating multiple environmental and genetic risk factors |
| GB2477868A (en) * | 2008-09-12 | 2011-08-17 | Navigenics Inc | Methods and systems for incorporating multiple environmental and genetic risk factors |
| WO2010030929A1 (en) * | 2008-09-12 | 2010-03-18 | Navigenics, Inc. | Methods and systems for incorporating multiple environmental and genetic risk factors |
| US9002682B2 (en) | 2008-10-15 | 2015-04-07 | Nikola Kirilov Kasabov | Data analysis and predictive systems and related methodologies |
| WO2010044683A1 (en) * | 2008-10-15 | 2010-04-22 | Nikola Kirilov Kasabov | Data analysis and predictive systems and related methodologies |
| US9195949B2 (en) | 2008-10-15 | 2015-11-24 | Nikola Kirilov Kasabov | Data analysis and predictive systems and related methodologies |
| US11514085B2 (en) | 2008-12-30 | 2022-11-29 | 23Andme, Inc. | Learning system for pangenetic-based recommendations |
| US11657902B2 (en) | 2008-12-31 | 2023-05-23 | 23Andme, Inc. | Finding relatives in a database |
| US11776662B2 (en) | 2008-12-31 | 2023-10-03 | 23Andme, Inc. | Finding relatives in a database |
| US11935628B2 (en) | 2008-12-31 | 2024-03-19 | 23Andme, Inc. | Finding relatives in a database |
| US11840730B1 (en) | 2009-04-30 | 2023-12-12 | Molecular Loop Biosciences, Inc. | Methods and compositions for evaluating genetic markers |
| JP2012528573A (en) * | 2009-06-01 | 2012-11-15 | ジェネティック テクノロジーズ リミテッド | Breast cancer risk assessment method |
| WO2012006669A1 (en) * | 2010-07-13 | 2012-01-19 | Fitgenes Pty Ltd | System and method for determining personal health intervention |
| WO2012054653A2 (en) | 2010-10-19 | 2012-04-26 | Medtronic, Inc. | Diagnostic kits, genetic markers, and methods for scd or sca therapy selection |
| EP2636003B1 (en) * | 2010-11-01 | 2019-08-14 | Koninklijke Philips N.V. | In vitro diagnostic testing including automated brokering of royalty payments for proprietary tests |
| US11041851B2 (en) | 2010-12-23 | 2021-06-22 | Molecular Loop Biosciences, Inc. | Methods for maintaining the integrity and identification of a nucleic acid template in a multiplex sequencing reaction |
| US11041852B2 (en) | 2010-12-23 | 2021-06-22 | Molecular Loop Biosciences, Inc. | Methods for maintaining the integrity and identification of a nucleic acid template in a multiplex sequencing reaction |
| US11768200B2 (en) | 2010-12-23 | 2023-09-26 | Molecular Loop Biosciences, Inc. | Methods for maintaining the integrity and identification of a nucleic acid template in a multiplex sequencing reaction |
| US8718950B2 (en) | 2011-07-08 | 2014-05-06 | The Medical College Of Wisconsin, Inc. | Methods and apparatus for identification of disease associated mutations |
| US10437858B2 (en) | 2011-11-23 | 2019-10-08 | 23Andme, Inc. | Database and data processing system for use with a network-based personal genetics services platform |
| US10936626B1 (en) | 2011-11-23 | 2021-03-02 | 23Andme, Inc. | Database and data processing system for use with a network-based personal genetics services platform |
| US10691725B2 (en) | 2011-11-23 | 2020-06-23 | 23Andme, Inc. | Database and data processing system for use with a network-based personal genetics services platform |
| US11155863B2 (en) | 2012-04-04 | 2021-10-26 | Invitae Corporation | Sequence assembly |
| US11667965B2 (en) | 2012-04-04 | 2023-06-06 | Invitae Corporation | Sequence assembly |
| US11149308B2 (en) | 2012-04-04 | 2021-10-19 | Invitae Corporation | Sequence assembly |
| US10202637B2 (en) | 2013-03-14 | 2019-02-12 | Molecular Loop Biosolutions, Llc | Methods for analyzing nucleic acid |
| WO2014151081A1 (en) * | 2013-03-15 | 2014-09-25 | Pathway Genomics Corporation | Method and system to predict response to pain treatments |
| WO2015049593A1 (en) * | 2013-10-04 | 2015-04-09 | Hans-Michael Dosch | Method for reversing recent-onset type 1 diabetes (t1d) by administering substance p (sp) |
| US9689038B2 (en) | 2013-10-04 | 2017-06-27 | Hans-Michael Dosch | Method for reversing recent-onset type 1 diabetes (T1D) by administering substance P (sP) |
| US9192647B2 (en) | 2013-10-04 | 2015-11-24 | Hans-Michael Dosch | Method for reversing recent-onset type 1 diabetes (T1D) by administering substance P (sP) |
| US10851414B2 (en) | 2013-10-18 | 2020-12-01 | Good Start Genetics, Inc. | Methods for determining carrier status |
| EP3066603A4 (en) * | 2013-11-04 | 2017-08-02 | MediSapiens Oy | Method and system for estimating genomic health |
| WO2015171370A1 (en) | 2014-05-05 | 2015-11-12 | Medtronic, Inc. | Methods and compositions for scd, crt, crt-d, or sca therapy identification and/or selection |
| US11053548B2 (en) | 2014-05-12 | 2021-07-06 | Good Start Genetics, Inc. | Methods for detecting aneuploidy |
| US11408024B2 (en) | 2014-09-10 | 2022-08-09 | Molecular Loop Biosciences, Inc. | Methods for selectively suppressing non-target sequences |
| US10429399B2 (en) | 2014-09-24 | 2019-10-01 | Good Start Genetics, Inc. | Process control for increased robustness of genetic assays |
| US11680284B2 (en) | 2015-01-06 | 2023-06-20 | Moledular Loop Biosciences, Inc. | Screening for structural variants |
| US11101038B2 (en) | 2015-01-20 | 2021-08-24 | Nantomics, Llc | Systems and methods for response prediction to chemotherapy in high grade bladder cancer |
| AU2016226162B2 (en) * | 2015-03-03 | 2017-11-23 | Nantomics, Llc | Ensemble-based research recommendation systems and methods |
| WO2017048945A1 (en) * | 2015-09-16 | 2017-03-23 | Good Start Genetics, Inc. | Systems and methods for medical genetic testing |
| WO2018042185A1 (en) * | 2016-09-02 | 2018-03-08 | Imperial Innovations Ltd | Methods, systems and apparatus for identifying pathogenic gene variants |
| US11735290B2 (en) | 2018-10-31 | 2023-08-22 | Ancestry.Com Dna, Llc | Estimation of phenotypes using DNA, pedigree, and historical data |
| US10896742B2 (en) | 2018-10-31 | 2021-01-19 | Ancestry.Com Dna, Llc | Estimation of phenotypes using DNA, pedigree, and historical data |
| WO2020132456A1 (en) * | 2018-12-20 | 2020-06-25 | The Johns Hopkins University | Treating type 1 diabetes, other autoimmune diseases |
| CN114360732A (en) * | 2022-01-12 | 2022-04-15 | 平安科技(深圳)有限公司 | Medical data analysis method and device, electronic equipment and storage medium |
| CN114360732B (en) * | 2022-01-12 | 2024-04-09 | 平安科技(深圳)有限公司 | Medical data analysis method, device, electronic equipment and storage medium |
Also Published As
| Publication number | Publication date |
|---|---|
| CN103642902B (en) | 2016-01-20 |
| TWI363309B (en) | 2012-05-01 |
| HK1139737A1 (en) | 2010-09-24 |
| GB2444410B (en) | 2011-08-24 |
| GB0723512D0 (en) | 2008-01-09 |
| EP2102651A2 (en) | 2009-09-23 |
| CA2671267A1 (en) | 2008-06-05 |
| EP2102651A4 (en) | 2010-11-17 |
| GB2444410A (en) | 2008-06-04 |
| AU2007325021B2 (en) | 2013-05-09 |
| CN103642902A (en) | 2014-03-19 |
| KR20090105921A (en) | 2009-10-07 |
| TW200847056A (en) | 2008-12-01 |
| WO2008067551A3 (en) | 2008-12-11 |
| AU2007325021A1 (en) | 2008-06-05 |
| JP2014140387A (en) | 2014-08-07 |
| JP2010522537A (en) | 2010-07-08 |
Similar Documents
| Publication | Publication Date | Title |
|---|---|---|
| WO2008067551A2 (en) | Genetic analysis systems and methods | |
| US9092391B2 (en) | Genetic analysis systems and methods | |
| Halldorsson et al. | The sequences of 150,119 genomes in the UK Biobank | |
| EP2215253B1 (en) | Method and computer system for correlating genotype to phenotype using population data | |
| TWI423151B (en) | Methods and systems for incorporating multiple environmental and genetic risk factors | |
| US20140172444A1 (en) | Methods and Systems for Personalized Action Plans | |
| US20200027557A1 (en) | Multimodal modeling systems and methods for predicting and managing dementia risk for individuals | |
| Ju et al. | Estimation of cell-free fetal DNA fraction from maternal plasma based on linkage disequilibrium information | |
| Mégarbané et al. | Developmental delay, intellectual disability, short stature, subglottic stenosis, hearing impairment, onychodysplasia of the index fingers, and distinctive facial features: A newly reported autosomal recessive syndrome | |
| Chaves et al. | A cohort study of neurodevelopmental disorders and/or congenital anomalies using high resolution chromosomal microarrays in southern Brazil highlighting the significance of ASD | |
| Liu | Multi-Scale Data-Driven Analysis of Sex Differences in Human Disease |
Legal Events
| Date | Code | Title | Description |
|---|---|---|---|
| WWE | Wipo information: entry into national phase |
Ref document number: 200780050019.5 Country of ref document: CN |
|
| 121 | Ep: the epo has been informed by wipo that ep was designated in this application |
Ref document number: 07854875 Country of ref document: EP Kind code of ref document: A2 |
|
| ENP | Entry into the national phase |
Ref document number: 2009539519 Country of ref document: JP Kind code of ref document: A |
|
| WWE | Wipo information: entry into national phase |
Ref document number: 2671267 Country of ref document: CA |
|
| WWE | Wipo information: entry into national phase |
Ref document number: 2007325021 Country of ref document: AU |
|
| NENP | Non-entry into the national phase |
Ref country code: DE |
|
| ENP | Entry into the national phase |
Ref document number: 2007325021 Country of ref document: AU Date of ref document: 20071130 Kind code of ref document: A |
|
| REEP | Request for entry into the european phase |
Ref document number: 2007854875 Country of ref document: EP |
|
| WWE | Wipo information: entry into national phase |
Ref document number: 1020097013756 Country of ref document: KR Ref document number: 2007854875 Country of ref document: EP |
|
| WWE | Wipo information: entry into national phase |
Ref document number: 12516915 Country of ref document: US |